. 2022 Mar;18(3):678-694.
doi: 10.1080/15548627.2021.1988357. Epub 2021 Nov 5.

GNS561, a clinical-stage PPT1 inhibitor, is efficient against hepatocellular carcinoma via modulation of lysosomal functions

Affiliations

GNS561, a clinical-stage PPT1 inhibitor, is efficient against hepatocellular carcinoma via modulation of lysosomal functions

Sonia Brun et al. Autophagy. 2022 Mar.

Abstract

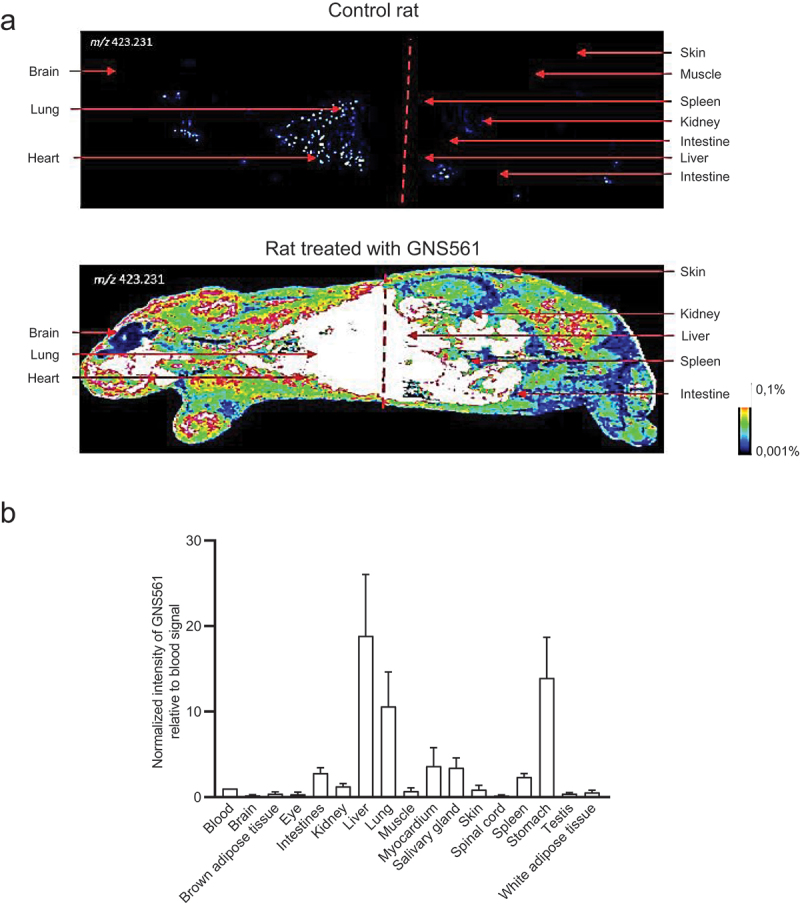
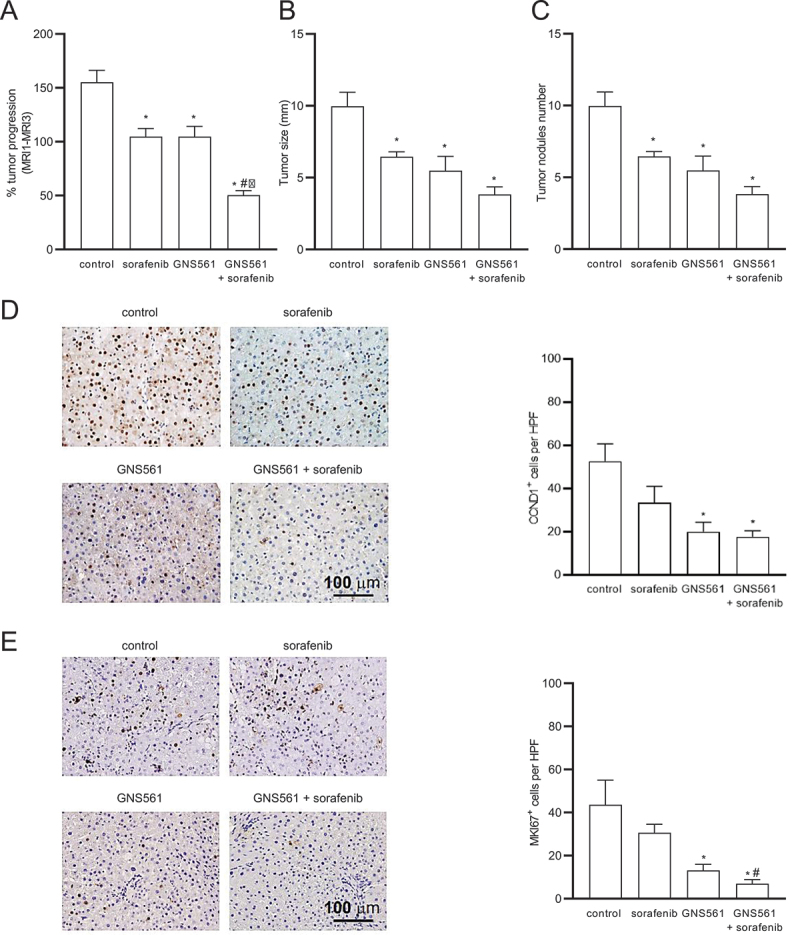
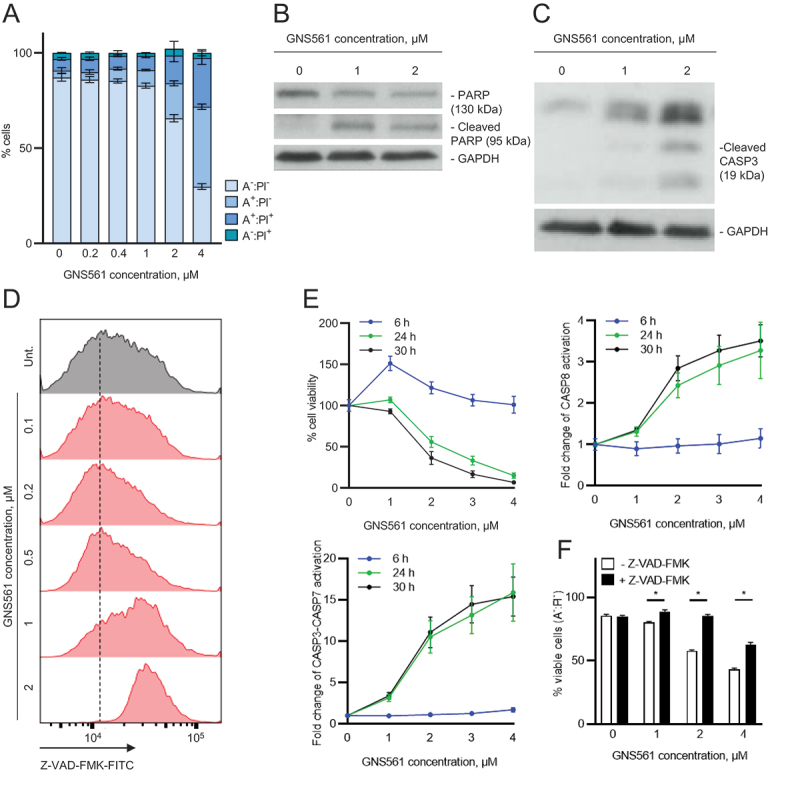
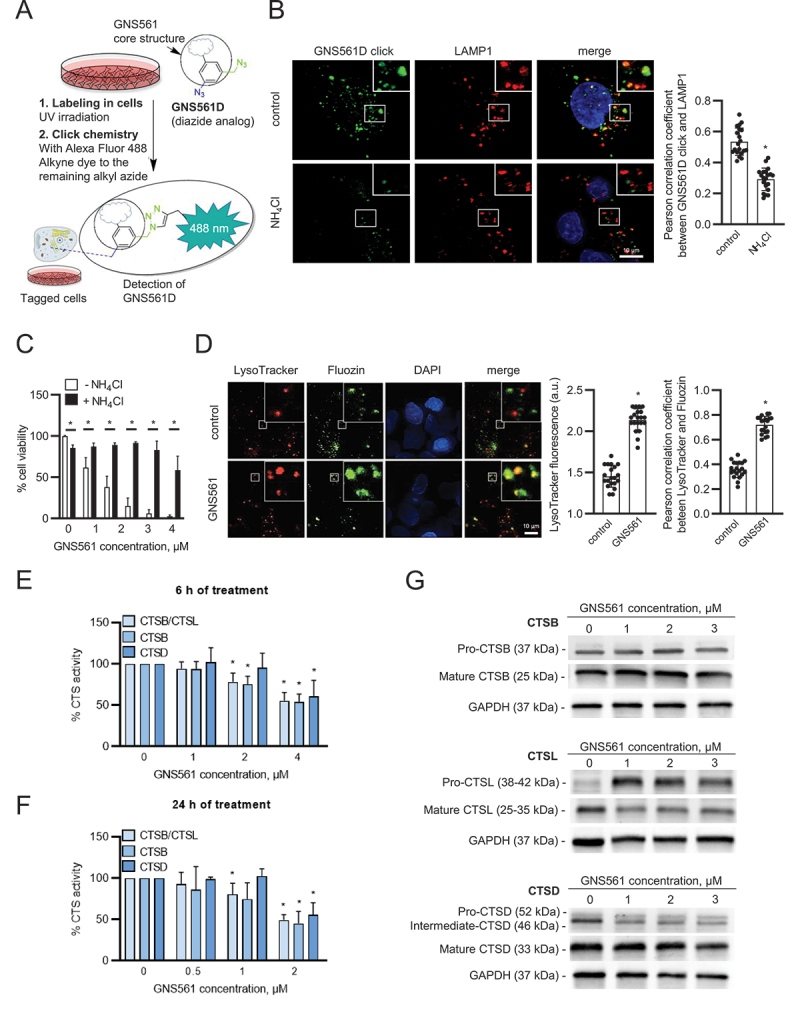
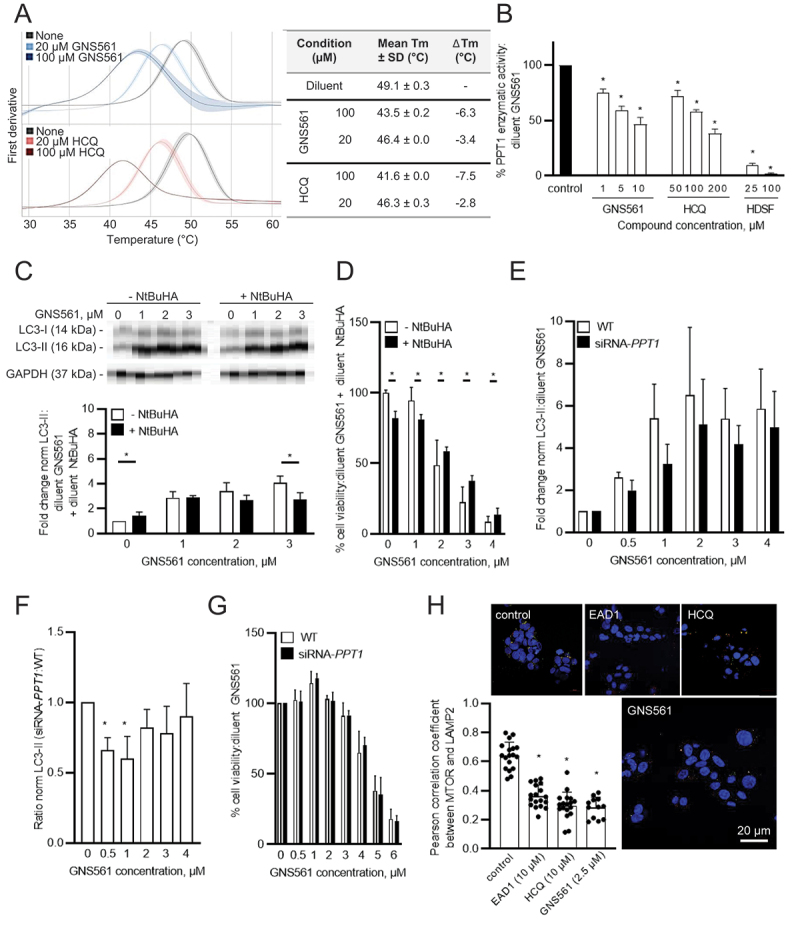
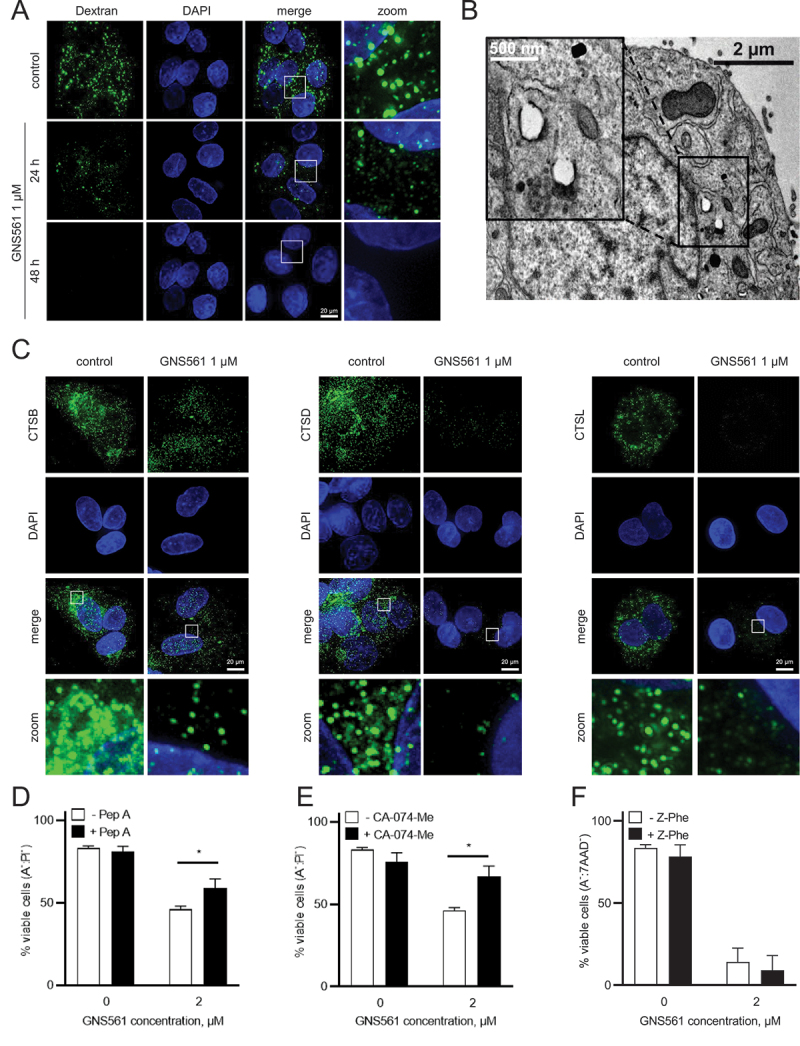
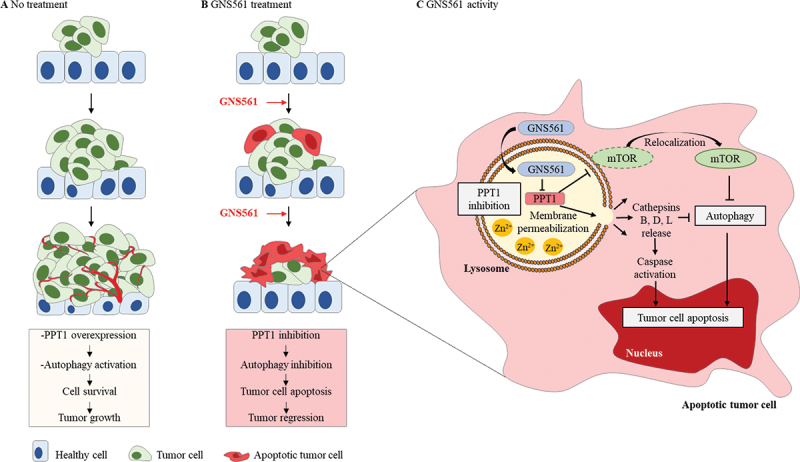
Hepatocellular carcinoma is the most frequent primary liver cancer. Macroautophagy/autophagy inhibitors have been extensively studied in cancer but, to date, none has reached efficacy in clinical trials. In this study, we demonstrated that GNS561, a new autophagy inhibitor, whose anticancer activity was previously linked to lysosomal cell death, displayed high liver tropism and potent antitumor activity against a panel of human cancer cell lines and in two hepatocellular carcinoma in vivo models. We showed that due to its lysosomotropic properties, GNS561 could reach and specifically inhibited its enzyme target, PPT1 (palmitoyl-protein thioesterase 1), resulting in lysosomal unbound Zn2+ accumulation, impairment of cathepsin activity, blockage of autophagic flux, altered location of MTOR (mechanistic target of rapamycin kinase), lysosomal membrane permeabilization, caspase activation and cell death. Accordingly, GNS561, for which a global phase 1b clinical trial in liver cancers was just successfully achieved, represents a promising new drug candidate and a hopeful therapeutic strategy in cancer treatment.Abbreviations: ANXA5:annexin A5; ATCC: American type culture collection; BafA1: bafilomycin A1; BSA: bovine serum albumin; CASP3: caspase 3; CASP7: caspase 7; CASP8: caspase 8; CCND1: cyclin D1; CTSB: cathepsin B; CTSD: cathepsin D; CTSL: cathepsin L; CQ: chloroquine; iCCA: intrahepatic cholangiocarcinoma; DEN: diethylnitrosamine; DMEM: Dulbelcco's modified Eagle medium; FBS: fetal bovine serum; FITC: fluorescein isothiocyanate; GAPDH: glyceraldehyde-3-phosphate dehydrogenase; HCC: hepatocellular carcinoma; HCQ: hydroxychloroquine; HDSF: hexadecylsulfonylfluoride; IC50: mean half-maximal inhibitory concentration; LAMP: lysosomal associated membrane protein; LC3-II: phosphatidylethanolamine-conjugated form of MAP1LC3; LMP: lysosomal membrane permeabilization; MALDI: matrix assisted laser desorption ionization; MAP1LC3/LC3: microtubule associated protein 1 light chain 3; MKI67: marker of proliferation Ki-67; MTOR: mechanistic target of rapamycin kinase; MRI: magnetic resonance imaging; NH4Cl: ammonium chloride; NtBuHA: N-tert-butylhydroxylamine; PARP: poly(ADP-ribose) polymerase; PBS: phosphate-buffered saline; PPT1: palmitoyl-protein thioesterase 1; SD: standard deviation; SEM: standard error mean; vs, versus; Zn2+: zinc ion; Z-Phe: Z-Phe-Tyt(tBu)-diazomethylketone; Z-VAD-FMK: carbobenzoxy-valyl-alanyl-aspartyl-[O-methyl]- fluoromethylketone.

Keywords: Antitumor; PPT1; autophagy; liver cancer; lysosome; mtor.


Conflict of interest statement

SB, EB, FB, ER, SM, MR, MN, JT, JC, CD, GJ, CS, CA and PH are employees of Genoscience Pharma. SB, ER, FB, CD, CS, CA and PH are shareholders of Genoscience Pharma. SB, FB, JC and PH are co-inventors of a pending patent. The other authors declare that they have no conflicts of interest to report.

Figures

Figure 1.
Figure 1.
Whole body tissue distribution of GNS561. (A) Mass spectrometry imaging of a control rat (top) and a rat treated with GNS561 at a dose of 40 mg/kg/day for 28 days (bottom). (B) Normalized intensity of GNS561 relative to blood signal in several organs of GNS561-treated rats (Mean + SEM, n = 2 except for eye, n = 1). Of note, the GNS561 liver-to-blood ratio is underestimated due to liver signal saturation.
Figure 2.
Figure 2.
GNS561 activity in a diethylnitrosanime-induced cirrhotic rat model of hepatocellular carcinoma. (A) Tumor progression assessment by comparison of tumor size obtained by MRI 1 and MRI 3 in the control, sorafenib at 10 mg/kg, GNS561 at 15 mg/kg and combination (GNS561 + sorafenib) groups. Macroscopic examination of livers with assessments of (B) tumor size and (C) tumor nodules number at the surface of livers. (D) Representative images of nuclear CCND1 staining and quantification of CCND1-positive staining per high-power field (HPF). (E) Representative images of nuclear MKI67 staining and quantification of MKI67-positive staining per HPF. For all studies, mice n ≥ 6 per group. Data represent the mean + SEM. Comparison of means was performed by one-way ANOVA with Dunnett’s post hoc analysis. *represents significant difference compared to control, #represents significant difference compared to sorafenib, ǂrepresents significant difference compared to GNS561, at least p < 0.05.
Figure 3.
Figure 3.
GNS561 induces apoptotic cell death in HepG2 cells in a dose and time-dependent manner through caspase activation. (A) ANXA5 (A):propidium iodide (PI) analysis by flow cytometry after 48 h of GNS561 treatment. (B) Representative immunoblotting of the cleaved and non-cleaved forms of PARP after 24 h of GNS561 treatment. (C) Representative immunoblotting of cleaved CASP3 levels after 24 h of treatment with GNS561. (D) Caspase-glow analysis by flow cytometry after 48 h of treatment with GNS561. (E) Cell viability and activation of CASP3-CASP7and CASP8 after 6, 24 and 30 h of treatment with GNS561. (F) Viable cell (A-:PI-) analysis by flow cytometry after pre-treatment with Z-VAD-FMK at 5 µM for 1 h and then treatment with Z-VAD-FMK at 5 µM and GNS561 for 48 h. For all blots, GAPDH was used as a loading control. For all studies, n ≥ 3 biological replicates. Data represent the mean + SEM. For comparison, Student t-test was used. *represents significant difference, at least p < 0.05.
Figure 4.
Figure 4.
The lysosomotropic agent GNS561 modulates lysosomal functions in the HepG2 cell line. (A) Chemical labeling of GNS561D in cells. The UV-irradiation activates the aryl azide, and then the click chemistry activates the alkyl azide to create the fluorescent moiety with the dye. (B) Lysosomal localization of GNS561D after NH4Cl pre-treatment (20 mM) for 30 min and then treatment with GNS561D (10 µM) and NH4Cl (20 mM) for 90 min. (C) Cell viability after 24 h of GNS561 exposure in the presence or absence of NH4Cl (20 mM). (D) Staining of lysosomes (LysoTracker) and unbound Zn2+ (Fluozin) after GNS561 treatment (1 h, 10 µM). Quantification of LysoTracker fluorescence in arbitrary units (a.u.) (middle panel) and lysosomal unbound Zn2+ accumulation by Pearson correlation coefficient between LysoTracker and Fluozin (right panel). Fold change of peptidase activity of cysteine cathepsins (including both CTSB-CTSL), CTSB and CTSD after (E) 6 h and (F) 24 h of treatment with GNS561 calculated in comparison with the control condition. (G) Representative immunoblotting of pro-CTSB (precursor form) and mature CTSB (top), pro-CTSL (precursor form) and mature CTSL (middle) and pro-CTSD, intermediate and mature CTSD (bottom) after GNS561 treatment for 16 h. For all blots, GAPDH was used as a loading control. For all studies, n ≥ 3 biological replicates. Data represent the mean + SEM. For comparison, Student t-test was used for (B), (C) and (D), and one-way ANOVA with Dunnett’s post hoc analysis was performed for (E) and (F). *represents significant difference, at least p < 0.05.
Figure 5.
Figure 5.
GNS561 targets PPT1. (A) Nano differential scanning fluorimetry assays comparing GNS561 + PPT1 and HCQ + PPT1 against the apo-PPT1 ligand. Data represent the mean first derivative values (solid lines) ± SEM (shaded areas) of two experiments. SD from the mean is indicated by the light-color shading around the mean-line. Tm were determined by detecting the maximum of the first derivative of the fluorescence ratios. ΔTm values of each compound condition were determined by subtracting average Tm of PPT1 (in the respective buffer) by the average Tm of the respective compound condition. (B) PPT1 enzymatic activity of HepG2 cells treated with GNS561 for 3 h. HCQ and HDSF were used as positive controls. The results were compared to the diluent of GNS561 (control condition). (C) Representative immunoblotting of LC3-II in HepG2 cells treated with GNS561 for 16 h in the presence or absence of NtBuHA (8 mM). GAPDH was used as a loading control. Fold changes of normalized LC3-II level were calculated against the control condition (diluent of GNS561 + diluent of NtBuHA). (D) Cell viability percent against the control condition (diluent of GNS561 + diluent of NtBuHA) after 24 h of treatment with GNS561 in the presence or absence of NtBuHA (8 mM). (E) Fold change of normalized LC3-II (norm LC3-II) level were calculated against the control condition (diluent of GNS561) in HepG2 cells WT or siRNA-PPT1 treated by GNS561 for 24 h. GAPDH was used as a loading control. (F) Ratio of norm LC3-II between siRNA-PPT1 and WT HepG2 cells treated by GNS561 for 24 h. (G) Cell viability percent against the control condition (diluent of GNS561) after 24 h of treatment with GNS561 of WT and siRNA-PPT1 HepG2 cells. (H) Staining of lysosomes (LAMP2, green), MTOR (red) and nucleus (4′,6-diamidino-2-phenylindole [DAPI], blue) after treatment with GNS561 and two positive controls, EAD1 and HCQ, for 16 h. Pearson correlation coefficient between MTOR and LAMP2 was represented using scatter dot plot representation. In (B), (C), (D), (E), (F) and (G), data represent the mean + SEM. For comparison, Student t-test was used for (C), (D), (E), and (G) and one-way ANOVA with Dunnett’s post hoc analysis was performed for (B), (F) and (H). For all studies except (A), n ≥ 3 biological replicates. *represents significant difference, at least p < 0.05.
Figure 6.
Figure 6.
GNS561 induces lysosomal membrane permeabilization and cathepsin-dependent cell death in HepG2 cells. (A) Localization of FITC-dextran after GNS561 treatment for the indicated times. (B) Electron microscopy imaging of lysosomal membrane permeabilization (arrows) after GNS561 treatment (3 µM) for 24 h. (C) Localization of CTSB, CTSD and CTSL after GNS561 treatment for 48 h. (D) Viable cell (ANXA5 (A):propidium iodide (PI)) analysis by flow cytometry of cells pre-treated or not with pepstatin A (Pep A) (5 µM) for 1 h and then treated with Pep A (5 µM) and GNS561 or with GNS561 alone for 48 h. (E) Viable cell (A:PI) analysis by flow cytometry of cells pre-treated or not with CA-074-Me (20 µM) for 1 h and then treated with CA-074-Me (20 µM) and GNS561 or with GNS561 alone for 48 h. (F) Viable cell (A:7-aminoactinomycine D [7AAD]) analysis by flow cytometry of cells pre-treated or not with Z-Phe (10 µM) for 1 h and then treated with Z-Phe (10 µM) and GNS53-61 or with GNS561 alone for 48 h. Three independent experiments were performed. Data represent the mean + SEM. For comparison, Student t-test was used. For all studies, n ≥ 3 biological replicates. Data represent the mean + SEM. For comparison, Student t-test was used. *represents significant difference, at least p < 0.05.
Figure 7.
Figure 7.
Schematic representation of molecular and cellular mechanisms involved in the antitumoral activity of GNS561. (A) Schematic illustration showing the stages of untreated tumor progression where autophagy activation and overexpression of PPT1 have been singled out in cell survival and tumor growth. (B) GNS561 compound localizes in lysosomes where it binds and inhibits PPT1 resulting in lysosomal unbound Zn2+ accumulation, impairment of cathepsin activity, autophagic flux inhibition, alters location of MTOR and leads to lysosomal membrane permeabilization. Finally, all these events induce caspase activation and tumor cell apoptosis.

References

    1. Bray F, Ferlay J, Soerjomataram I, et al. Global cancer statistics 2018: GLOBOCAN estimates of incidence and mortality worldwide for 36 cancers in 185 countries. CA Cancer J Clin. 2018;68(6):394–424. - PubMed
    1. Aits S, Jäättelä M.. Lysosomal cell death at a glance. J Cell Sci. 2013;126(9):1905–1912. - PubMed
    1. Klempner SJ, Myers AP, Cantley LC, et al. What a tangled web we weave: emerging resistance mechanisms to inhibition of the phosphoinositide 3-kinase pathway. Cancer Discov. 2013;3(12):1345–1354. - PMC - PubMed
    1. Rebecca VW, Nicastri MC, Fennelly C, et al. PPT1 promotes tumor growth and is the molecular target of chloroquine derivatives in cancer. Cancer Discov. 2019;9(2):220–229. - PMC - PubMed
    1. Rebecca VW, Nicastri MC, McLaughlin N, et al. A unified approach to targeting the lysosome’s degradative and growth signaling roles. Cancer Discov. 2017;7(11):1266–1283. - PMC - PubMed

MeSH terms