

Describing the indirect impact of COVID-19 on healthcare utilisation using syndromic surveillance systems
- PMID: 34740346
- PMCID: PMC8571013
- DOI: 10.1186/s12889-021-12117-5
Describing the indirect impact of COVID-19 on healthcare utilisation using syndromic surveillance systems
Abstract
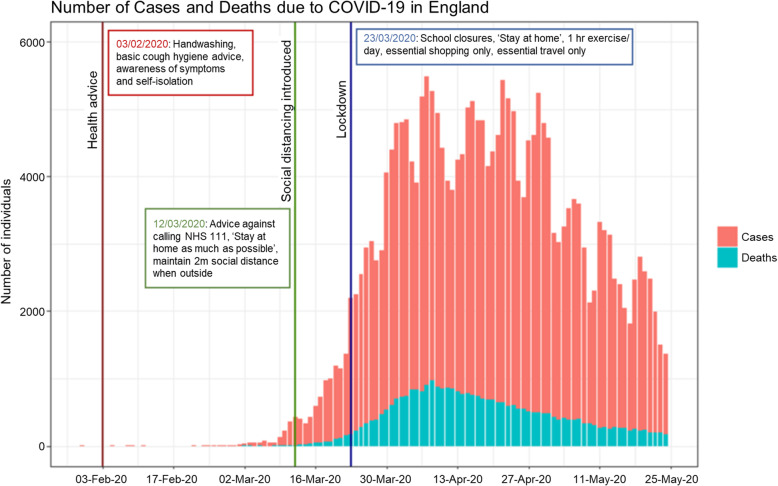
Background: Since the end of January 2020, the coronavirus (COVID-19) pandemic has been responsible for a global health crisis. In England a number of non-pharmaceutical interventions have been introduced throughout the pandemic, including guidelines on healthcare attendance (for example, promoting remote consultations), increased handwashing and social distancing. These interventions are likely to have impacted the incidence of non-COVID-19 conditions as well as healthcare seeking behaviour. Syndromic Surveillance Systems offer the ability to monitor trends in healthcare usage over time.
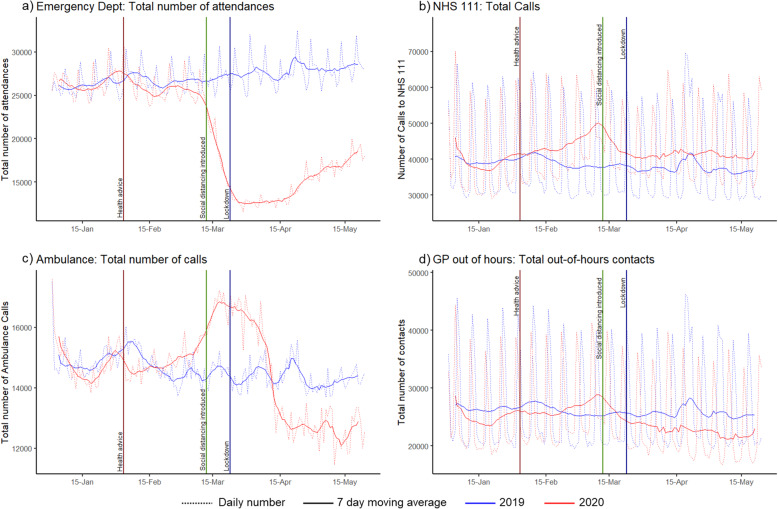
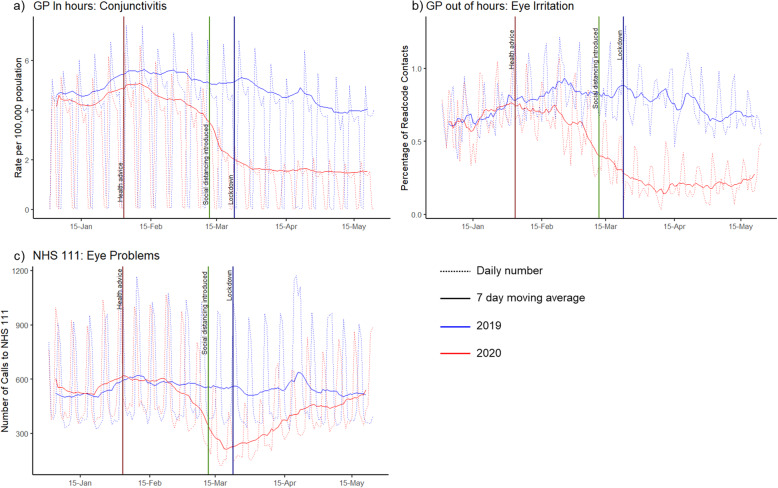
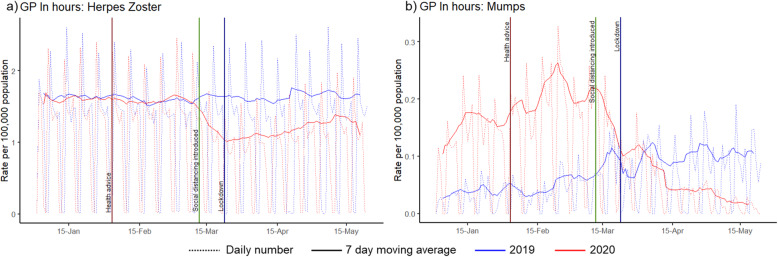
Methods: This study describes the indirect impact of COVID-19 on healthcare utilisation using a range of syndromic indicators including eye conditions, mumps, fractures, herpes zoster and cardiac conditions. Data from the syndromic surveillance systems monitored by Public Health England were used to describe the number of contacts with NHS 111, general practitioner (GP) In Hours (GPIH) and Out-of-Hours (GPOOH), Ambulance and Emergency Department (ED) services over comparable periods before and during the pandemic.
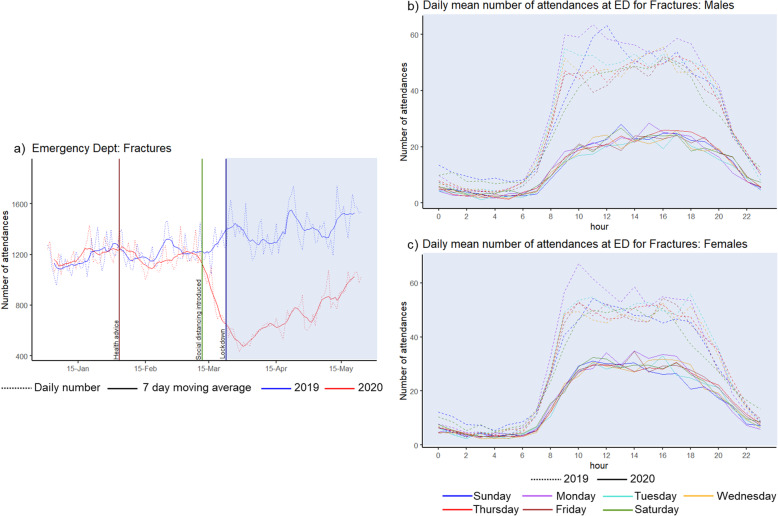
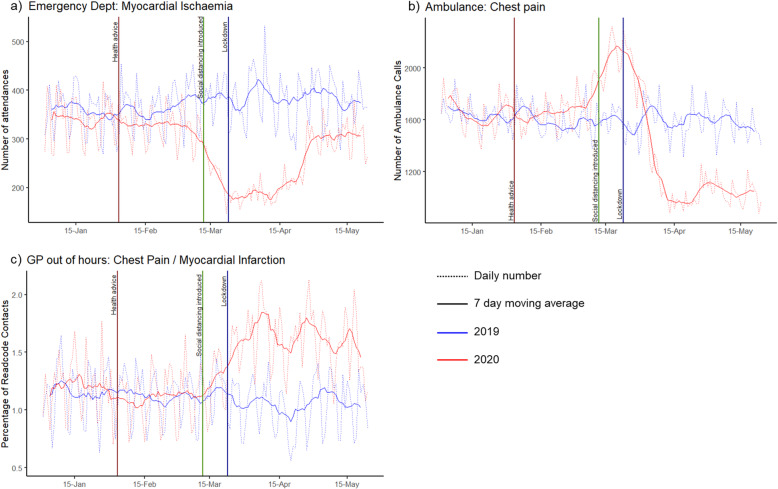
Results: The peak pandemic period in 2020 (weeks 13-20), compared to the same period in 2019, displayed on average a 12% increase in NHS 111 calls, an 11% decrease in GPOOH consultations, and a 49% decrease in ED attendances. In the GP In Hours system, conjunctivitis consultations decreased by 64% and mumps consultations by 31%. There was a 49% reduction in attendance at EDs for fractures, and there was no longer any weekend increase in ED fracture attendances, with similar attendance patterns observed across each day of the week. There was a decrease in the number of ED attendances with diagnoses of myocardial ischaemia.
Conclusion: The COVID-19 pandemic drastically impacted healthcare utilisation for non-COVID-19 conditions, due to a combination of a probable decrease in incidence of certain conditions and changes in healthcare seeking behaviour. Syndromic surveillance has a valuable role in describing and understanding these trends.
Keywords: Coronavirus; Epidemiology; Healthcare utilisation; Pandemic; Syndromic surveillance; Viral.
© 2021. The Author(s).
Conflict of interest statement
TCH is a director of L2S2 Ltd. All other authors declare that they have no competing interests.
Figures
References
-
- World Health Organisation. [Internet] WHO Coronavirus Disease (COVID-19) Dashboard. 2020. Geneva, Switzerland. Available from: https://covid19.who.int/ Accessed 21st June 2021.
-
- Lillie PJ, Samson A, Li A, Adams K, Capstick R, Barlow GD, Easom N, Hamilton E, Moss PJ, Evans A, Ivan M, PHE Incident Team, Taha Y, Duncan CJA, Schmid ML, the Airborne HCID Network Novel coronavirus disease (COVID-19): the first two patients in the UK with person to person transmission. J Inf Secur. 2020;80(5):578–606. doi: 10.1016/j.jinf.2020.02.020. - DOI - PMC - PubMed
-
- Public Health England. [Internet] Weekly Coronavirus Disease 2019 (COVID-19) Surveillance Report - Week 35. Available from: https://www.gov.uk/government/news/weekly-covid-19-surveillance-report-p... Accessed 2nd September 2020.
-
- UK Government. [Internet] Coronavirus public information campaign launched across the UK. London, England. Available from: https://www.gov.uk/government/news/coronavirus-public-information-campai... Accessed 2nd September 2020.
Publication types
MeSH terms
LinkOut - more resources
Full Text Sources
Medical
