. 2021 Nov 5;12(1):6427.
doi: 10.1038/s41467-021-26018-z.

RAB5A expression is a predictive biomarker for trastuzumab emtansine in breast cancer

Affiliations

RAB5A expression is a predictive biomarker for trastuzumab emtansine in breast cancer

Olav Engebraaten et al. Nat Commun. .

Abstract

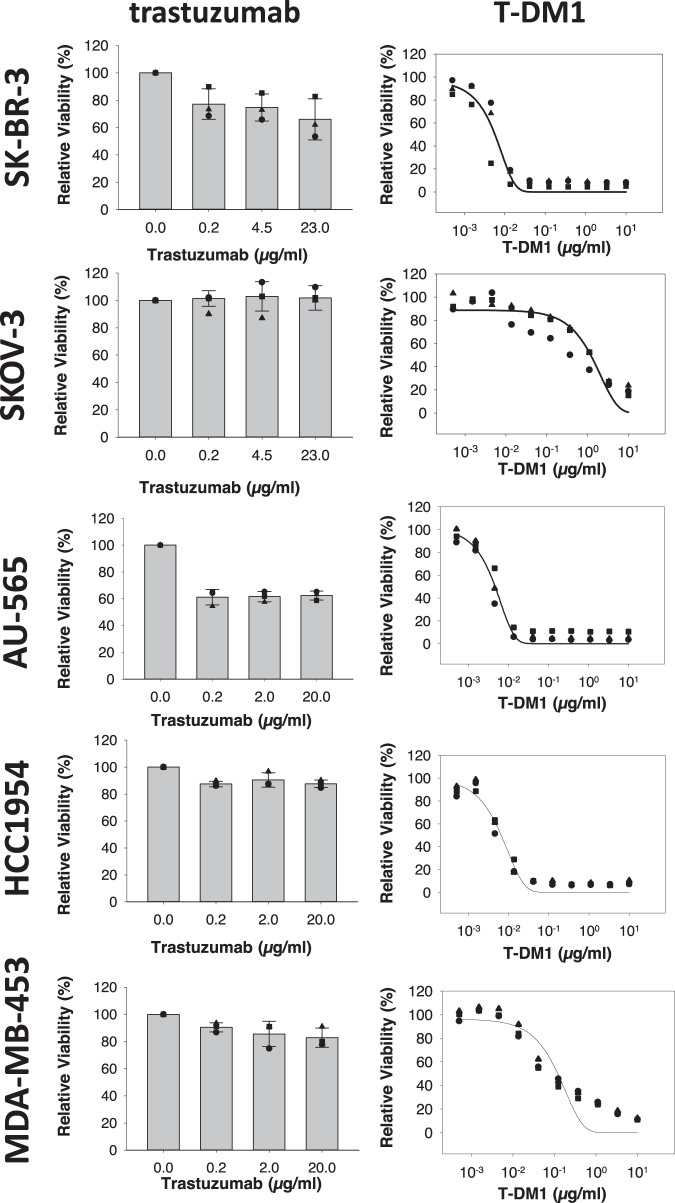
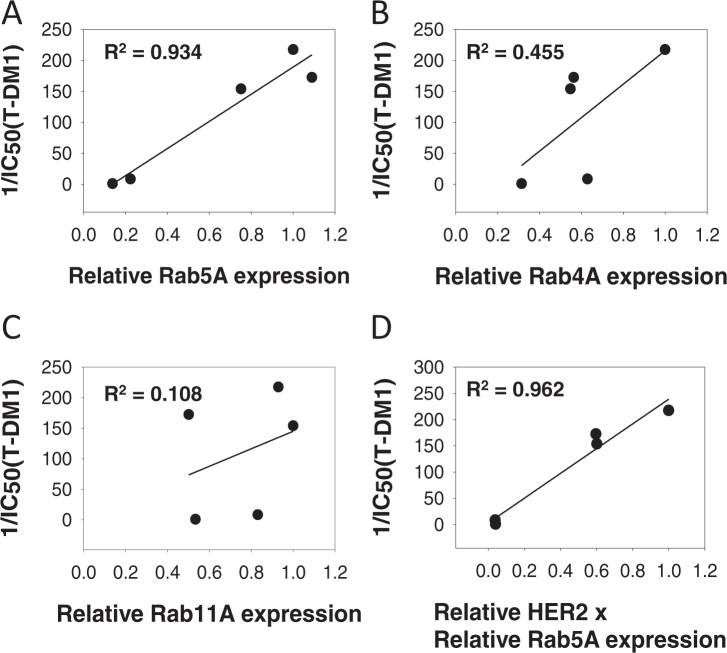
HER2 is a predictive biomarker for HER2-targeted therapeutics. For antibody-drug conjugates (ADCs; e.g., trastuzumab emtansine (T-DM1)), HER2 is utilized as a transport gate for cytotoxic agents into the cell. ADC biomarkers may therefore be more complex, also reflecting the intracellular drug transport. Here we report on a positive correlation between the early endosome marker RAB5A and T-DM1 sensitivity in five HER2-positive cell lines. Correlation between RAB5A expression and T-DM1 sensitivity is confirmed in breast cancer patients treated with trastuzumab emtansine/pertuzumab in the I-SPY2 trial (NCT01042379), but not in the trastuzumab/paclitaxel control arm. The clinical correlation is further verified in patients from the KAMILLA trial (NCT01702571). In conclusion, our results suggest RAB5A as a predictive biomarker for T-DM1 response and outline proteins involved in endocytic trafficking as predictive biomarkers for ADCs.


Conflict of interest statement

A patent application entitled “Diagnosis and treatment of cancer” by Anette Weyergang, Kristian Berg, Olav Engebraaten, and Maria E.B. Berstad, application number: WO 2018/234872 A1 is currently in the national phase.

Figures

Fig. 1
Fig. 1. In vitro sensitivity to trastuzumab and T-DM1.
Relative viability (MTT) of SK-BR-3, SKOV-3, AU-565, HCC1954, and MDA-MB-453 following 72 h treatments with indicated drugs. The sigmoid curve fit model a/(1 + exp(−(x − x0)/b)) was used for T-DM1. Data points represent the observed values of three independent experiments, the bar represents the average and the error bars represent the SD(trastuzumab). Source data are provided as a Source Data file.
Fig. 2
Fig. 2. HER2 and RAB GTPase expression in cell lines.
A Representative Western blot of HER2 and γ-tubulin expression in SK-BR-3, SKOV-3, HCC1954, AU-565, MDA-MB-453, and MDA-MB-231 cells (n = 3). B Quantification of the HER2 Western blots relative to those of γ-tubulin. Data points represent the values of three independent experiments, the bars represent the average and the error bars represent the SD of the mean. C Linear regression analysis curve of HER2 protein expression and T-DM1 sensitivity (1/IC50(T-DM1)). D Representative western blot (n = 3) of RAB4A, RAB5A, RAB11A, and γ-tubulin expression in SK-BR-3, SKOV-3, AU-565, HCC1954, and MDA-MB-453 cells. EG Quantification of the RAB4, RAB5, and RAB11 Western blots relative to those of γ-tubulin. Data points represent the values of three independent experiments, the bars represent the average and the error bars represent the SD of the mean. Source data are provided as a Source Data file.
Fig. 3
Fig. 3. T-DM1 and RAB GTPase in vitro correlations.
Linear regression analysis curves between RAB5A (A), RAB4A (B), and RAB11A (C) protein expression (average of N = 3 as presented in Fig. 2) and T-DM1 sensitivity (1/IC50(T-DM1)) (average of N = 3 as presented in Fig. 1 and Table 1) in the five cell lines. D The linear regression curve between HER2 (average of N = 3 as presented in Fig. 2) × RAB5A protein expression and T-DM1 response. Each data point represents one cell line. Source data are provided as a Source Data file.
Fig. 4
Fig. 4. T-DM1 and RAB GTPase correlations in the I-SPY2 cohort.
A Number of patients, hormone receptor (HR) status, and pathological complete responses (pCR) in the T-DM1 + pertuzumab and trastuzumab-paclitaxel arm of the I-SPY2 study. B Association plot summarizing qualifying biomarker analyses of RAB4A, RAB5A, and RAB11A expression levels as specific predictors of pCR to indicated treatment. Results are organized by the logistic model/data used along the rows, and the biomarker evaluated along the columns. Circle sizes are proportional to the significance (−log10 (LR test p)); and circle color reflects the magnitude of coefficient (red: positive, blue: negative) from each corresponding logistic model. White background indicates p < 0.05, and the odds ratio associated with 1 standard deviation increase in expression were also shown (in white) inside the circle. The 95% confidence intervals for the coefficients are found in Supplementary Table 1. Source data are provided as a Source Data file.
Fig. 5
Fig. 5. Patient distribution within pCR and RAB5A expression in I-SPY2.
A Boxplots of RAB5A expression levels stratified by arm and pCR status (N = 83). The midline represents the median of RAB5 expression levels within each group (T-DM1 + pertuzumab-treated, no pCR: N = 22 independent samples; T-DM1 + pertuzumab-treated, pCR: N = 30 independent samples; trastuzumab + paclitaxel-treated, no pCR: N = 23 independent samples; trastuzumab + paclitaxel-treated, pCR: N = 8 independent samples). The upper and lower limits of the box correspond to the 1st and 3rd quartile of RAB5A expression, respectively, with whiskers extending to 1.5 times the interquartile range from top/bottom of the box. Dots represent expression values for each individual; and color reflects subtype (orange: HR+; green: HR−). B Mosaic plot showing patient distribution within the RAB5A RNA-high and -low based on the threshold of 9.76 by arm and pCR status. CE The bayesian estimated pCR rates within the two treatment groups overall (C) as well as when divided in RAB5A RNA-high (D) and low (E) subsets. F, G ROC curves of the performance of RAB5A RNA as a biomarker in T-DM1 + pertuzumab-treated (F)- and trastuzumab + paclitaxel-treated (G) patients. Source data are provided as a Source Data file.
Fig. 6
Fig. 6. T-DM1 and RAB5A correlation in a subset of patients in KAMILLA.
A Box blot indicating the distribution of PFS in RAB5A low (Allred score 0–6, N = 11 independent samples) and RAB5A-high (Allred score 7 and 8, N = 8 independent samples) expressing patients. The midline represents the median of progression-free survival. The upper and lower limits of the box correspond to the 75% and 25% percentile of progression-free survival respectively; the whiskers represent the 90% and 10% percentile. The data points represent the individual data points in each group. A Mann–Whitney rank-sum test was used to determine the statistical difference in the median values between the two groups. B Exemplified images (×40 objective) of RAB5A IHC for Allred score 0 (patient #20), Allred score 3 (patient # 19), Allred score 6 (patient #21), Allred score 7 (patient #24) and Allred score 8 (patient #15). Scale bars: 100 µm. All samples were manually screened by 2 observers. Consensus on staining intensity and amount was obtained, and representative areas defined. Number of images captured from each slide: patient #20 4 images, patient #19 10 images, patient #21 8 images, patient #24 6 images, patient #15 4 images. Source data are provided as a Source Data file.

References

    1. de Gramont A, et al. Pragmatic issues in biomarker evaluation for targeted therapies in cancer. Nat. Rev. Clin. Oncol. 2015;12:197–212. doi: 10.1038/nrclinonc.2014.202. - DOI - PubMed
    1. Slamon DJ, et al. Studies of the HER-2/neu proto-oncogene in human breast and ovarian cancer. Science. 1989;244:707–712. doi: 10.1126/science.2470152. - DOI - PubMed
    1. Hernandez-Blanquisett A, et al. Current and emerging therapies of HER2-positive metastatic breast cancer. Breast. 2016;29:170–177. doi: 10.1016/j.breast.2016.07.026. - DOI - PubMed
    1. Rimawi MF, Schiff R, Osborne CK. Targeting HER2 for the treatment of breast cancer. Annu. Rev. Med. 2015;66:111–128. doi: 10.1146/annurev-med-042513-015127. - DOI - PubMed
    1. Clynes RA, Towers TL, Presta LG, Ravetch JV. Inhibitory Fc receptors modulate in vivo cytotoxicity against tumor targets. Nat. Med. 2000;6:443–446. doi: 10.1038/74704. - DOI - PubMed

Publication types

MeSH terms

Associated data