. 2021 Nov 5;12(1):6434.
doi: 10.1038/s41467-021-26553-9.

Role of mutations and post-translational modifications in systemic AL amyloidosis studied by cryo-EM

Affiliations

Role of mutations and post-translational modifications in systemic AL amyloidosis studied by cryo-EM

Lynn Radamaker et al. Nat Commun. .

Abstract

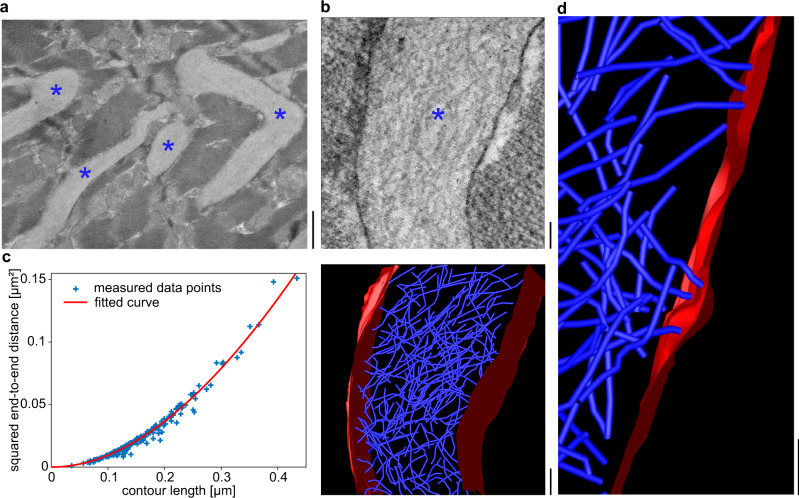
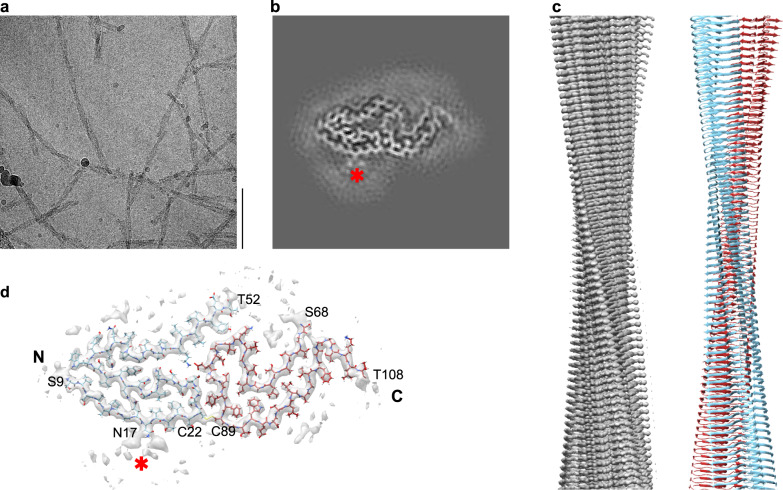
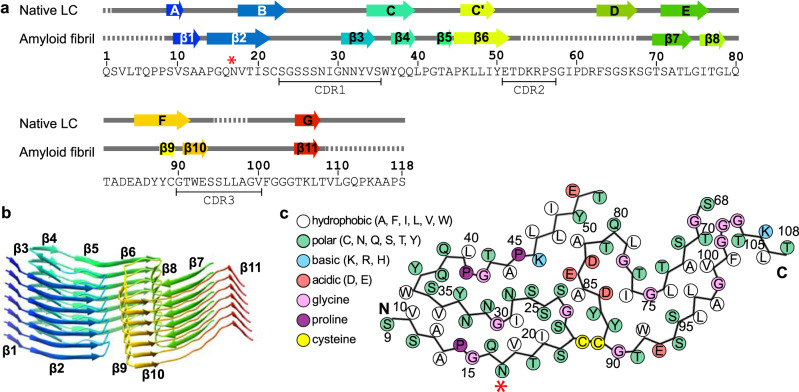
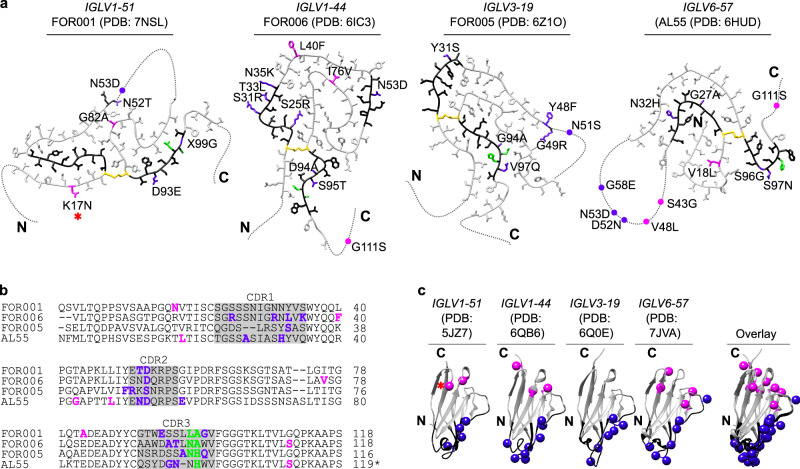
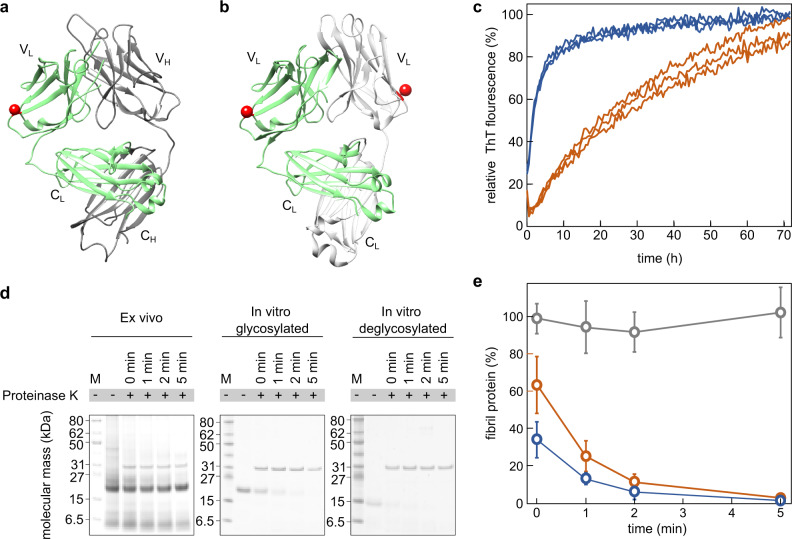
Systemic AL amyloidosis is a rare disease that is caused by the misfolding of immunoglobulin light chains (LCs). Potential drivers of amyloid formation in this disease are post-translational modifications (PTMs) and the mutational changes that are inserted into the LCs by somatic hypermutation. Here we present the cryo electron microscopy (cryo-EM) structure of an ex vivo λ1-AL amyloid fibril whose deposits disrupt the ordered cardiomyocyte structure in the heart. The fibril protein contains six mutational changes compared to the germ line and three PTMs (disulfide bond, N-glycosylation and pyroglutamylation). Our data imply that the disulfide bond, glycosylation and mutational changes contribute to determining the fibril protein fold and help to generate a fibril morphology that is able to withstand proteolytic degradation inside the body.


Conflict of interest statement

The authors declare no competing interests.

Figures

Fig. 1
Fig. 1. Tissue deposits of FOR001 amyloid fibrils.
a SEM overview of FOR001 heart tissue. The fibril deposits between cardiomyocytes are marked with blue asterisks. Scale bar: 1 μm. b STEM tomogram. Top: virtual section. The fibril deposit is marked with a blue asterisk. Bottom: rendered tomogram of the fibril deposit. Blue: amyloid fibrils. Red: membranes. Scale bar: 100 nm. c Analysis of the persistence length based on a fit of the plot showing the squared end-to-end distance versus the contour length using Eq. (1). The blue symbols show the measured data points (n = 195) and the red line the fit. d Region of the tomogram, showing the interactions of the fibrils (blue) with the cardiomyocyte membrane (red). Scale bar 100 nm.
Fig. 2
Fig. 2. Cryo-EM structure of the FOR001 AL amyloid fibril.
a Cryo-EM image of FOR001 amyloid fibrils. Scale bar is 100 nm. The dataset consists of 3033 micrographs. b Cross section of the map obtained by summing five central slices. c Side view of the map (left) and molecular model (right), showing the left-handed fibril twist. d Cross section of the map with the molecular model overlaid. The color coding of the model is the same in panels (c) and (d), that is, light blue refers to the N-terminal segment of the ordered fibril protein (residues Ser9–Thr52), while the deep-red segment refers to the C-terminal segment (residues Ser68–Thr108). The two segments are cross-linked through a disulfide between Cys22 and Cys89. The red star in (b) and (d) indicates the glycosylation site at Asn17.
Fig. 3
Fig. 3. Location of the secondary structural elements and mutational sites in the fibril structure.
a Amino acid sequence of the FOR001 fibril protein and secondary structural elements of the FOR001 fibril protein (PDB 7NSL) and of a crystal structure of a natively folded LC (PDB 4ODH 10.2210/pdb4ODH/pdb) containing an IGLV1-51*02 segment. Arrows indicate β-strands in the structure, rainbow-colored from N (blue) to C terminus (red). Dotted lines represent disordered segments. Red star: location of the glycosylation. b Stack of seven protein layers of the fibril, showing the β-strands β1–β11 with the same coloring as in (a). c Schematic representation of the fibril protein fold. Red star: location of the glycosylation.
Fig. 4
Fig. 4. Location of the mutations in known AL amyloid fibrils and natively folded VL domains.
a Location of the mutations in known AL amyloid fibril structures. The fibrils are derived from the GL segments IGLV1-51*02 λ1 (FOR001, this study, PDB 7NSL) IGLV1-44*01 λ1 (FOR006, PDB 6IC3 10.2210/pdb6IC3/pdb), IGLV3-19*01 λ3 (FOR005, PDB 6Z1O 10.2210/pdb6Z1O/pdb), and IGLV6-57*02 λ6 (AL55, PDB 6HUD 10.2210/pdb6HUD/pdb). Disordered parts of the fibril proteins are indicated by dotted lines. Black: CDRs; yellow: Cys. Indigo: mutations in the CDRs and one residue before or after a CDR; magenta: mutations in framework regions; green: residues in the junctional region at the V/J interface. Red star: location of the glycosylation. b Sequence alignment of the four fibril proteins. CDRs are marked with gray boxes. Color coding as in (a). c Location of mutations in the corresponding, natively folded LC VL domains that are based on the GL segments IGLV1-51*01 (PDB 5JZ7 10.2210/pdb5JZ7/pdb), IGLV1-44*01 (PDB 6QB6 10.2210/pdb6QB6/pdb) IGLV3-19*01 (PDB 6Q0E 10.2210/pdb6Q0E/pdb) and IGLV6-57*02 (PDB 7JVA 10.2210/pdb7JVA/pdb) CDRs are marked in black. Color coding as in (a).
Fig. 5
Fig. 5. Effect of glycosylation on the formation of fibrils from FOR001 fibril protein.
a Ribbon representations of a fragment antigen binding that contains a LC with an IGLV1-51*02 GL segment (PDB 4ODH 10.2210/pdb4ODH/pdb). The VL and the CL domain, as well as the variable heavy (VH) and constant heavy (CH) domains are labeled. The LC is marked green, the heavy chain is displayed in gray. Red sphere: residue homologous to the FOR001 glycosylation site. b Crystal structure of a LC dimer encompassing an IGLV1-51*02 GL segment (PDB 5MUD 10.2210/pdb5MUD/pdb). One LC in the dimer is marked green, the other in gray. Red sphere: as in (a). c Fibril-formation kinetics of refolded FOR001 fibril protein as obtained from real-time measurements of the ThT fluorescence intensity. Blue: deglycosylated; red: glycosylated protein. d Coomassie-stained denaturing-protein electrophoresis gels of samples to estimate the proteolytic stability of ex vivo FOR001 fibrils and fibrils formed in vitro from deglycosylated and glycosylated FOR001 protein. Each gel was replicated three times. M: marker. e Densitometric quantification of the fibril protein band (n = 3) of ex vivo fibrils (gray) and in vitro fibrils from deglycosylated (blue) and glycosylated FOR001 protein (red) after digestion with proteinase K for different periods of time. The band intensity of the sample before proteinase K addition was set to 100%. Based on a one-tailed Welch t-test, the amounts of glycosylated and deglycoslated fibril proteins differ from one another with a p-value of 0.032 and 0.049 at time points 0 min and 1 min, respectively. Error bars represent the standard deviation.

References

    1. Blancas-Mejia LM, et al. Immunoglobulin light chain amyloid aggregation. Chem. Commun. 2018;54.76:10664–10674. doi: 10.1039/C8CC04396E. - DOI - PMC - PubMed
    1. Herrera, G. A., Teng, J., Turbat-Herrera, E. A., Zeng, C. & del Pozo-Yauner, L. Understanding Mesangial Pathobiology in AL-amyloidosis and Monoclonal Immunoglobulin Light Chain Deposition Disease. Kidney Int. Rep. (2020). - PMC - PubMed
    1. Wechalekar AD, et al. A European collaborative study of treatment outcomes in 346 patients with cardiac stage III AL amyloidosis. Blood. 2013;121:3420–3427. doi: 10.1182/blood-2012-12-473066. - DOI - PubMed
    1. Merlini G, et al. Systemic immunoglobulin light chain amyloidosis. Nat. Rev. Dis. Prim. 2018;4:1–19. - PubMed
    1. Janeway C. A. Jr., Travers, P., Walport, M. & Shlomchik, M. J. Immunobiology: the Immune System in Health and Disease. 5th edn (Garland Science, 2001). The generation of diversity in immunoglobulins.

Publication types

MeSH terms