. 2022 Mar;36(3):687-700.
doi: 10.1038/s41375-021-01461-5. Epub 2021 Nov 5.

The tumor suppressor MIR139 is silenced by POLR2M to promote AML oncogenesis

Affiliations

The tumor suppressor MIR139 is silenced by POLR2M to promote AML oncogenesis

Christiaan J Stavast et al. Leukemia. 2022 Mar.

Abstract

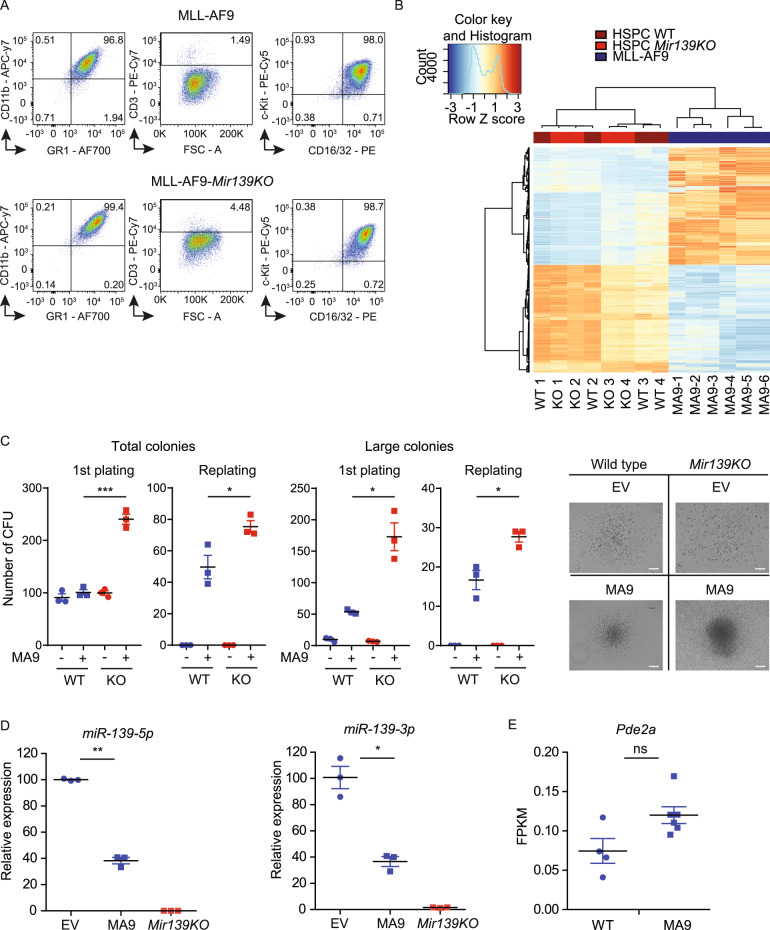
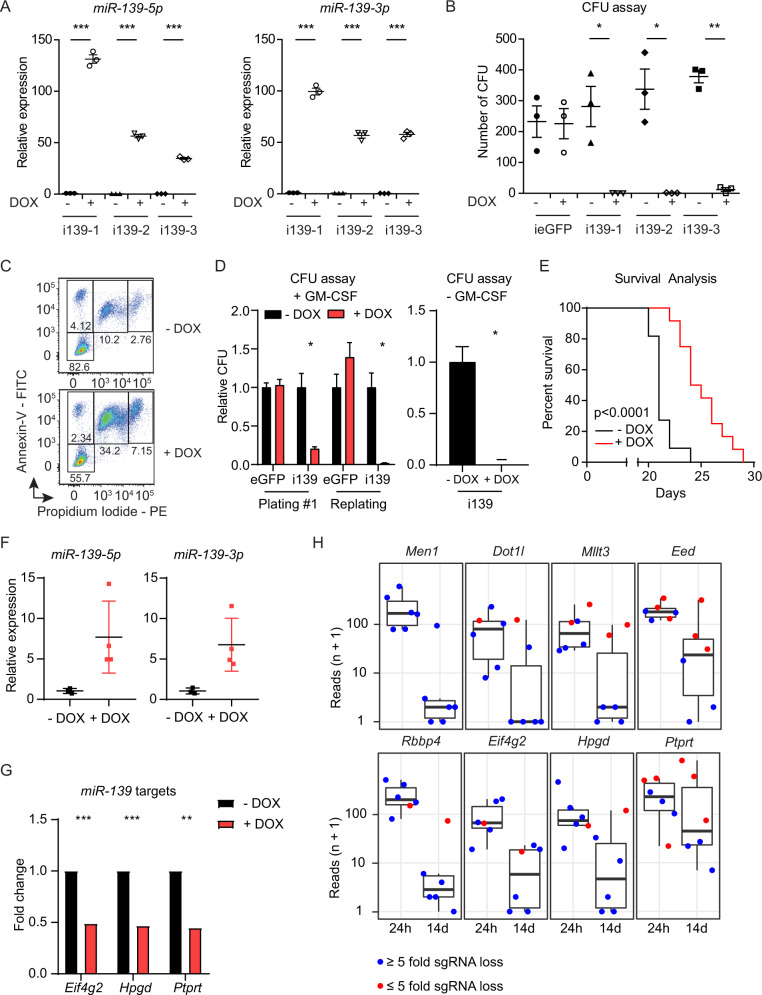
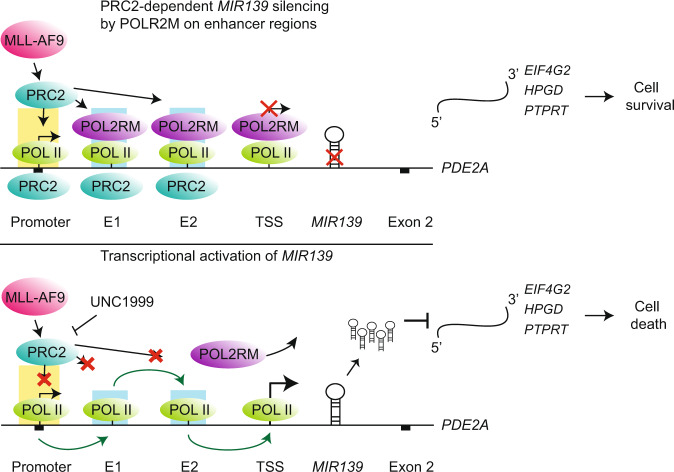
MIR139 is a tumor suppressor and is commonly silenced in acute myeloid leukemia (AML). However, the tumor-suppressing activities of miR-139 and molecular mechanisms of MIR139-silencing remain largely unknown. Here, we studied the poorly prognostic MLL-AF9 fusion protein-expressing AML. We show that MLL-AF9 expression in hematopoietic precursors caused epigenetic silencing of MIR139, whereas overexpression of MIR139 inhibited in vitro and in vivo AML outgrowth. We identified novel miR-139 targets that mediate the tumor-suppressing activities of miR-139 in MLL-AF9 AML. We revealed that two enhancer regions control MIR139 expression and found that the polycomb repressive complex 2 (PRC2) downstream of MLL-AF9 epigenetically silenced MIR139 in AML. Finally, a genome-wide CRISPR-Cas9 knockout screen revealed RNA Polymerase 2 Subunit M (POLR2M) as a novel MIR139-regulatory factor. Our findings elucidate the molecular control of tumor suppressor MIR139 and reveal a role for POLR2M in the MIR139-silencing mechanism, downstream of MLL-AF9 and PRC2 in AML. In addition, we confirmed these findings in human AML cell lines with different oncogenic aberrations, suggesting that this is a more common oncogenic mechanism in AML. Our results may pave the way for new targeted therapy in AML.


Conflict of interest statement

The authors declare no competing interests.

Figures

Fig. 1
Fig. 1. MLL-AF9 downregulates Mir139 expression.
A Flow cytometric analysis of surface marker expression of MLL-AF9 or MLL-AF9-Mir139KO cells stained for myeloid lineage markers CD11b, CD16/32, c-Kit, GR-1 and lymphoid lineage marker CD3. B Heatmap showing the differential gene expression profiles of WT HSPCs (WT), Mir139KO HSPCs (KO), and MLL-AF9 cells (MA9). C The number of colony-forming units (CFUs) per 5000 empty vector control (−) and MLL-AF9 (MA9) transduced WT and Mir139KO HSPCs are shown. Total number of colonies (50–250 cells/colony) and large colonies (>250 cells/colony) are presented. Micrographs depict representative colonies. Scale bar indicates 100 µm. The two-tailed unpaired student’s t test was used for the statistical analysis. D Expression of miR-139-5p and miR-139-3p in MA9 cells and MLL-AF9-Mir139KO relative to snRNA U6 and EV transduced HSPCs (EV) as determined by miRNA qPCR is shown. The two-tailed unpaired student’s t test with Welch’s correction was used for the statistical analysis. The presented data are representative of two experiments. E Expression of Pde2a in MA9 cells and WT HSPCs in fragments per kilobase and per million mapped fragments (FPKM) as determined by RNA-seq is shown. The Wald’s test with Benjamin–Hochberg correction was used for the statistical analysis. All graphs show mean ± SEM.
Fig. 2
Fig. 2. MiR-139 upregulation and repression of miR-139 targets eliminates MLL-AF9 AML in vitro and inhibits leukemogenesis in mice.
A Expression levels of miR-139-5p and miR-139-3p in MLL-AF9-i139 clones (n = 3), treated with DOX (5 µg/mL, +) relative to snRNA U6 and mock-treated (−) cells, as determined by miRNA qPCR in triplicate, are shown. The two-tailed unpaired student’s t test was used for the statistical analysis. B The number of colony-forming units (CFU) of MLL-AF9-ieGFP and MLL-AF9-i139 (n = 3) HSPC clones treated with doxycycline (DOX; 5 µg/mL, (+) or mock-treated (−) as control per 8000 cells plated are shown. Data represent the average of three independent experiments. The two-tailed paired student’s t test was used for the statistical analysis. C Representative flow cytometry plot of MLL-AF9-i139 cells with or without DOX stained with propidium iodide and Annexin-V. Data are representative of three independent clones. D Relative number of colony-forming units (CFU) of MLL-AF9-ieGFP and MLL-AF9-i139-1 cells in triplicate, treated with Doxycycline (DOX; 5 µg/mL, (+)) or mock-treated (−) as control per 8000 cells plated are shown of the first plating and the subsequent replating. The cells were cultured with IL-3, IL-6, GM-CSF, and SCF (left panel) or with IL-3, IL-6, and SCF (right panel). The two-tailed paired student’s t test was used for the statistical analysis. E Kaplan–Meier plot showing the survival of mice, transplanted with MLL-AF9-GFP-TetR-KRAB-i139 LSK cells and treated with DOX (4 mg/kg) (red, n = 11) or mock-treated (black, n = 11). The Mantel–Cox test was used for the statistical analysis. F Expression levels of miR-139-5p and miR-139-3p in leukemia cells from mice treated with DOX (n = 4) in E relative to mock-treated and snRNA U6 are shown. Tissues were analyzed from mice when moribund. G Fold change of Eif4g2 (Padj: 0.0002), Hpgd (Padj: 0.0006), and Ptprt (Padj: 0.005) expression in DOX-treated (+DOX) MLL-AF9-i139 clones (n = 3) relative to mock-treated (−DOX) clones (n = 3) as determined by RNA-seq is shown. The Wald’s test with Benjamini–Hochberg correction was used for the statistical analysis. H Boxplots showing the reads (n + 1) of the total six sgRNAs targeting Men1, Dot1l, Mllt3, Eed, Rbbp4, Eif4g2, Hpgd, and Ptprt in MLL-AF9 cells 24 h or 14 days post transduction. Per gene, the order of the sgRNAs in the 24 h sample corresponds to the same sgRNAs in the 14d sample. Blue circles indicate a loss of >5 fold, while red circles indicate a loss of <5 fold of the sgRNA. All graphs depict mean ± SEM.
Fig. 3
Fig. 3. Mir139 is epigenetically silenced by PRC2 in MLL-AF9 cells.
A ChIP-seq reads of the Pde2a locus (chr7:108,596,060–108,645,660) are depicted. The top two tracks show H3K4me3 (red) and H3K27Ac (orange) enrichment in common myeloid progenitors (CMPs). The next track indicates RNA Polymerase II (POL-II) binding (purple) of MLL-AF9 cells. The next three tracks depict H3K27me3 (blue), H3K27Ac and SUZ12 (green) enrichment in MLL-AF9 cells treated with UNC2400 (inactive PRC2 inhibitor). The bottom three tracks show the same data of MLL-AF9 cells treated with UNC1999 (active PRC2 inhibitor). Scale bar indicates 5 kilobases (kb). Black bars indicate exons. B The methylation status of CpGs in the PDE2A promoter region, enhancer region 1 (E1) and E2 of THP-1 and Molm-13 cells is depicted. Closed blue circles indicate methylated CpG, open blue circles indicate unmethylated CpG. C Schematic overview of the Pde2a locus (chr7:108,596,060–108,645,660). Fold enrichment of H3K27me3 (orange) and control IgG (white) antibody binding to the indicated regions in MLL-AF9 cells treated with depicted concentrations of UNC1999 as determined by ChIP-qPCR is shown. Arrows indicate the primer sets. The scale bar indicates 2.5 kb. D Viability of WT or Mir139KO MLL-AF9 cells treated with UNC1999 relative to mock-treated WT or Mir139KO MLL-AF9 cells is shown. Data are representative of three experiments. E Expression levels of miR-139-3p and miR-139-5p in MLL-AF9 cells treated with UNC1999 relative to snRNA U6 and untreated MLL-AF9 cells are shown. Data are representative of three experiments. F Viability of Molm-13 cells treated with UNC1999 relative to mock-treated Molm-13 cells, is shown. Depicted data are representative of three experiments. G Expression levels of miR-139-3p and miR-139-5p in Molm-13 cells treated with UNC1999 relative to snRNA U6 and untreated Molm-13 cells are shown. Depicted data are representative of three experiments. H Viability of UNC1999-treated primary MLL-AF9 patient samples (n = 3) relative to untreated cells is shown. I Expression levels of miR-139-5p and miR-139-3p in primary MLL-AF9 patient samples (n = 3) treated with UNC1999 relative to snRNA U6 and untreated cells are shown. All graphs show mean ± SEM. The two-tailed unpaired student’s t test was used in CE and G. The two-tailed paired student’s t test was used in F, H and I.
Fig. 4
Fig. 4. E1 and E2 are both critical for the transcriptional regulation of Mir139.
A Schematic representation of CRISPR-Cas9 KO strategy to generate PKO, E1KO, and E2KO mice. Red arrows indicate sgRNAs targeting the promoter region and exon-1 of Pde2a. Green arrows indicate sgRNAs targeting E1 and E2. The first three exons of Pde2a (black bars) are indicated with numbers 1, 2, and 3. The Mir139 encoding sequence is depicted in red. The scale bar indicates 2.5 kb. B Expression levels of miR-139-3p and miR-139-5p in Enhancer 1 KO (E1KO) and E2KO HSPCs relative to snRNA U6 and WT HSPCs are shown C. Expression of Pde2a relative to Gapdh and to WT HSPCs, in E1KO and E2KO HSPCs isolated from three mice per condition is shown. D Flow cytometric analysis of surface marker expression of MLL-AF9-E1KO and MLL-AF9-E2KO cells stained for myeloid lineage markers CD11b, CD16/32, c-Kit, GR-1, and lymphoid lineage marker CD3. E Viability of MLL-AF9 WT, E1KO, and E2KO MLL-AF9 cells treated with indicated concentrations of UNC1999 relative to the mock-treated condition cells is shown. The ANOVA analysis with Bonferroni correction was used for statistical analysis. *In top of graph: comparisons of E1KO and E2KO with WT. Presented data are representative of three independent experiments. F Expression levels of miR-139-3p and miR-139-5p in WT, E1KO, and E2KO MLL-AF9 cells treated with indicated concentrations of UNC1999 relative to snRNA U6 and mock-treated cells are shown. Depicted data are representative of three experiments. G Expression of Pde2a in WT, E1KO, and E2KO MLL-AF9 cells, treated with indicated concentrations of UNC1999 relative to Gapdh and mock-treated cells is shown. Depicted data are representative of three experiments. The two-tailed unpaired student’s t test with Welch’s correction was used for statistical analysis in BF and G. All graphs indicate mean ± SEM.
Fig. 5
Fig. 5. POLR2M silences Mir139 in MLL-AF9 cells.
A Schematic overview of the sgRNA library screen with MLL-AF9 WT (MA9 WT) and MLL-AF9 Mir139KO (MA9 Mir139KO) cells. B Volcano plot showing –log10 P value (Y axis) and average log2 fold change (X axis) of all targeted genes in MLL-AF9 WT relative to MLL-AF9-Mir139KO 14 days post transduction. The red closed circle indicates Polr2m. Red dashed lines indicate a fold change of ±10. Top 10 of enriched genes are shown. C Boxplots showing the reads (n + 1) of six sgRNAs targeting Polr2m in MA9 WT and MA9 Mir139KO cells. The order of the sgRNAs in the MA9 Mir139KO sample corresponds to the same sgRNAs in the MA9 WT sample. Blue circles indicate a loss of ≥10 fold per sgRNA, while red circles indicate a loss of ≤10 fold of the sgRNA. D MLL-AF9 cells and MLL-AF9 Mir139KO cells were transduced with three viruses expressing sgRNAs targeting Polr2m or three viruses expressing control sgRNAs. The left panel shows the colony-forming units (CFU) of Polr2m-targeted MLL-AF9 cells relative to MLL-AF9 Mir139KO cells. The right panel shows the viability of Polr2m-targeted MLL-AF9 cells relative to MLL-AF9 Mir139KO cells (Y axis). The two-tailed unpaired student’s t test with Welch’s correction was used for statistical analysis. The graphs are representative of three independent experiments. E Viability of POLR2M-targeted Molm-13 cells (left panel) or primary MLL-AF9 patient samples (right panel) relative to control targeted cells. The two-tailed paired student’s t test was used for the statistical analysis. Data are representative of two/three experiments. F Expression levels of pri-miR-139 in POLR2M-targeted Molm-13 cells (left panel) or primary MLL-AF9 patient samples (right panel) relative to control targeted cells. The two-tailed unpaired student’s t test with Welch’s correction was used for statistical analysis. The graphs are representative of two/three independent experiments. G Expression levels of pri-miR-139 in POLR2M-targeted U937, MV4-11, TF-1, or HL-60 cells relative to control targeted cells (left panel). Viability of POLR2M-targeted U937, MV4-11, TF-1, or HL-60 cells relative to control targeted cells (right panel). The two-tailed unpaired student’s t test with Welch’s correction was used for statistical analysis. The graphs are representative of two independent experiments. All graphs are depicted as mean ± SEM.
Fig. 6
Fig. 6. POLR2M binds to E1, E2, and the TSS.
A Schematic representation of the PDE2A locus (chr11:72,605,000–72,644,500) with the indicated promoter (P, yellow) and enhancer (E1 or E2, blue) regions and transcriptional start sites (arrows). The first two exons of PDE2A are depicted with a black horizontal bar. The MIR139 encoding sequence is depicted in red. The location of the primer sets with the respective numbers used for the experiments in this figure is depicted in gray. B, C Fold enrichment of POL-II (yellow) and POLR2M (orange) on the depicted loci relative to IgG (white) as determined by ChIP-qPCR in Molm-13 cells are shown. Data are representative of three experiments. D Same as B and C, except that Molm-13 cells were treated with indicated concentrations of UNC1999 (different shades of orange). Data are representative of two independent experiments. E Schematic overview of the MIR139 locus. The primer sets to detect transcripts coming from E1 (green), E2 (red), and TSS (blue) are shown. The relative expression of transcripts in UNC1999-treated Molm-13-treated cells is shown below. The two-tailed unpaired student’s t test with Welch’s correction was used for statistical analysis in BE. Data are representative of three experiments. All graphs are depicted as mean ± SEM.
Fig. 7
Fig. 7. Schematic illustration of the model.
In the top panel, the MIR139 silencing mechanism in MLL-AF9 AML is shown. MLL-AF9 recruits PRC2 to the promoter, E1, E2, and the TSS of the PDE2A locus. POLR2M is recruited to E1, E2, and the TSS. POLR2M silences the transcription of MIR139, while the transcription of the host gene is unaffected. In the bottom panel, the mechanism of transcriptional activation by PRC2 inhibition and POLR2M depletion is shown. POLR2M depletion and PRC2 inhibition by UNC1999, which abrogates POLR2M interaction with the enhancers, results in transcription of MIR139. Increased miR-139 levels results in downregulation of EIF4G2, PTPRT, and HPGD and lead to cell death of MLL-AF9 cells.

References

    1. Muntean AG, Hess JL. The pathogenesis of mixed-lineage leukemia. Annu Rev Pathol. 2012;7:283–301. - PMC - PubMed
    1. Balgobind BV, Raimondi SC, Harbott J, Zimmermann M, Alonzo TA, Auvrignon A, et al. Novel prognostic subgroups in childhood 11q23/MLL-rearranged acute myeloid leukemia: results of an international retrospective study. Blood. 2009;114:2489–96. - PMC - PubMed
    1. Winters AC, Bernt KM. MLL-rearranged leukemias-an update on science and clinical approaches. Front Pediatr. 2017;5:4. - PMC - PubMed
    1. Steinhilber D, Marschalek R. How to effectively treat acute leukemia patients bearing MLL-rearrangements? Biochem Pharm. 2018;147:183–90. - PubMed
    1. Kotani S, Yoda A, Kon A, Kataoka K, Ochi Y, Shiozawa Y, et al. Molecular pathogenesis of disease progression in MLL-rearranged AML. Leukemia. 2019;33:612–24. - PMC - PubMed

Publication types