. 2021 Nov;53(11):1543-1552.
doi: 10.1038/s41588-021-00950-8. Epub 2021 Nov 5.

Genome-wide analysis of 53,400 people with irritable bowel syndrome highlights shared genetic pathways with mood and anxiety disorders

Collaborators, Affiliations

Genome-wide analysis of 53,400 people with irritable bowel syndrome highlights shared genetic pathways with mood and anxiety disorders

Chris Eijsbouts et al. Nat Genet. 2021 Nov.

Abstract

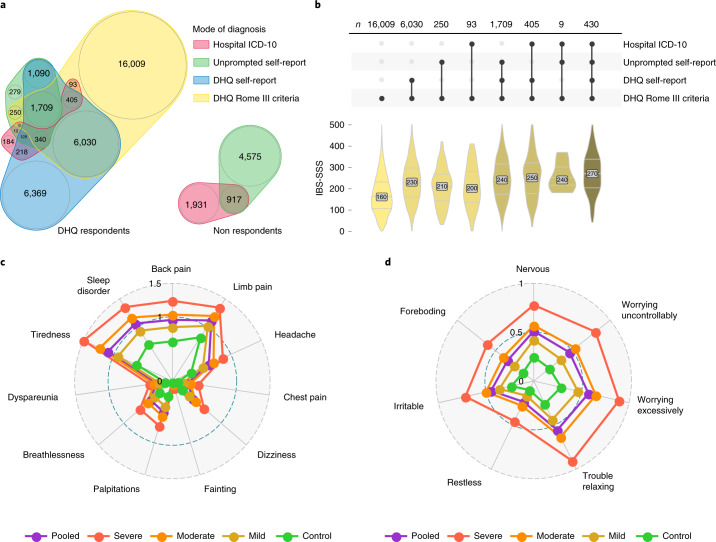
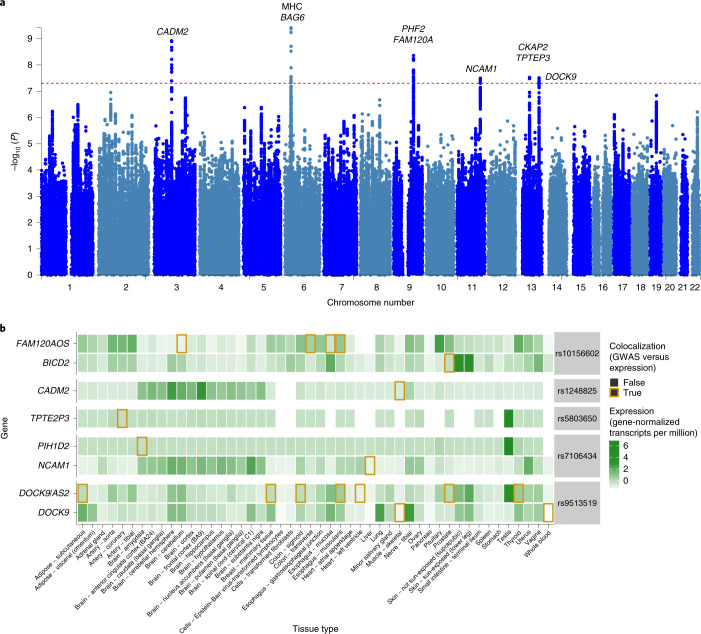
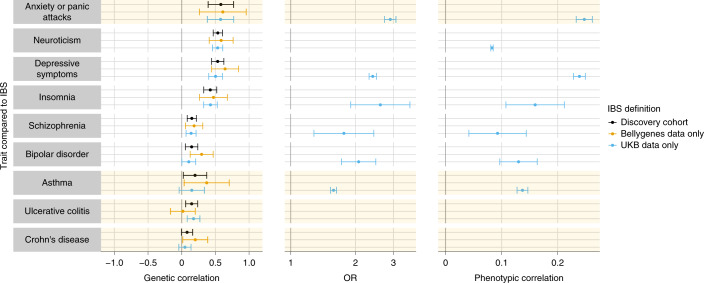
Irritable bowel syndrome (IBS) results from disordered brain-gut interactions. Identifying susceptibility genes could highlight the underlying pathophysiological mechanisms. We designed a digestive health questionnaire for UK Biobank and combined identified cases with IBS with independent cohorts. We conducted a genome-wide association study with 53,400 cases and 433,201 controls and replicated significant associations in a 23andMe panel (205,252 cases and 1,384,055 controls). Our study identified and confirmed six genetic susceptibility loci for IBS. Implicated genes included NCAM1, CADM2, PHF2/FAM120A, DOCK9, CKAP2/TPTE2P3 and BAG6. The first four are associated with mood and anxiety disorders, expressed in the nervous system, or both. Mirroring this, we also found strong genome-wide correlation between the risk of IBS and anxiety, neuroticism and depression (rg > 0.5). Additional analyses suggested this arises due to shared pathogenic pathways rather than, for example, anxiety causing abdominal symptoms. Implicated mechanisms require further exploration to help understand the altered brain-gut interactions underlying IBS.


Conflict of interest statement

C.A.A. and L.J. are paid consultants for Genomics. C.A.A. is a paid consultant for Celgene. J.S. and S.S. are employed by and hold stock or stock options in 23andMe. Members of the 23andMe research team are employed by and hold stock or stock options in 23andMe. P.J.W. has acted as a consultant or received research funding from Danone, Allergan, Ironwood Pharmaceuticals and Salix Pharmaceuticals, all outside of the submitted work. R.S. has accepted research grants from Sanofi and Zespri International and speaker fees from Alfawasserman. G.M. is a director of and shareholder in Genomics and partner in Peptide Groove LLP. The other authors declare no competing interests.

Figures

Fig. 1
Fig. 1. Diagnostic modalities and comorbidities of IBS.
a, Venn diagram of overlap between UKB IBS cases by different diagnostic modality, split by DHQ respondents and nonrespondents. The areas and numbers indicate the sample size. Most participants with current symptoms (DHQ Rome III, yellow) did not report being diagnosed with IBS either when listing medical conditions unprompted at UKB enrollment (unprompted self-report, green) or when asked specifically about a previous IBS diagnosis when completing the DHQ (DHQ self-report, blue). Conversely, many participants previously diagnosed with IBS, even those formally recorded during a hospital admission (hospital ICD-10, red), did not have symptoms sufficient for Rome III criteria IBS diagnosis at the time of their DHQ response. b, Among individuals experiencing IBS symptoms (DHQ Rome III positive), those previously diagnosed by a clinician had greater symptom severity, with an increase in the number of IBS diagnostic modalities (connected dots, middle; top: sample size is shown) being associated with an increase in symptom severity score (IBS-SSS, bottom). Distributions are colored by the number of diagnoses and the groups shown are mutually exclusive. For post-hoc statistics, see Supplementary Table 3. c, Severity of different somatic symptoms in the past three months among digestively healthy controls and IBS cases (classified as mild, moderate and severe based on IBS-SSS). Mean scores for PHQ-12 items ranked from 0 (not bothered at all) to 2 (bothered a lot) are shown. Pooled refers to all UKB cases in the discovery cohort. d, As above, for symptoms of anxiety in the last two weeks, measured using average scores for GAD-7 items ranked from 0 (never bothered) to 3 (bothered nearly every day).
Fig. 2
Fig. 2. Genome-wide association results for IBS.
a, Manhattan plot showing the distribution of IBS-associated SNPs across the genome. The dashed line indicates the genome-wide significance threshold at P = 5 × 10−8. P values are from a two-sided test, after inverse variance-weighted fixed-effects meta-analysis. See Supplementary Fig. 5 for zoomed-in visualizations with linkage disequilibrium data, posterior probabilities of causality and transcript annotations. b, Expression of genes implicated in IBS etiology through causal effects of associated variants on gene expression across a range of tissues. Darker green indicates higher gene expression and the golden outlines indicate tissue–gene combinations where the IBS-associated variant was known to influence gene expression in this tissue (colocalization posterior > 0.5). Genes with at least one colocalization event across tissues with expression quantitative trait locus data from the GTEx dataset are shown.
Fig. 3
Fig. 3. Genetic and phenotypic correlations between IBS and other traits.
Correlations of genetic risk (coheritability estimates, left) and phenotype (ORs, middle, and liability-scale correlation, right) between IBS and other traits. The subset of all LD Hub traits (excluding rapid GWAS results) with significant genetic correlation (two-tailed coheritability test as implemented in the LDSC with unadjusted P < 0.05) in both UKB data (light blue, 40,548 cases and 293,220 controls) and the independent Bellygenes cohort (orange, 12,852 cases and 139,981 controls) is shown, as well as the meta-analysis used for discovery (black, 53,400 cases and 433,201 controls). IBS had a similar genetic risk profile to traits such as neuroticism, depression and insomnia (for which P values were significant in all datasets after multiple testing correction for the number of traits tested). Traits highlighted in yellow were added manually given their clinical relevance. Anxiety was not initially included since it is only available in the LD Hub as a rapid GWAS result. Among UKB participants, we present ORs (middle) and phenotypic correlations values (right) for these traits. Sample sizes (restricted to UKB participants who were either cases or controls in the discovery cohort; n = 333,768) were as follows: anxiety or panic attacks, 8,714; neuroticism, 271,423 (scores); depressive symptoms, 24,311; insomnia, 326; schizophrenia, 574; bipolar disorder, 1,207; asthma, 41,178.

Comment in

References

    1. Ford AC. Commentary: estimating the prevalence of IBS globally––past, present and future. Aliment. Pharmacol. Ther. 2020;51:198–199. - PubMed
    1. Gralnek IM, Hays RD, Kilbourne A, Naliboff B, Mayer EA. The impact of irritable bowel syndrome on health-related quality of life. Gastroenterology. 2000;119:654–660. - PubMed
    1. Soubieres A, Wilson P, Poullis A, Wilkins J, Rance M. Burden of irritable bowel syndrome in an increasingly cost-aware National Health Service. Frontline Gastroenterol. 2015;6:246–251. - PMC - PubMed
    1. Hillilä MT, Färkkilä NJ, Färkkilä MA. Societal costs for irritable bowel syndrome—a population based study. Scand. J. Gastroenterol. 2010;45:582–591. - PubMed
    1. Longstreth GF, et al. Functional bowel disorders. Gastroenterology. 2006;130:1480–1491. - PubMed

Publication types

MeSH terms