. 2022 Jan 19;110(2):280-296.e10.
doi: 10.1016/j.neuron.2021.10.024. Epub 2021 Nov 5.

Neocortex saves energy by reducing coding precision during food scarcity

Affiliations

Neocortex saves energy by reducing coding precision during food scarcity

Zahid Padamsey et al. Neuron. .

Abstract

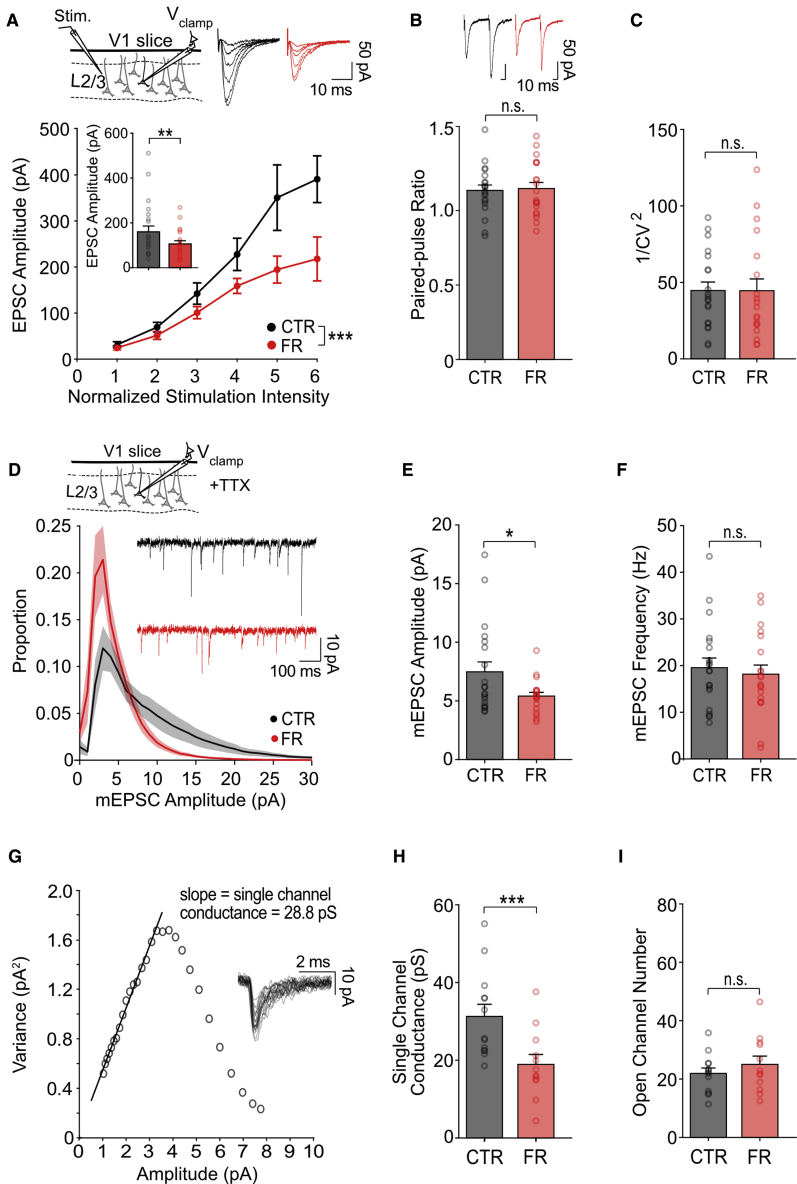
Information processing is energetically expensive. In the mammalian brain, it is unclear how information coding and energy use are regulated during food scarcity. Using whole-cell recordings and two-photon imaging in layer 2/3 mouse visual cortex, we found that food restriction reduced AMPA receptor conductance, reducing synaptic ATP use by 29%. Neuronal excitability was nonetheless preserved by a compensatory increase in input resistance and a depolarized resting potential. Consequently, neurons spiked at similar rates as controls but spent less ATP on underlying excitatory currents. This energy-saving strategy had a cost because it amplified the variability of visually-evoked subthreshold responses, leading to a 32% broadening of orientation tuning and impaired fine visual discrimination. This reduction in coding precision was associated with reduced levels of the fat mass-regulated hormone leptin and was restored by exogenous leptin supplementation. Our findings reveal that metabolic state dynamically regulates the energy spent on coding precision in neocortex.

Keywords: calorie restriction; hunger and satiety; in vivo ATP imaging; in vivo calcium imaging; in vivo electrophysiology; leptin; mouse primary visual cortex; orientation tuning; spike rate homeostasis; trial-to-trial variability.


Conflict of interest statement

Declaration of interests The authors declare no competing interests

Figures

None
Graphical abstract
Figure 1
Figure 1
Food restriction results in reduced excitatory synaptic currents and ATP use but preserved spike rate in awake mice (A) Experimental timeline and animal weight. (B) Schemata of experimental design and visual stimulation. (C) Sample excitatory current traces recorded in voltage-clamp of a layer 2/3 neuron during presentation of natural scenes. (D) Mean excitatory current, calculated as the rate of excitatory charge transfer (t test; n = 35 control and n = 29 food-restricted cells). (E) Mean ATP consumption rate for excitatory currents (t test; n = 35 control and n = 29 food-restricted cells). (F) Sample traces recorded in current clamp of a layer 2/3 neuron during presentation of natural scenes. Top right: mean action potential trace from recordings; shaded region denotes the standard error of the mean (n = 40 control and n = 37 food-restricted cells). (G) Mean spike rate (p = 0.98, t test; n = 40 control and n = 37 food-restricted cells). (H) Mean ATP consumption rate for spiking (p = 0.78, t test; n = 40 control and n = 37 food-restricted cells). (I) Top: sample field of view of V1 layer 2/3 neurons in the ATeam1.03YEMK transgenic mouse (scale bar: 10 μm). Bottom: experimental schematic. ATP synthesis inhibitors were used to isolate ATP use, recorded as a decrease in FRET signal. (J) Normalized ATeam1.03YEMK FRET signal during presentation of natural scenes. ATP consumption was evaluated by imaging the FRET signal after adding ATP synthesis inhibitors (arrow) (two-way repeated-measures ANOVA, control group versus food-restricted group; n = 10 CTR and n = 9 food-restricted animals). (K) Mean FRET decay rate (t test; n = 10 control and n = 9 food-restricted animals). p < 0.05. Error bars are S.E.M. See also Figures S1 and S3.
Figure 2
Figure 2
Reduced AMPAR currents are mediated by a reduction in single-channel AMPAR conductance in food-restricted mice (A) Top left: schema of voltage-clamp recordings of layer 2/3 neurons in V1 slices. A stimulation electrode was placed in layer 2/3. Top right: sample traces of excitatory currents (−70 mV) evoked by stimulation at varying intensities. Bottom: mean excitatory postsynaptic current (EPSC) amplitude evoked by stimulation (two-way repeated-measures ANOVA, control group versus food-restricted group; n = 22 control and n = 20 food-restricted cells). Inset: mean EPSC amplitude evoked by half-maximal stimulation (t test; n = 22 CTR and n = 20 food-restricted cells). (B) Top: sample EPSC traces in response to paired-pulse stimulation. Bottom: mean paired-pulse ratio (p = 0.93, t test; n = 22 control and n = 20 food-restricted cells). (C) Mean 1/CV2 (p = 0.65, t test; n = 22 control and n = 20 food-restricted cells). (D) Top: schema of miniature EPSCs (mEPSCs) recordings in the presence of TTX. Bottom: sample traces recorded at −70 mV and mean distribution of mEPSC amplitudes (n = 20 control and n = 20 food-restricted cells). (E) Mean mEPSC amplitude (t test; n = 20 control and n = 20 food-restricted cells). (F) Mean mEPSC frequency (p = 0.63, t test; n = 20 control and n = 20 food-restricted cells). (G) Example of mean-variance analysis of mEPSCs (gray traces) recorded in one cell. Single-channel conductance was estimated from the initial slope. (H) Mean single-channel conductance (t test; n = 13 control and n = 12 food-restricted cells). (I) Mean open channel number (p = 0.36, t test; n = 13 control and n = 12 food-restricted cells). p < 0.05, ∗∗p < 0.01, and ∗∗∗p < 0.001. Error bars are S.E.M.
Figure 3
Figure 3
Reduced AMPAR currents are compensated by an increased input resistance and a depolarized resting membrane potential in food-restricted mice (A) Schema of current-clamp recording of layer 2/3 neurons in awake mice and sample traces (VThreshold, spike threshold; VRest, resting membrane potential). (B) Mean input resistance (t test; n = 40 control and n = 37 food-restricted cells). (C) Mean subthreshold depolarization, calculated as the integrated subthreshold membrane potential per second (t test; n = 40 control and n = 37 food-restricted cells). (D) Mean distance to spike (spike threshold − resting membrane potential) (t test; n = 32 control and n = 26 food-restricted cells that spiked). (E) Normalized subthreshold depolarization (mean subthreshold depolarization/distance to spike) (p = 0.8, t test; n = 32 control and n = 26 food-restricted cells that spiked). (F) Mean resting membrane potential (t test; n = 40 control and n = 37 food-restricted cells). (G) Mean spike threshold (p = 0.41, t test; n = 32 control and n = 25 food-restricted cells that spiked). (H) Left: schema of integrate-and-fire model (gAMPAR, synaptic conductance; R, input resistance). Right: sample simulated traces. food-restricted model has 70% of the gAMPAR of control, as found with experimental recording. Spiking activity is restored following compensatory increases in input resistance (R) and depolarization of the resting membrane potential (Vrest) (food-restricted uncompensated model versus food-restricted compensated model). (I) gAMPAR conductance used in the model. (J) Normalized depolarization triggered by gAMPAR input as shown in (I), for food-restricted uncompensated versus control. (K) Normalized depolarization triggered by gAMPAR input as shown in (I) for food-restricted compensated versus control. p < 0.05 and ∗∗p < 0.01. Error bars are S.E.M. See also Figure S3.
Figure 4
Figure 4
Increased subthreshold variability contributes to broadened orientation tuning in food-restricted mice (A) Sample current-clamp recordings of layer 2/3 neurons in awake mice during presentation of drifting gratings. (B) Mean orientation tuning curve for spike output normalized to the response to the preferred orientation. Note that -90o and +90o conditions correspond to the same visual stimulus (two-way repeated-measures ANOVA, control group versus food-restricted group: p < 0.001; post hoc Sidak’s tests; n = 33 control and n = 28 food-restricted cells). (C) Average orientation tuning width of spike output (t test). (D) Mean subthreshold response across orientations (t test). (E) Mean orientation tuning curve for subthreshold depolarization normalized by the distance to spike (VThreshold, spike threshold) (two-way repeated-measures ANOVA, control group versus food-restricted group: p = 0.33). (F) Average orientation tuning width for subthreshold depolarization (p = 0.82, t test). (G) Probability of detecting at least one spike as a function of the subthreshold depolarization, normalized to the distance to spike threshold (two-way repeated-measures ANOVA, control group versus food-restricted group: p < 0.05; post hoc Sidak’s tests). (H) Average spike frequency as a function of subthreshold depolarization, normalized to the distance to spike threshold (two-way repeated-measures ANOVA, control group versus food-restricted group: p < 0.05; post hoc Sidak’s tests). (I) Mean firing rate, averaged across orientations (p = 0.15, t test). (J) Sample traces depicting trial-to-trial variability (faded traces) and mean (bold traces) of stimulus-evoked depolarizations. Traces were recorded with no holding current (Rest) or hyperpolarized by 50–100 pA to prevent spiking (Hyp.). (K) Mean coefficient of subthreshold trial-to-trial variability (CV; SD/mean) (two-way ANOVA, Rest versus Hyp.: p < 0.03; post hoc Sidak’s tests; control Rest versus food-restricted Rest, p < 0.01; n = 28 control and n = 24 food-restricted cells; control Hyp. versus food-restricted Hyp., p = 0.69; n = 22 control and n = 16 food-restricted cells; lines connect measures from the same cell). (L) Top: schematic of model used to calculate the probability that membrane potential would cross spike threshold for a given orientation depending on (1) the distance to spike threshold and (2) the trial-to-trial variability (shaded region). For comparison, the schema depicts relative membrane potential and trial-to-trial variability, both normalized to the distance to spike threshold for the control and food-restrcited model. Bottom: probability of spiking calculated for each orientation, normalized to the value at the preferred stimulus. The model recapitulates the experimentally obtained orientation tuning curve of spike rate shown in (B). p < 0.05 and ∗∗p < 0.01. n = 33 control and n = 28 food-restricted cells unless otherwise specified. Error bars are S.E.M. See also Figure S4.
Figure 5
Figure 5
Increased input resistance and depolarization of the resting membrane potential amplifies subthreshold variability, leading to broadened orientation tuning (A) Hodgkin-Huxley type model neuron with resistance R, resting membrane potential VRest, and spike threshold VThreshold. The model received orientation-tuned synaptic input (gAMPAR), concurrent with input from a variable conductance source (mediated by non-AMPARs), which was the only source of trial-to-trial variability. (B) Sample simulated membrane potential traces in response to constant gAMPAR input; action potentials are clipped for clarity. The magnitude of gAMPAR was set so that all models achieved the same normalized level of mean depolarization. (C) Relative trial-to-trial subthreshold variability, measured as the coefficient of variation (CV), normalized to control. (D) Probability of detecting at least one spike as a function of gAMPAR input; gAMPAR is expressed as a fraction of the maximum control value. R and VRest models are overlapping. (E) gAMPAR input across orientations; gAMPAR is expressed as a fraction of the maximum control value. All models are overlapping. (F) Orientation tuning curve for spike probability, normalized to the value at the preferred orientation. R and VRest models are overlapping. (G) Hodgkin-Huxley type model neuron. As in (A), but the variable conductance source is replaced with a stochastic voltage-gated channel to generate subthreshold variability. (H) Sample simulated membrane potential traces showing trial-to-trial variability in response to constant gAMPAR input; action potentials are clipped for clarity. The magnitude of gAMPAR was set so that all models achieved the same normalized level of mean depolarization. (I) Relative trial-to-trial subthreshold variability, measured as the coefficient of variation (CV), normalized to control. (J) Probability of detecting at least one spike as a function of gAMPAR input; gAMPAR input is expressed as a fraction of the maximum control value. (K) gAMPAR input across orientations; gAMPAR is expressed as a fraction of the maximum control value. All models are overlapping. (L) Orientation tuning curve for spike probability (normalized to preferred orientation). See also Supplemental Table S1 and S2.
Figure 6
Figure 6
Food restriction results in a decrease in cortical coding precision and impaired fine visual discrimination (A) Top: example field of view of GCaMP6s-labeled layer 2/3 neurons (scale bar: 10 μm). Bottom: sample fluorescent traces of a neuron (indicated by the broken circle in the above panel) during presentation of six drifting gratings. Individual trials in gray; average trace in black. (B) Mean orientation tuning normalized to the response to the preferred orientation. Note that -90o and +90o conditions correspond to the same visual stimulus (three-way ANOVA run for the whole dataset shown in Figures S6C and S6F; post hoc Sidak’s tests; n = 7 control and n = 8 food-restricted mice, with 478 control and 866 grating-responsive neurons, respectively). (C) Mean orientation tuning width for control and food-restricted (two-way ANOVA run for the whole dataset shown in Figures S6D and S6G; post hoc Sidak’s test; n = 7 control and n = 8 food-restricted mice). (D) Left: mean accuracy in decoding natural images taken from different environments (coarse discrimination; dissimilarity score between scenes = 41.8; see STAR Methods for calculation of dissimilarity score) (maximum likelihood decoder; p = 0.76, t test; n = 6 control and n = 7 food-restricted mice). Dotted line: chance level (1/2 scenes from different environment). Right: mean accuracy in decoding natural images taken from the same environment (fine discrimination; dissimilarity score between scenes = 22.9) (t test; n = 6 control and n = 7 food-restricted animals). Dotted line: chance level (1/58 scenes from the same environment). The same number of neurons was used for decoding across animals. (E) Top: schematic for behavioral experiments. Animals were placed in a modified water Y-maze and had to choose the arm associated with a target grating in order to reach a hidden platform and escape the water. Bottom: behavioral performance as a function of discrimination difficulty, which was altered by changing the angle difference between target and non-target grating. Dotted line: chance (a priori Sidak’s test: control versus food-restricted at 10°, p = 0.85; at 7.5°, p < 0.01; at 5°, p = 0.14; n = 13 control and n = 15 food-restricted mice). p < 0.05, ∗∗p < 0.01, and ∗∗∗p < 0.001. Error bars are S,E.M. See also Figure S5.
Figure 7
Figure 7
Food restriction affects cortical coding precision via leptin signaling (A) Experimental timeline and animal weight. (B) Mean leptin levels (one-way ANOVA, p < 0.0001; post hoc Sidak’s test, control + saline versus food-restricted + leptin: p = 0.15; n = 7 CTR + saline, n = 7 food-restricted + saline, and n = 5 food-restricted + leptin animals). (C) Mean orientation tuning width (two-way repeated-measures ANOVA; group effect: p < 0.0005; post hoc Sidak’s test, control versus control + saline: p = 0.54; food-restricted versus food-restricted + saline: p = 0.96; control versus food-restricted: p = 0.015; control saline versus food-restricted saline: p < 0.0001; CTR + saline versus food-restricted + leptin: p = 0.17; n = 6 control + saline, n = 5 food-restricted + saline, and n = 5 FR + leptin animals). (D) Mean accuracy in decoding natural images taken from the same environment (fine discrimination) (one-way ANOVA, p = 0.018; control + saline versus food-restricted + leptin: p = 0.87; n = 5 control + saline, n = 6 food-restricted + saline, and n = 5 food-restricted + leptin animals). Dotted line: chance level (1/59 scenes from the same environment). p < 0.05, ∗∗p < 0.01, and ∗∗∗∗p < 0.0001. Error bars are S,E.M. See also Figures S6 and S7.

Comment in

References

    1. Adesnik H. Synaptic mechanisms of feature coding in the visual cortex of awake mice. Neuron. 2017;95:1147–1159.e4. - PMC - PubMed
    1. Ahima R.S., Prabakaran D., Mantzoros C., Qu D., Lowell B., Maratos-Flier E., Flier J.S. Role of leptin in the neuroendocrine response to fasting. Nature. 1996;382:250–252. - PubMed
    1. Albert M.V., Schnabel A., Field D.J. Innate visual learning through spontaneous activity patterns. PLoS Comput. Biol. 2008;4:e1000137. - PMC - PubMed
    1. Arieli A., Sterkin A., Grinvald A., Aertsen A. Dynamics of ongoing activity: explanation of the large variability in evoked cortical responses. Science. 1996;273:1868–1871. - PubMed
    1. Attwell D., Laughlin S.B. An energy budget for signaling in the grey matter of the brain. J. Cereb. Blood Flow Metab. 2001;21:1133–1145. - PubMed

Publication types

Substances

LinkOut - more resources