. 2022 Jan:135:105447.
doi: 10.1016/j.psyneuen.2021.105447. Epub 2021 Oct 16.

Relationships between constitutive and acute gene regulation, and physiological and behavioral responses, mediated by the neuropeptide PACAP

Affiliations

Relationships between constitutive and acute gene regulation, and physiological and behavioral responses, mediated by the neuropeptide PACAP

Dana Bakalar et al. Psychoneuroendocrinology. 2022 Jan.

Erratum in

Abstract

Since the advent of gene knock-out technology in 1987, insight into the role(s) of neuropeptides in centrally- and peripherally-mediated physiological regulation has been gleaned by examining altered physiological functioning in mammals, predominantly mice, after genetic editing to produce animals deficient in neuropeptides or their cognate G-protein coupled receptors (GPCRs). These results have complemented experiments involving infusion of neuropeptide agonists or antagonists systemically or into specific brain regions. Effects of gene loss are often interpreted as indicating that the peptide and its receptor(s) are required for the physiological or behavioral responses elicited in wild-type mice at the time of experimental examination. These interpretations presume that peptide/peptide receptor gene deletion affects only the expression of the peptide/receptor itself, and therefore impacts physiological events only at the time at which the experiment is conducted. A way to support 'real-time' interpretations of neuropeptide gene knock-out is to demonstrate that the wild-type transcriptome, except for the deliberately deleted gene(s), in tissues of interest, is preserved in the knock-out mouse. Here, we show that there is a cohort of genes (constitutively PACAP-Regulated Genes, or cPRGs) whose basal expression is affected by constitutive knock-out of the Adcyap1 gene in C57Bl6/N mice, and additional genes whose expression in response to physiological challenge, in adults, is altered or impaired in the absence of PACAP expression (acutely PACAP-Regulated Genes, or aPRGs). Distinguishing constitutive and acute transcriptomic effects of neuropeptide deficiency on physiological function and behavior in mice reveals alternative mechanisms of action, and changing functions of neuropeptides, throughout the lifespan.

Keywords: Neuropeptide; PACAP; Stress responding; Transcriptomics.


Figures

Figure 1.
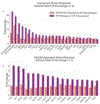
Figure 1.. Transcripts differentially expressed in hypothalamus of constitutively PACAP- deficient mice.
Microarray analysis reveals genes which are differentially expressed (p < 0.01, fold-change +/− 2 or greater) between non-stressed PACAP KO and non-stressed WT mice in both hypothalamic microarrays. Hypothalamus experiment 1: N = 3 male wildtype and N= 3 male PACAP KO. Hypothalamus experiment 2, N = 3 males and N = 3 females of each genotype. Bar graph shows the mean fold-change (+/− standard error of the mean) of PACAP KO hypothalamus versus WT hypothalamus across both experiments. Color bar indicates p-value of comparison. Inset Venn depicts overlap between the two experiments.
Figure 2.
Figure 2.. Constitutively PACAP-regulated genes across three brain regions.
A) Fold-change in Adcyap1 expression in PACAP-deficient mice in various tissues. Bar graph shows fold-change of PACAP KO mice versus WT mice within each experiment. Color bar indicates p-value of comparison. Fold-change in Adcyap1 expression varies across tissues/brain regions despite identical deletion of the Adcyap1 gene at all sites due to differences in the intrinsic expression of the Adcyap1 transcript and the threshold for transcript detection by microarray analysis (see text). B) Constitutively PACAP-regulated genes (cPRGs) identified by microarray analysis in hippocampus and cerebellum (N = 3 males and N = 3 females of each genotype in each tissue) and hypothalamus, as described previously. Genes were identified as cPRGs if they were differentially expressed between PACAP KO and WT mice (p < 0.01, fold-change +/− 1.1 or greater) in PACAP knockout versus WT cerebellum and hippocampus and differentially expressed p < 0.01, fold-change +/− 2 or greater in both hypothalamic experiments. Mean +/− standard error of the mean, color bar indicates p-value of comparison.
Figure 3.
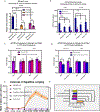
Figure 3.. Comparison of expression values for transcripts encoding the cPRGs Pttg1, Mid1, Xaf1, Pla2g4e, and Adcyap1, and independent verification of regulation assessed by qRT-PCR and in-situ hybridization.
A) Log2 expression values (mean expression value of all animals, +/− standard error of the mean) of Adcyap1 in non-stressed PACAP knockout versus wildtype mice of both sexes, in hypothalamus (combined experiments 1 and 2), cerebellum, and hippocampus. Expression of Adcyap1 is higher in wildtype hypothalamus than in other neural tissues. Comparison of wildtype and PACAP KO mice within each tissue shows that tissues with lower baseline Adcyap1 expression have smaller reductions in Adcyap1 expression in PACAP KO versus wildtype mice (Stars indicate significance of ANOVA comparing WT expression values to KO expression values. In hypothalamus, p = 3.39e-13, fold- change = −6.55; in cerebellum p = 3.17e-4, fold-change = −1.14; but not in hippocampus p = 1.22e-2, fold-change −1.09). B) qRT-PCR, with larger dynamic range, reveals significant decreases in Adcyap1 expression in all PACAP producing tissues. Two-way ANOVA revealed a significant main effect of genotype F(1,33) = 476.9, p < 0.0001. Post-hoc Šídák’s comparisons shows differences between PACAP KO and WT animals in hippocampus, hypothalamus, and cerebellum, p < 0.0001 in all tissues. Bar graph depicts mean and standard error of fold-change calculated using the 2−ΔΔCt technique with Gapdh as control. N = 6 mice per genotype in all tissues but hypothalamus, where N = 7 WT and 8 PACAP KO mice. C) Log2 expression values of Pttg1 in non-stressed PACAP knockout and wildtype mice of both sexes, in all microarray experiments. Putative cPRG Pttg1 is highly expressed in all tissues studied and is significantly reduced (ANOVA, p < 0.0001) in PACAP KO versus wildtype animals in all tissues. D) qRT-PCR confirms significant loss of Pttg1 in hypothalamus, cerebellum, hippocampus, and andadrenal gland (F(1,43) = 967.5, p < 0.0001, Post-hoc Šídák’s show p < 0.0001 for all comparisons). Bar graph depicts mean and standard error of fold-change calculated using the 2−ΔΔCt technique with Gapdh as control. N = 6 mice per genotype in all tissues but hypothalamus, where N = 7 WT and 8 PACAP KO mice. Animals used are identical to those used in B. E) Log2 expression values, in hypothalamus, of Mid1, Xaf1, and Pla2g4e, identified as cPRGs, in hypothalamus. ANOVA indicates significant differences (p < 0.0001) in each gene in hypothalamus. F) qRT-PCR confirms that transcriptomic alterations are significant in the direction found in microarrays. Multiple t-tests with Bonferroni correction shows significant differences between WT and KO for Mid1 (t(13) = 10.97, adjusted p < 0.0001), Xaf1 (t(13) = 8.89, adjusted p = 0.000002) and Pla2g4e (t(13) = 3.156, adjusted p = 0.022). Bar graph depicts mean and standard error of fold-change calculated using the 2−ΔΔCt technique with Gapdh as control. N = 7 WT and N = 8 PACAP KO mice. G, H) RNAscope in-situ hybridization (Max z-projection of stacks) visualizing mRNA for Pttg1 (red) and Xaf1 (green) are depicted in lateral hypothalamus of one WT (G) and one PACAP KO (H) mouse. The decrease in Pttg1 expression and increase in Xaf1 expression are visually evident in the PACAP KO mouse.
Figure 4.
Figure 4.. Effects of stress on hypothalamic transcriptome of PACAP KO versus WT mice.
A) Conserved stress response genes are regulated by stress in WT animals (comparison of WT stressed to WT non-stressed (purple) p < 0.01) and in PACAP KO mice (comparison of PACAPKO stressed to wildtype non-stressed (pink), p < 0.01). These genes do not differ between WT and PACAP KO mice without stress (yellow). B) A PACAP-dependent stress response is indicated by genes which are upregulated in response to stress among wildtype mice but fail to be recruited in PACAP KO mice. These genes do not differ between WT and PACAP KO mice without stress (yellow). Fold-changes are absolute values. All significant changes were in the positive direction, but in B, some comparisons between non-stressed animals were non-significantly negative.
Figure 5.
Figure 5.. Effects of PACAP knockout and stress on adrenal transcriptome.
A) Conserved stress response genes are regulated by 3 hours of restraint stress in WT animals (comparison of WT stressed to WT non-stressed (purple), p < 0.01, fold-change +/− 3 or greater depicted here) and in PACAP KO mice (comparison of PACAP KO stressed to wildtype non-stressed (yellow), p <= 0.01, fold-change +/−3 or greater depicted here). Red line indicates fold-change threshold of 3 used for graphing, but note that in text (section 3.3) a threshold of 1.5-fold reveals many more conserved genes. B) A PACAP-dependent stress response is indicated by genes which are upregulated in response 3 hours of restraint stress among WT mice (comparison of WT stressed to WT non-stressed, p <= 0.01, fold-change +/− 3 or greater depicted here) but fail to be recruited in PACAP KO mice. Red line indicates fold-change threshold of 1.5. Genes regulated by more than 1.5-fold in PACAP KO stressed vs WT non-stressed mice (yellow bars extending above red line) fail to meet the p-value significance cutoff of p <= 0.01. Comparison of PACAPKO stressed to WT non-stressed not depicted in this figure, but no genes included differ between genotypes in the non-stressed condition.
Figure 6.
Figure 6.. Adrenal gland, stress, and regulation of the aPRGs Stc1 and Ier3.
A) Log2 expression values of IEGs Ier3 and Stc1 in adrenal gland microarray show increased Ier3 and Stc1 following 3 hours of restraint in wildtype but not PACAP knockout mice, relative to non-stressed wildtype mice. A’) Two-way ANOVA analysis of qRT-PCR for adrenal Stc1 shows a significant interaction between time restrained and genotype F(2,25) = 6.99, p = 0.0039: While there was no difference between non-stressed WT (N = 4) and PACAP KO mice (N = 5), Šídák’s test showed significant increases in WT (p < 0.0001), but not in PACAP KO (p = 0.419) adrenal gland following 1 hour restraint stress (N = 6 stressed mice of each genotype). Wildtype animals, however, had significantly higher Stc1 expression (p = 0.0035) than PACAP KO mice at 1-hour stress. At 6 hours of stress (N = 6 mice of each genotype), Stc1 levels had dropped relative to 1-hour stress significantly in wildtype (p = 0.0015) mice, returning to baseline levels. Asterisks indicate significant difference between genotypes within timepoints, while pound signs indicate significant difference between untreated and 1 hour stressed animals within each genotype. A”) qRT-PCR shows that immediate early gene Ier3 is increased after 1-hour restraint stress in wildtype and PACAP KO adrenal gland. Two-way ANOVA shows a significant interaction between time restrained and genotype F(2,25) = 15.60, p < 0.0001: While there was no difference between non-stressed wildtype and PACAP KO mice, Šídák’s test showed significant increases in both WT, p < 0.0001, and PACAP KO p = 0.0002 adrenal gland after 1 hour stress, compared to non-stressed animals. Wildtype animals, however, had significantly higher Ier3 expression after stress (p < 0.0001) than PACAP KO mice. By 6 hours of restraint, Ier3 levels had dropped relative to 1-hour stress significantly in wildtype (p < 0.001) and PACAP KO (p = 0.0004) animals, returning to baseline levels. Asterisks indicate significant difference between genotypes within timepoints, while pound signs indicate significant difference between untreated and 1 hour stressed animals within each genotype. Animals are the same as in A’. B) Log2 expression values of IEGs Ier3 and Stc1 in hypothalamus show no significant difference in wildtype and PACAPKO regulation of Ier3 or Stc1 following 3 hours of restraintrelative to non-stressed wildtype mice. B’, B”) qRT PCR confirms no alteration of Stc1 or Ier3 in either wildtype or PACAP KO mice after 1 or 6 hours of restraint stress.
Figure 7.
Figure 7.. Physiological and Behavioral phenotypes: Hypophagia, Corticosterone, Repetitive jumping.
A) Blunting of stress-induced hypophagia occurs in both male and female PACAP KO mice. Three-way ANOVA found no main effect of sex and no interactions between sex and either stress or genotype, so sexes were combined and analyzed with 2-way ANOVA. There were main effects of Stress (F(2,94) = 53.76, p < 0.0001), of Genotype (F(2,94) = 7.21, p = 0.0012) and a significant Stress by Genotype interaction (F(2,94) = 14.6, p < 0.0001). Šídák’s multiple comparisons test showed that while (N = 18) WT mice lost significant weight following stress (p < 0.0001), neither PACAP nor PAC1 KO mice did. Therefore, stressed WT mice lost significantly more weight than stressed PACAP KO or PAC1 KO mice (p < 0.0001 for both). N = 18 stressed and 12 non-stressed WT, 19 stressed and 10 non-stressed PACAP KO, and 20 stressed and 22 non-stressed PAC1 KO mice. B) Corticosterone increases following 3 hours of restraint stress in PACAP KO, PAC1 KO, and WT mice of both sexes (3-way ANOVA, Main effect of Stress F (1, 88) = 397.2, p < 0.0001). Tukey’s multiple comparisons test showed significant increases after stress in all groups (p < 0.0001, stars). However, the increase is blunted in both male and female PACAP KO mice (hashes; Male WT Stressed (N = 14) vs Male PACAP KO Stressed (N = 10), p < 0.0001; Male WT Stressed vs Male PAC1 KO stressed (N = 15), p < 0.0001; Female WT Stressed (N = 4) vs Female PACAP KO Stressed (N = 7), p< 0.0001; Female WT Stressed vs Female PAC1 KO stressed (N = 5), p = 0.012). C) Lack of jumping is correlated with non-depletion of the cPRG Pttg1. In prefrontal cortex of (N = 6) CaMK2α-CRE PACAPfl/fl mice, compared with N = 6 PACAPfl/fl control mice, Adcyap1 was significantly reduced (2-way ANOVA, Šídák’s multiple comparisons test p = 0.0003), but Pttg1 was not. In cerebellum, neither gene was altered in CaMK2α-CRE PACAPfl/fl mice relative to controls. D) In (N = 5) VGaT-CRE PACAPfl/fl mice, Adcyap1 was significantly reduced in both PFC (2-way ANOVA, Šídák’s multiple comparisons test p = 0.015) and cerebellum relative to control PACAPfl/fl mice (N = 6) (2-way ANOVA, Šídák’s multiple comparisons test p <0.0001),but Pttg1 was not altered relative to controls in either tissue. E, E’) While (N=12) constitutive PACAP knockout mice perform a repetitive jumping behavior at high rates (yellow line), none of the other tested animals (N = 7 PACAPfl/fl controls, N = 4 PAC1 KO, N = 5 CaMK2α-CRE PACAPfl/fl, and N = 4 VGaT-CRE PACAPfl/fl ) jump. Repetitive jumping over the course of 24 hours is shown in 7E, while average number of repetitive jumping bouts per half-hour during the dark cycle is shown in E’. Brown-Forsythe ANOVA test revealed a significanteffect of genotype (F(4,11) = 12.96), with Dunnett’s T3 multiple comparisons test showing significantly higher jumping in PACAP KO than all other groups (p = 0.036 for all comparisons).

References

    1. Allen Cell Types Database. 2015.
    1. Agarwal A, Halvorson LM, Legradi G, 2005. Pituitary adenylate cyclase-activating polypeptide (PACAP) mimics neuroendocrine and behavioral manifestations of stress: Evidence for PKA-mediated expression of the corticotropin-releasing hormone (CRH) gene. Brain Res Mol Brain Res 138, 45–57. - PMC - PubMed
    1. Ait-Ali D, Samal B, Mustafa T, Eiden LE, 2010. Neuropeptides, growth factors and cytokines: A cohort of informational molecules whose expression is up-regulated by the stress-associated slow transmitter PACAP in chromaffin cells. Cell. Mol. Neurobiol. 30, 1441–1449. - PMC - PubMed
    1. Beaulé C, Mitchell JW, Lindberg PT, Damadzic R, Eiden LE, Gillette MU, 2009. Temporally restricted role of retinal PACAP: integration of the phase-advancing light signal to the SCN. Journal of biological rhythms 24, 126–134. - PMC - PubMed
    1. Botia B, Basille M, Allais A, Raoult E, Falluel-Morel A, Galas L, Jolivel V, Wurtz O, Komuro H, Fournier A, 2007. Neurotrophic effects of PACAP in the cerebellar cortex. Peptides 28, 1746–1752. - PubMed

Publication types

MeSH terms

Substances