. 2022 Feb:40:102476.
doi: 10.1016/j.nano.2021.102476. Epub 2021 Nov 4.

Optical biosensing of markers of mucosal inflammation

Affiliations

Optical biosensing of markers of mucosal inflammation

Obdulia Covarrubias-Zambrano et al. Nanomedicine. 2022 Feb.

Abstract

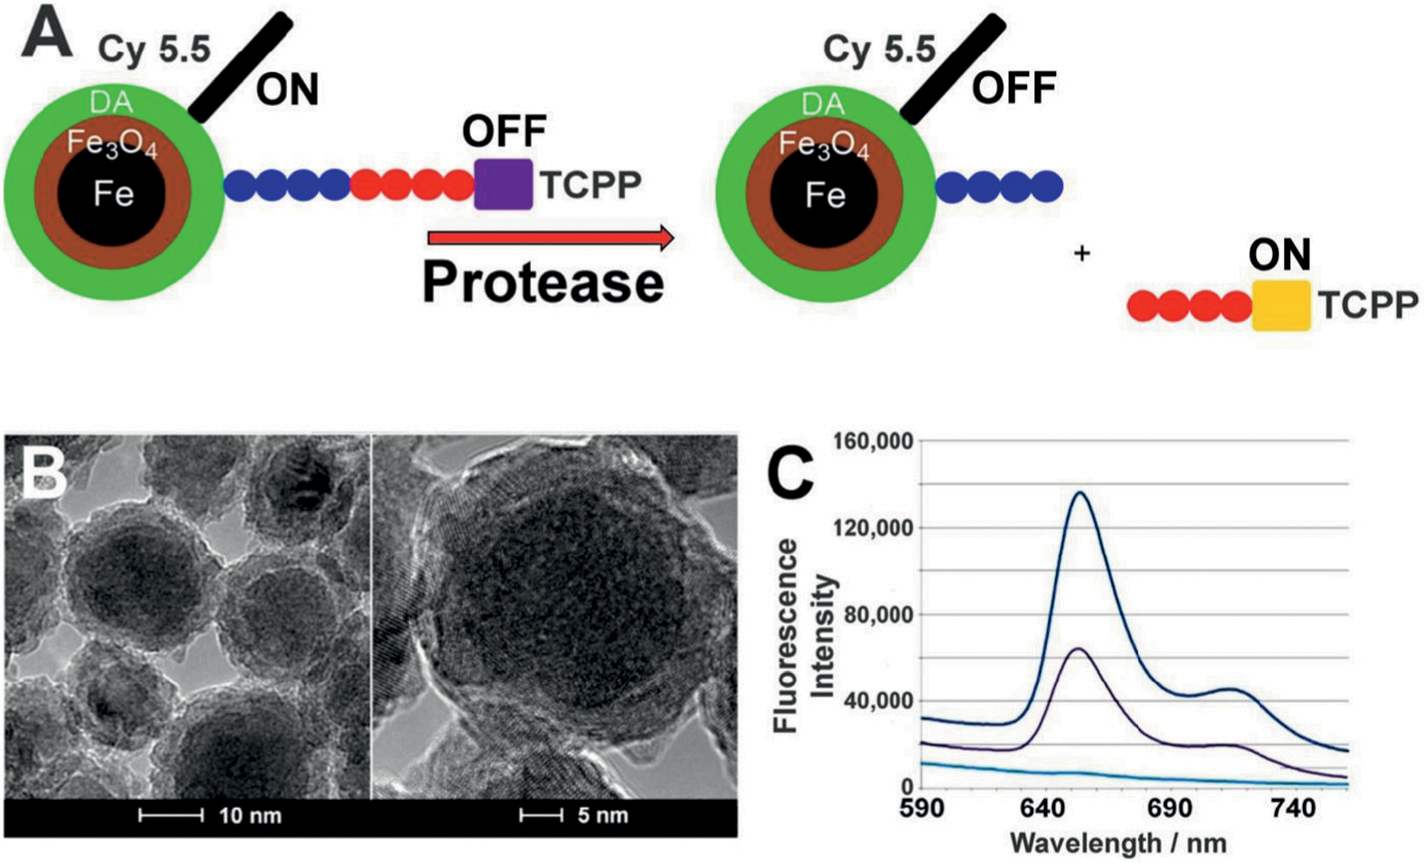
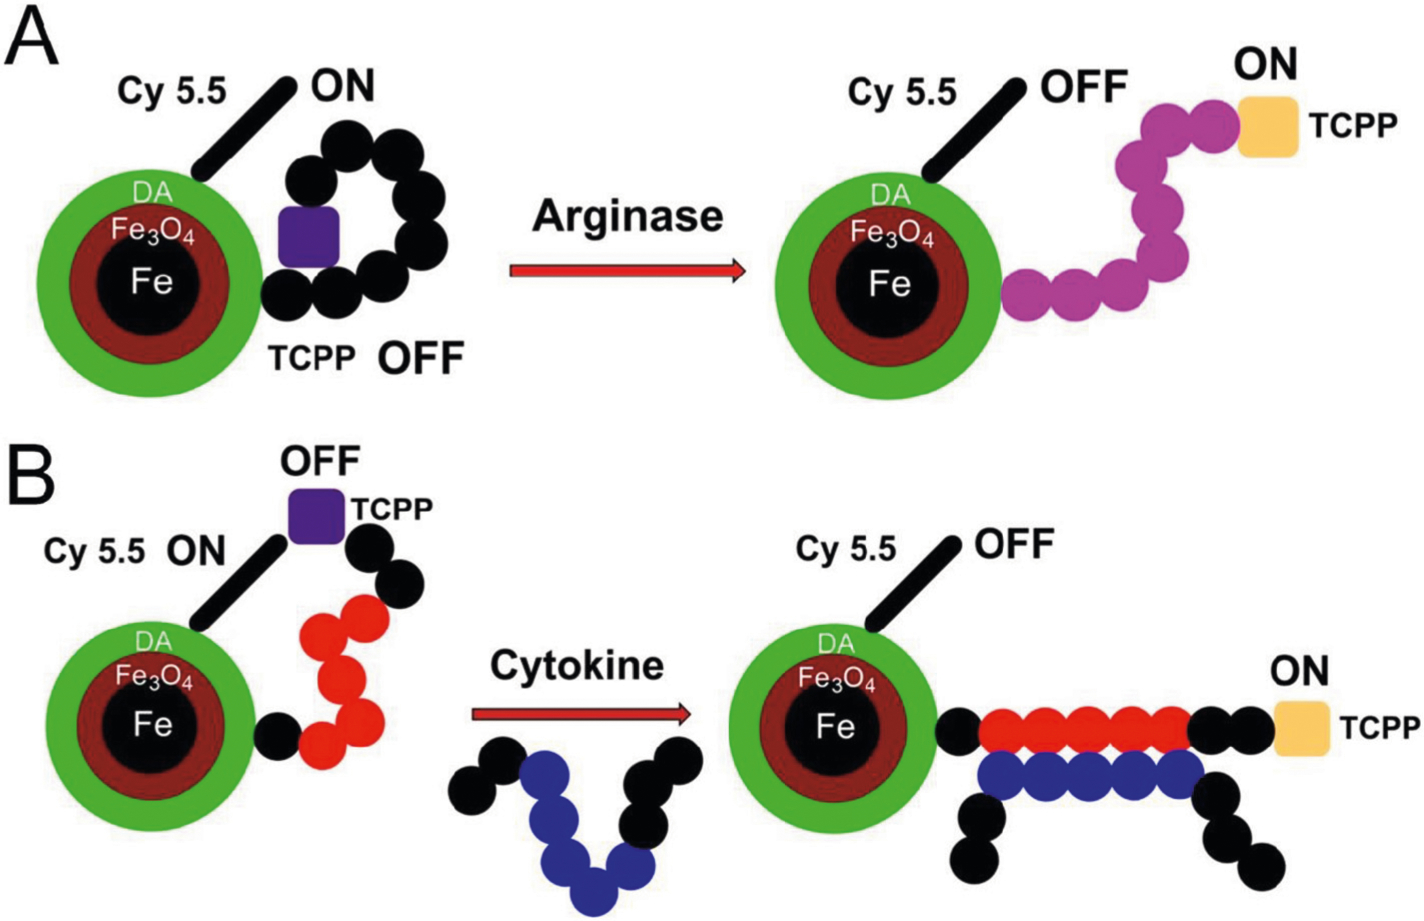
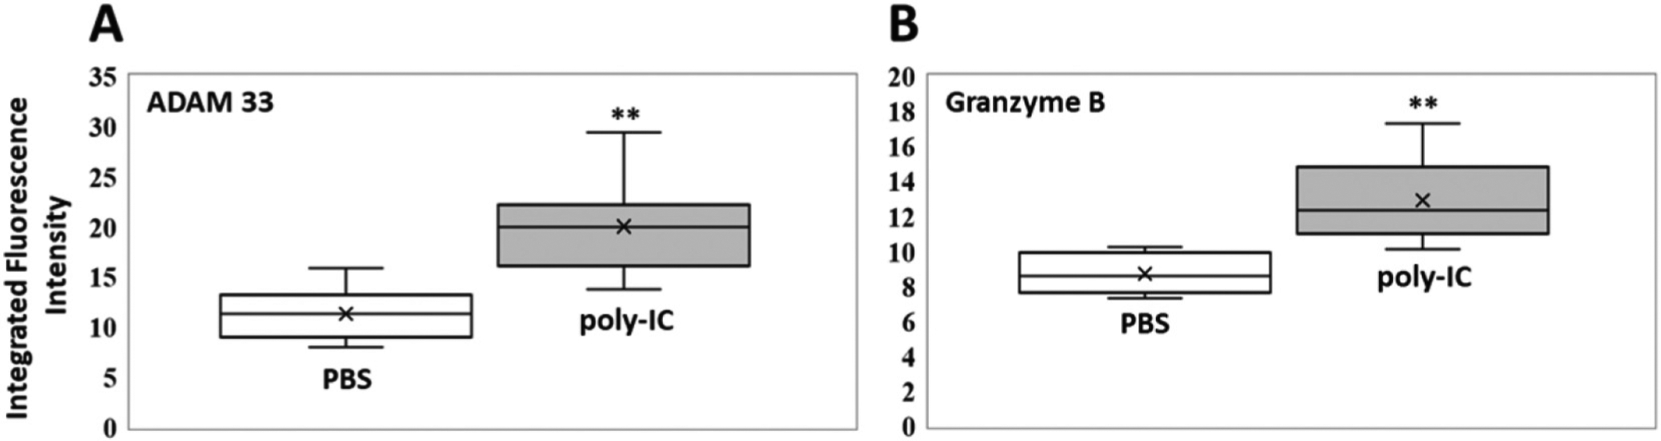
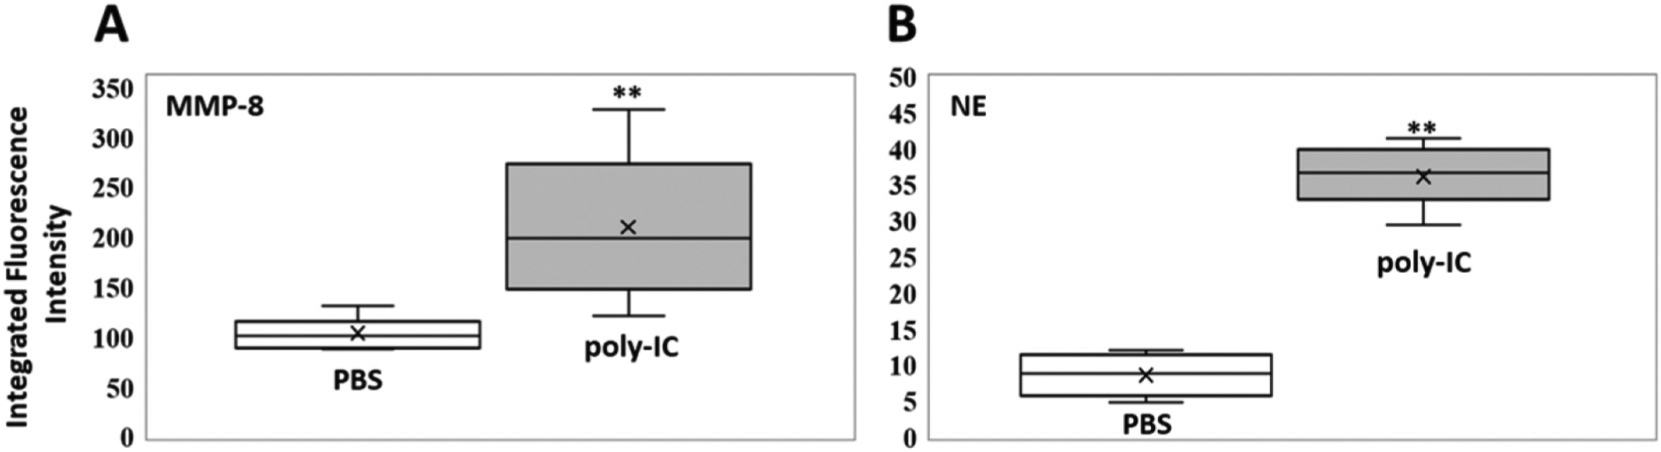
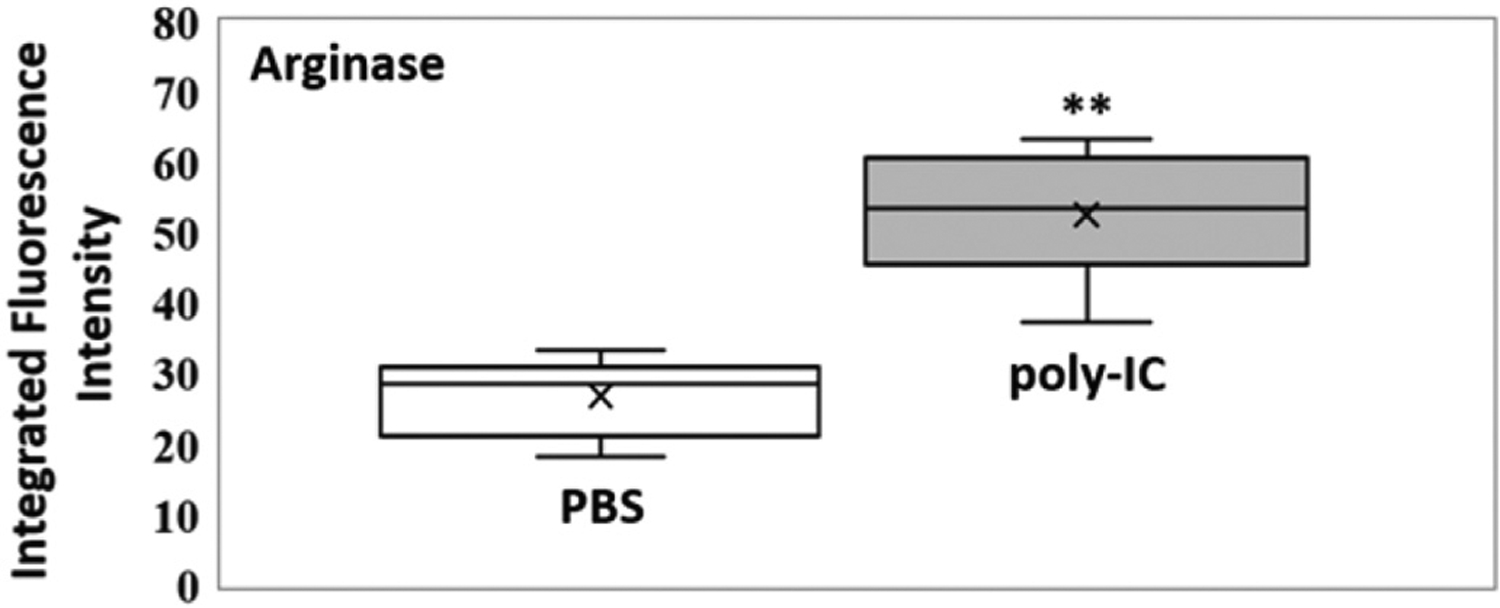
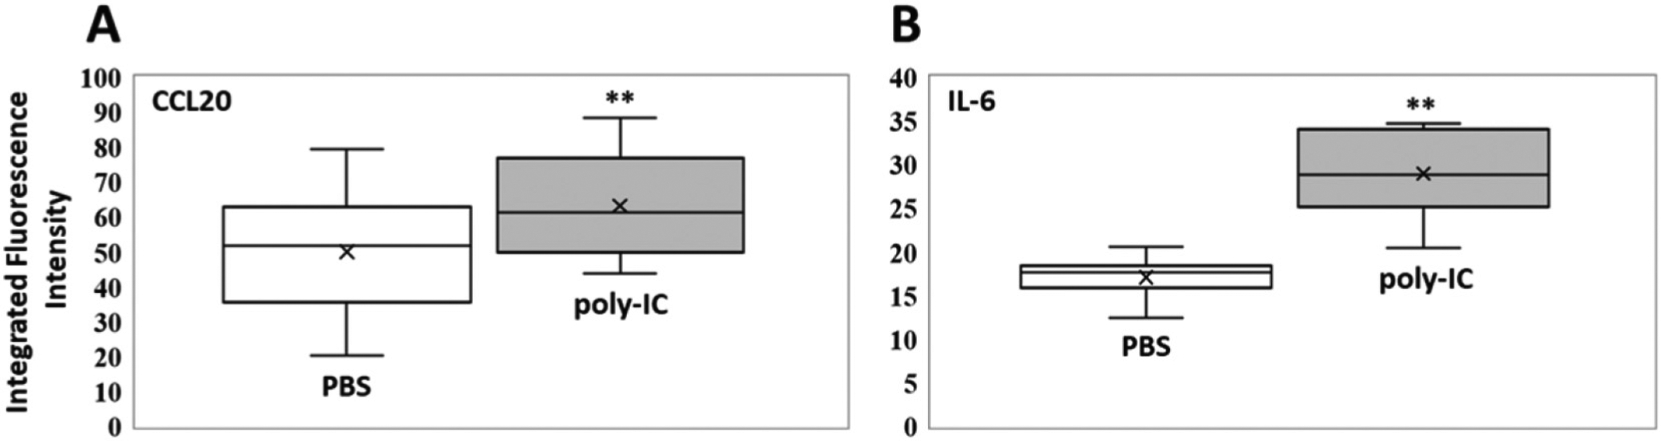
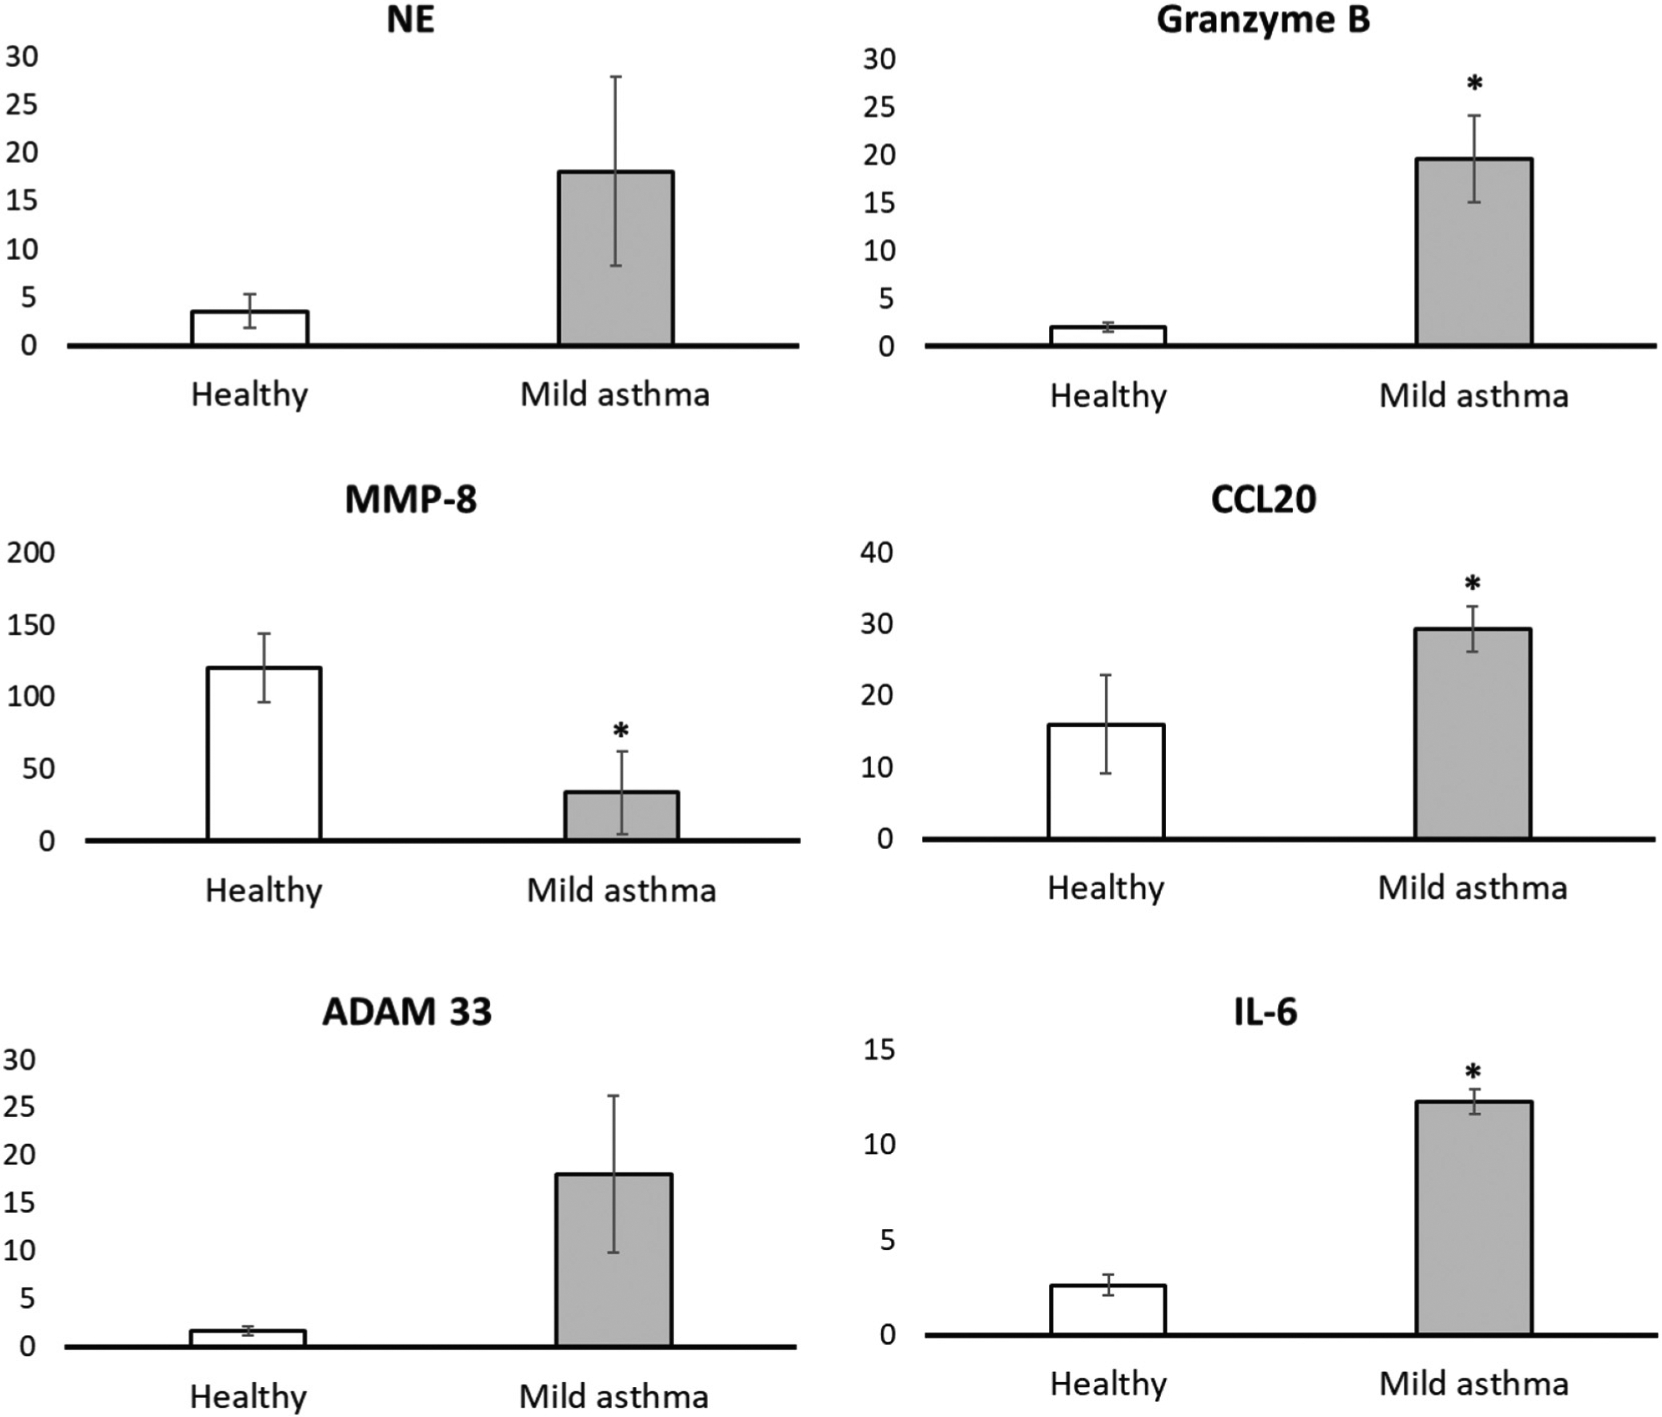
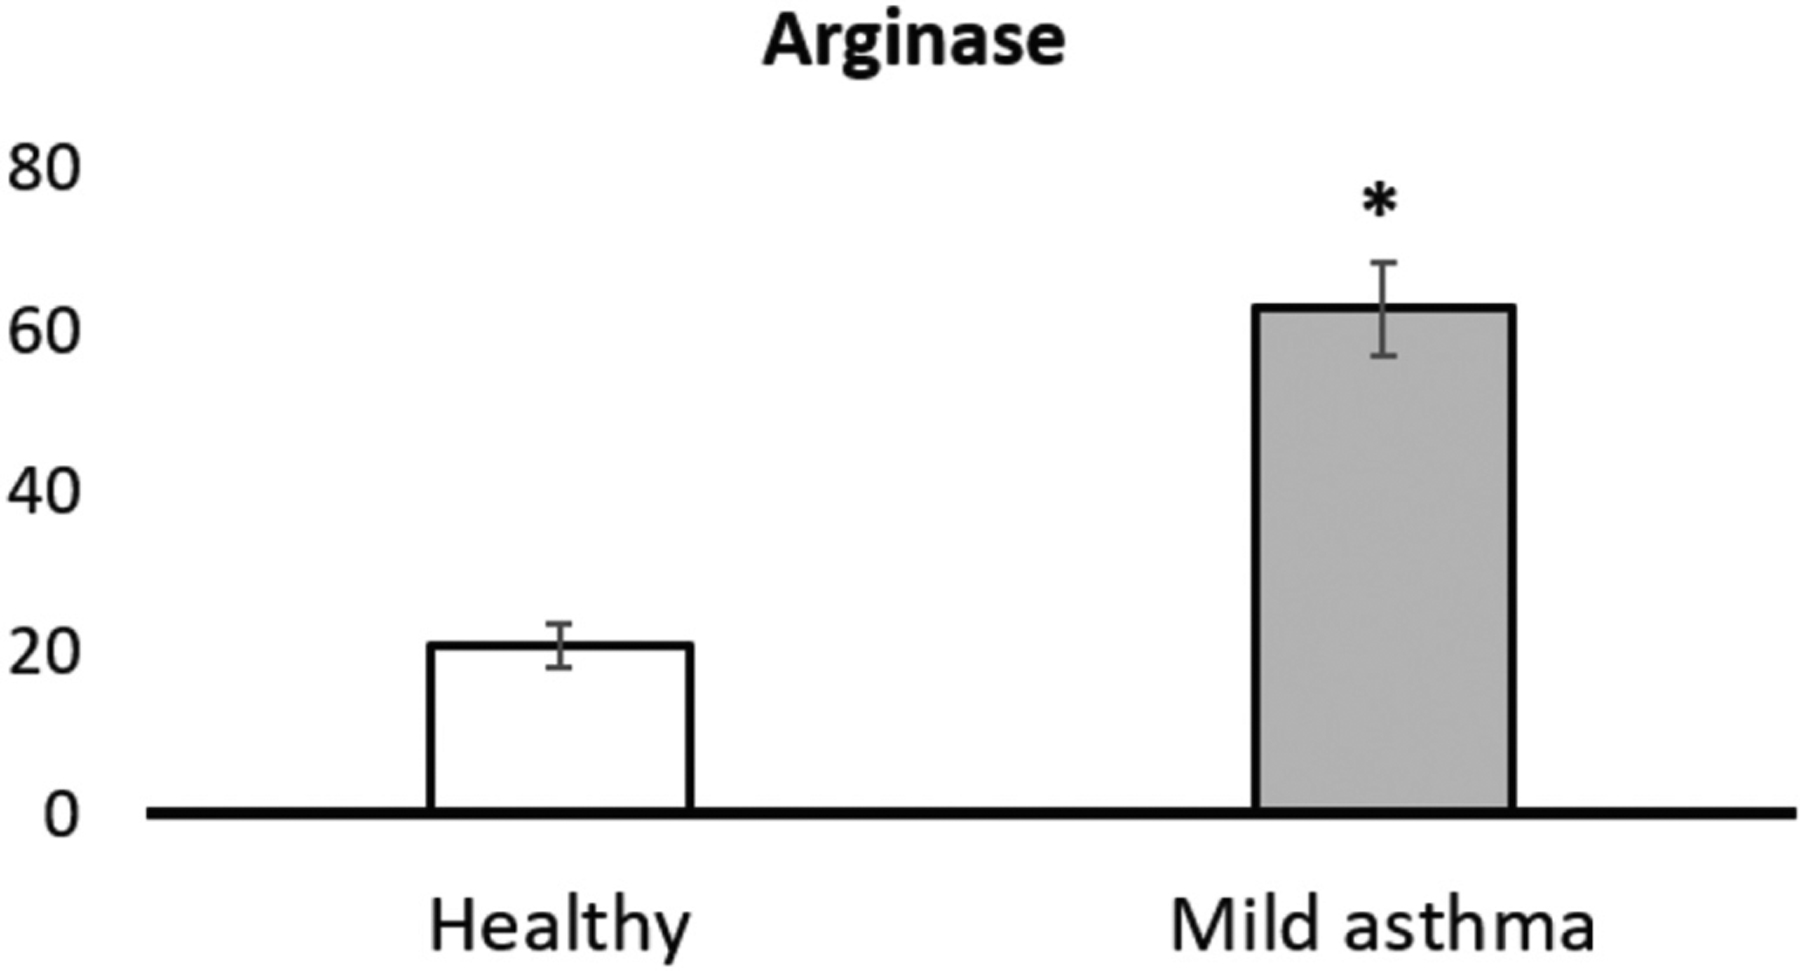
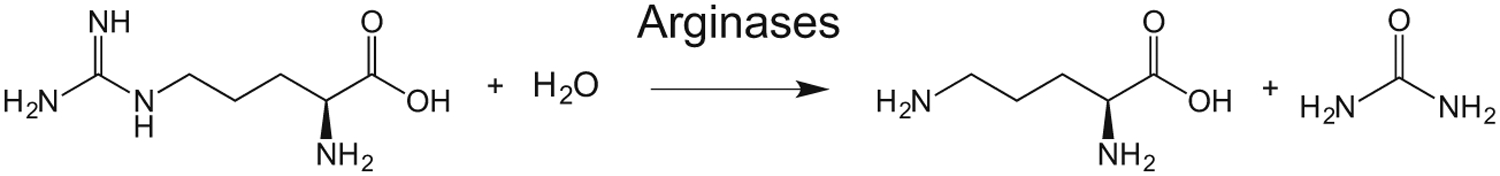
We report the design and adaptation of iron/iron oxide nanoparticle-based optical nanobiosensors for enzymes or cytokine/chemokines that are established biomarkers of lung diseases. These biomarkers comprise ADAM33, granzyme B, MMP-8, neutrophil elastase, arginase, chemokine (C-C motif) ligand 20 and interleukin-6. The synthesis of nanobiosensors for these seven biomarkers, their calibration with commercially available enzymes and cytokines/chemokines, as well as their validation using bronchoalveolar lavage (BAL) obtained from a mouse model of TLR3-mediated inflammation are discussed here. Exhaled Breath Condensate (EBC) is a minimally invasive approach for sampling airway fluid in the diagnosis and management of various lung diseases in humans (e.g., asthma, COPD and viral infections). We report the proof-of-concept of using human EBC in conjunction with nanobiosensors for diagnosis/monitoring airway inflammation. These findings suggest that, with nanosensor technology, human EBC can be utilized as a liquid biopsy to monitor inflammation/remodeling in lung disease.

Keywords: Iron/iron oxide core/shell nanoparticle; Lung inflammation; Nanodiagnostics; Nanomedicine; Optical biosensor.


Conflict of interest statement

The authors declare no competing financial interest.

Figures

Figure 1.
Figure 1.
(A) Design principles of a nanobiosensor for protease detection. The OFF mode (left side schematic) occurs when distance between fluorophore TCPP (tetrakis-carboxyphenyl-porphyrin), Fe/Fe3O4 nanoparticle, and FRET-acceptor cyanine (Cy) 5.5C is reduced; upon cleavage of the oligopeptide tether by a suitable protease present, this distance increases and leads to an increase in fluorescence intensity, which is called the ON mode (right side schematic). Blue and red colored circles indicate consensus sequences, as explained in Table 2. (B) TEM and HRTEM of dopamine-coated Fe/Fe3O4 core/shell nanoparticles showing basic core (darker areas) and shell (lighter areas) structure. (C) Typical emission spectra occurring from the nanosensor for MMP-13 after 1 h of incubation at 37 °C (λexc = 421 nm). Lower light blue line: buffer; middle black line: nanosensor; higher dark blue line: nanosensor after incubation with MMP-13.
Figure 2.
Figure 2.
(A) Design principles of the improved nanobiosensor for arginase detection. Due to the presence of seven L-arginine residues in G(R7) TCPP is quenched by means of three quenching mechanisms: 1) plasmonic quenching, 2) FRET, and 3) proton transfer quenching. When L-arginase is modified by arginase (I + II) to L-ornithine, the dynamics of the tether changes, thus reducing plasmonic quenching and FRET. Due to the hydrolytic release of urea from L-arginine, proton transfer quenching is no longer possible, and the reaction ceases. The overall effect is switching on TCPP fluorescence, in response to arginase activity, which can then be quantified. (B) Design principles of nanobiosensors for cytokine/chemokine detection. Instead of a consensus sequence, the tether features a peptide-binding site for an epitope on the cytokine/chemokine of interest. Cytokine/chemokine binding triggers a conformational change of the tether, resulting in a statistical increase of TCPP and Fe/Fe3O4/Cyanine (Cy) 5.5, which decreases both plasmonic quenching and FRET. Consequently, fluorescence increase of TCPP is observed. Whereas the distance dependence of FRET processes decreases with r−6, surface energy transfer, also known as plasmonic quenching, drops off according to r−4 characteristics.
Figure 3.
Figure 3.
Box plots (indicating the observed data range of integrated fluorescence intensity (BioTek Synergy H1) after 60 min of incubation at 300 K) for (A) ADAM 33 (left) and (B) Granzyme B (right) activities in mouse bronchoalveolar lavage for PBS (white; n = 8) vs. poly-IC in PBS (gray; n = 8). For both enzymes, ADAM 33 and Granzyme B, the differences in nanobiosensor fluorescence observed in the group of mice treated with poly-IC vs. the group treated with PBS were statistically significant (**P < 0.01). The LODs (0.1 femtomoles) for ADAM 33 and Granzyme B are 4.1 and 3.1 integrated fluorescence units, respectively.
Figure 4.
Figure 4.
Box plots (indicating the observed data range of integrated fluorescence intensity (BioTek Synergy H1) after 60 min of incubation at 300 K) for (A) MMP-8 (left) and (B) NE (right) activities in mouse bronchoalveolar lavage for PBS (white; n = 8) vs. poly-IC in PBS (gray; n = 8). For both enzymes, MMP-8 and NE, the differences in nanobiosensor fluorescence observed in the group of mice treated with poly-IC vs. the group treated with PBS were statistically significant (**P < 0.01). The LODs (0.1 femtomoles) for MMP-8 and NE are 7.3 and 5.2 integrated fluorescence units, respectively.
Figure 5.
Figure 5.
Box plot (indicating the observed data range of integrated fluorescence intensity (BioTek Synergy H1) after 60 min of incubation at 300 K) for arginase activity in mouse bronchoalveolar lavage for PBS (white; n = 8) vs. poly-IC in PBS (gray; n = 8). For arginase the difference in nanobiosensor fluorescence observed in the group of mice treated with poly-IC vs. the group treated with PBS was statistically significant (**P < 0.01). The LODs (0.1 femtomoles) for arginase is 5.5 integrated fluorescence units.
Figure 6.
Figure 6.
Box plots (indicating the observed data range of integrated fluorescence intensity (BioTek Synergy H1) after 60 min of incubation at 300 K) for (A) CCL20 (left) and (B) IL-6 (right) concentrations in mouse bronchoalveolar lavage for PBS (white; n = 8) vs. poly-IC in PBS (gray; n = 8). For IL-6 the difference in nanobiosensor fluorescence observed in the group of mice treated with poly-IC vs. the group treated with PBS was statistically significant (**P < 0.01), whereas it was not significant (n.s.) for CCL20 (P = 0.14).The LODs (0.1 femtomoles) for CCL20 and IL-6 are 3.5 and 2.8 integrated fluorescence units, respectively.
Figure 7.
Figure 7.
Detection of the activity of four proteases (ADAM 33, Granzyme B, MMP-8, and neutrophil elastase) in exhaled breath condensate in three patients with mild asthma (no corticosteroids) vs. three patients without asthma as control group. The analytic procedure is described in detail in the Experimental Section. Significant differences (P < 0.05) are annotated on each bar graph by marking with an asterisk; all other comparisons between control (healthy) and mild asthma demonstrated numerically higher means but were not statistically significant.
Figure 8.
Figure 8.
Detection of the activity of arginase in exhaled breath condensate in three patients with mild asthma (no corticosteroids) vs. three patients without asthma as control group. The analytic procedure is described in detail in the Experimental Section. The differences in arginase activity between healthy and patient groups were found to be significant (P < 0.05).
Scheme 1.
Scheme 1.
L-arginine is hydrolyzed by arginases I and II to L-ornithine and urea.

References

    1. Brasier AR. Identification of innate immune response endotypes in asthma: implications for personalized medicine. Curr Allergy Asthma Rep 2013;13(5):462–8. - PMC - PubMed
    1. Wiktorowicz JE, Jamaluddin M. Proteomic analysis of the asthmatic airway. Adv Exp Med Biol 2014;795:221–32. - PubMed
    1. Bossmann SH, Liquid biopsies for early cancer detection. In Biomaterials for cancer therapeutics, 2nd edition, Evolution and innovation, Park g, Ed. Elsevier: Amsterdam, 2020; pp. 233–259.
    1. Revelo AE, Martin A, Velasquez R, Kulandaisamy PC, Bustamante J, Keshishyan S, et al. Liquid biopsy for lung cancers: an update on recent developments. Ann Transl Med 2019;7(15) 349pp. - PMC - PubMed
    1. Pisapia P, Malapelle U, Troncone G. Liquid biopsy and lung cancer. Acta Cytol 2019;63(6):489–96. - PubMed

Publication types