. 2022 Jan 11;145(2):134-150.
doi: 10.1161/CIRCULATIONAHA.121.057709. Epub 2021 Nov 8.

Deep Learning of the Retina Enables Phenome- and Genome-Wide Analyses of the Microvasculature

Affiliations

Deep Learning of the Retina Enables Phenome- and Genome-Wide Analyses of the Microvasculature

Seyedeh Maryam Zekavat et al. Circulation. .

Abstract

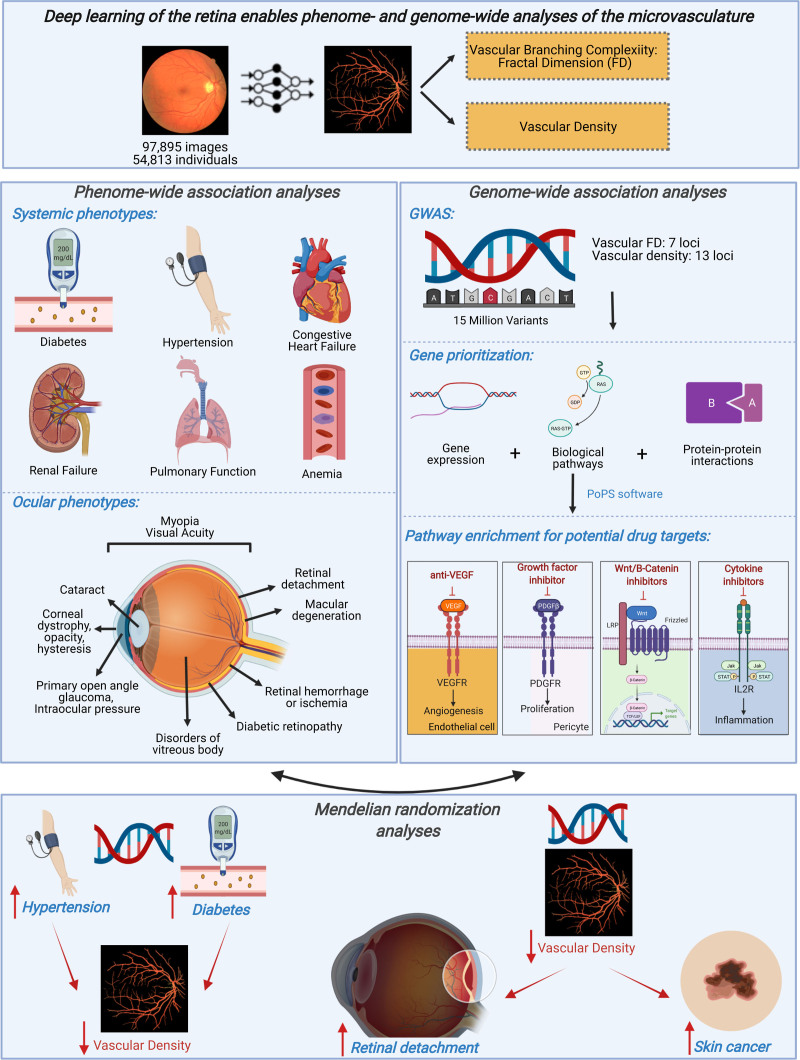
Background: The microvasculature, the smallest blood vessels in the body, has key roles in maintenance of organ health and tumorigenesis. The retinal fundus is a window for human in vivo noninvasive assessment of the microvasculature. Large-scale complementary machine learning-based assessment of the retinal vasculature with phenome-wide and genome-wide analyses may yield new insights into human health and disease.

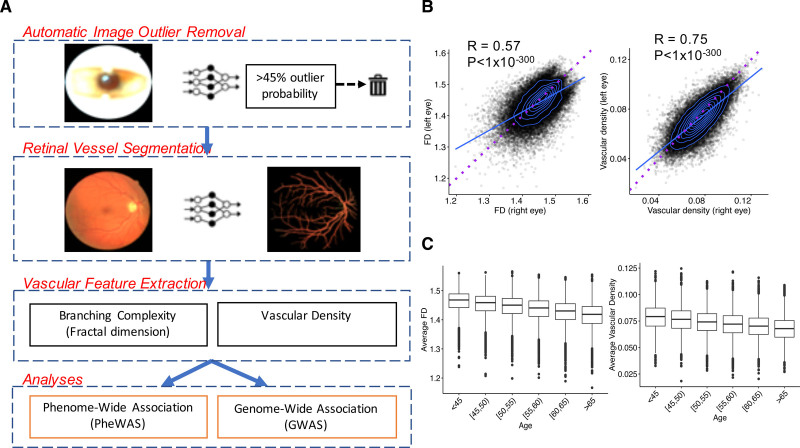
Methods: We used 97 895 retinal fundus images from 54 813 UK Biobank participants. Using convolutional neural networks to segment the retinal microvasculature, we calculated vascular density and fractal dimension as a measure of vascular branching complexity. We associated these indices with 1866 incident International Classification of Diseases-based conditions (median 10-year follow-up) and 88 quantitative traits, adjusting for age, sex, smoking status, and ethnicity.

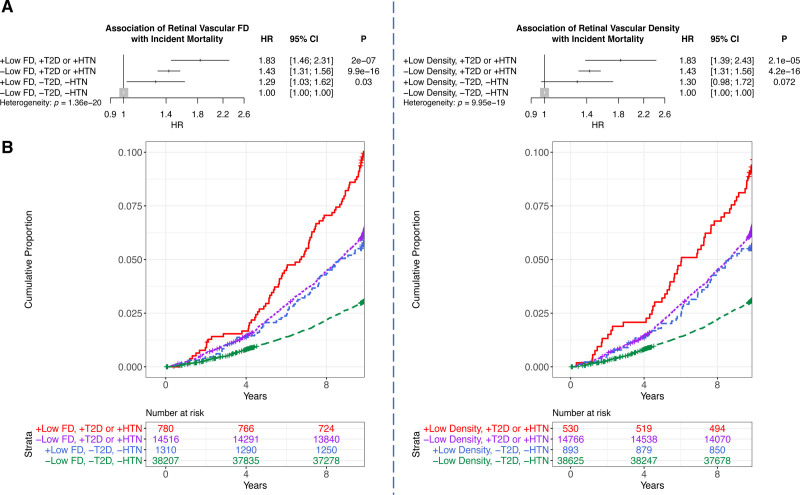
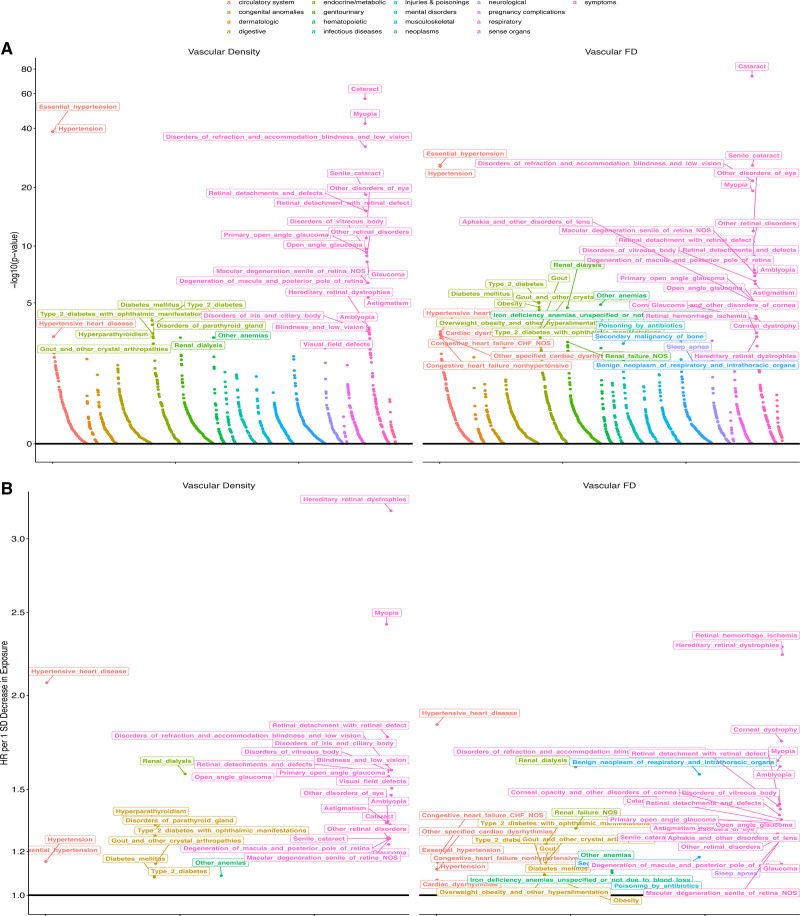
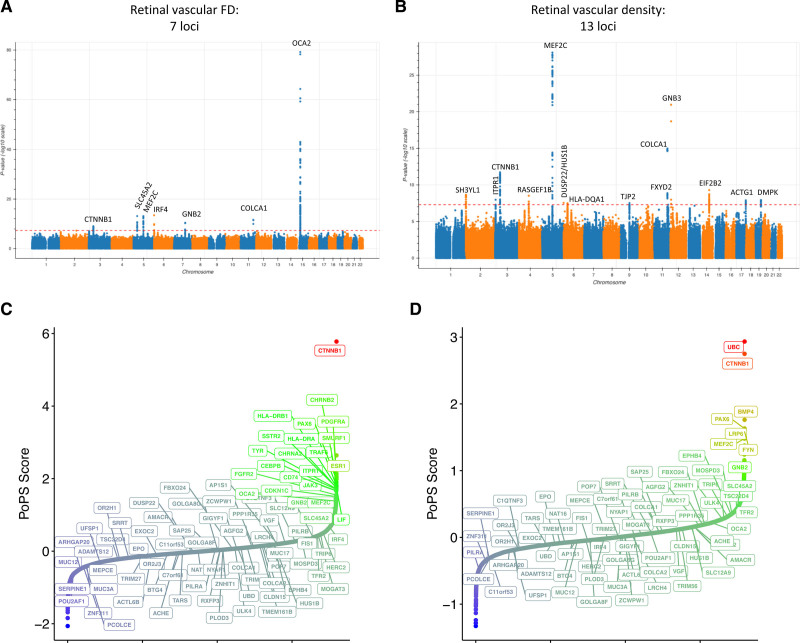
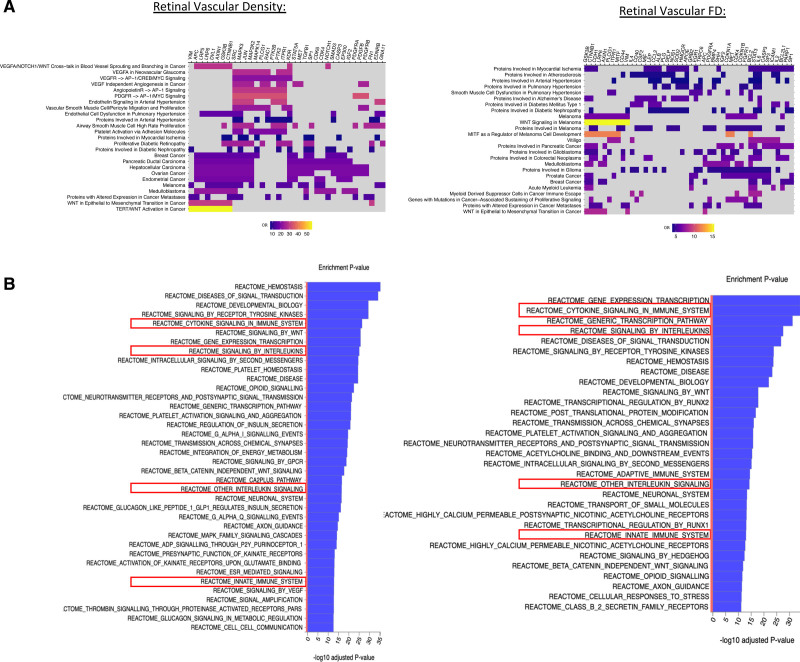
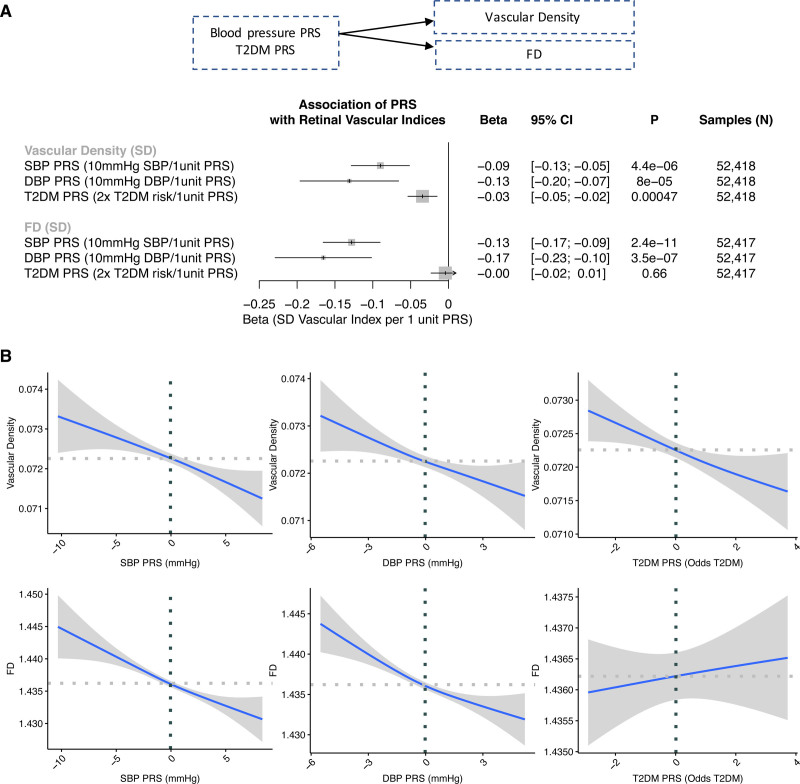
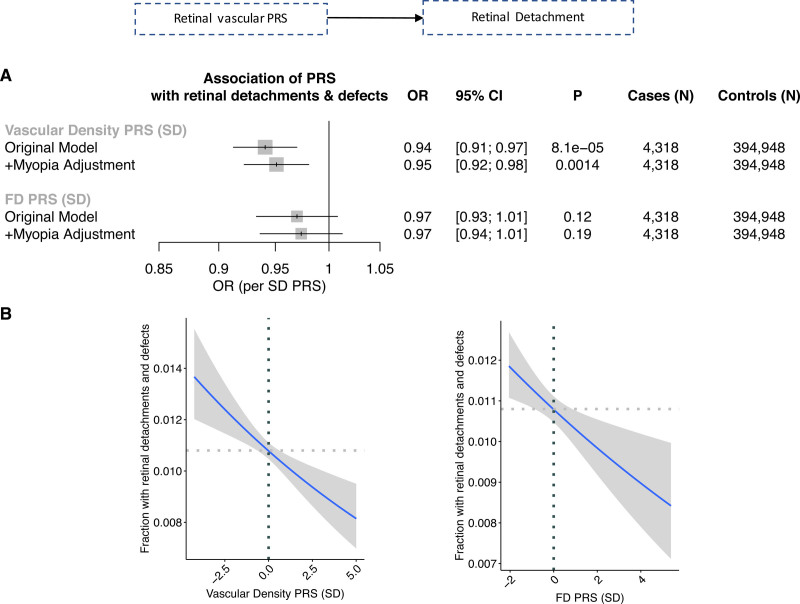
Results: Low retinal vascular fractal dimension and density were significantly associated with higher risks for incident mortality, hypertension, congestive heart failure, renal failure, type 2 diabetes, sleep apnea, anemia, and multiple ocular conditions, as well as corresponding quantitative traits. Genome-wide association of vascular fractal dimension and density identified 7 and 13 novel loci, respectively, that were enriched for pathways linked to angiogenesis (eg, vascular endothelial growth factor, platelet-derived growth factor receptor, angiopoietin, and WNT signaling pathways) and inflammation (eg, interleukin, cytokine signaling).

Conclusions: Our results indicate that the retinal vasculature may serve as a biomarker for future cardiometabolic and ocular disease and provide insights into genes and biological pathways influencing microvascular indices. Moreover, such a framework highlights how deep learning of images can quantify an interpretable phenotype for integration with electronic health record, biomarker, and genetic data to inform risk prediction and risk modification.

Keywords: deep learning; epidemiology; genomics; mendelian randomization analysis; microvessels; retina.


Figures

Figure 1.
Figure 1.
Study schematic and vascular features. A, Here, we first used deep learning toward large-scale automated removal of low-quality images, followed by vessel segmentation. Next, using the vascular segmentations, we quantified 2 vascular indices: branching complexity as measured by fractal dimension (FD) and vascular density. Last, phenome- and genome-wide association analyses of retinal FD and vascular density were performed to discover phenotypes associated with the microvasculature and genotypes influencing these vascular indices. B, Significant Spearman correlations were observed between FD and vascular density of the right vs left eyes, with right eyes having significantly higher FD and vascular density compared with left eyes. Blue line reflects best-fit line; dotted purple line reflects the unity line (x=y). C, Relationship of FD and vascular density (averaged across right and left eyes) with age.
Figure 2.
Figure 2.
Association of retinal vascular FD and density with incident mortality. A, Association of low (≥2 SD below the mean) fractal dimension (FD) and density with incident mortality, stratified by whether the person has prevalent type 2 diabetes (T2D) or hypertension (HTN) at time of image acquisition. Analyses are adjusted for age, age squared, sex, smoking status, and ethnicity. B, Cumulative incidence of mortality across individuals with low FD and density who have a diagnosis of prevalent T2D or hypertension compared with those who do not. HR indicates hazard ratio.
Figure 3.
Figure 3.
Phenome-wide associations with incident disease. A, –Log10(P value) of associations of retinal vascular density and fractal dimension (FD) with incident disease plotted as grouped by phenotypic category. Associations were performed with Cox proportional hazards models adjusted for age, age squared, sex, smoking status, and ethnicity. B, Hazard ratio (HR) per 1-SD decrease in either vascular density (left) or FD (right). Labeled phenotypes across both plots have false discovery rate–corrected P<0.05. The x axis reflects an organized grouping of the phenotypes by phenotypic category and P value of association.
Figure 4.
Figure 4.
Genome-wide association studies and gene prioritization. A and B, Manhattan plots visualizing the genome-wide association results for retinal vascular fractal dimension (FD; A) and density (B), which identify 7 and 13 loci, respectively. Gene prioritization with the Polygenic Priority Score (PoPS) method. C and D, Prioritized genes at each locus (see locus-specific prioritizations in Figure S15). The locus-specific genes prioritized by PoPS at each locus are labeled in A and B. The x axes in C and D are arbitrary and reflect the ordered genes by PoPS score.
Figure 5.
Figure 5.
Pathway enrichment analysis. Pathway enrichment analyses of the retinal vascular fractal dimension (FD) and density genome-wide association study results were performed using the prioritized genes with Polygenic Priority Score z score >1 across the (A) Elsevier pathways and (B) Reactome pathways. Top Bonferroni-significant results are listed (A), along with the enrichment odds ratios (ORs) and the enrichment P values (B). Further details on genes included in each pathway and enrichment statistics are given in Tables S17 and S18.
Figure 6.
Figure 6.
One-sample mendelian randomization for DBP PRS, SBP PRS, and T2D PRS on retinal vascular density and FD. A, Association of the diastolic blood pressure (DBP), systolic blood pressure (SBP), and type 2 diabetes (T2D) polygenic risk score (PRS) with normalized retinal vascular density and fractal dimension (FD) in a linear regression model adjusted for age, age squared, sex, smoking status, and the first 10 principal components of genetic ancestry. B, Relationship of the SBP, DBP, and T2D PRSs with retinal vascular FD and density. Horizontal and vertical dotted lines reflect the average value for the respective axis. Shaded gray region reflects the 95% CI using a restricted maximum likelihood generalized additive model with integrated smoothness from the gam() function in R.
Figure 7.
Figure 7.
One-sample mendelian randomization for vascular FD PRS and density PRS on retinal detachment. A, Association of the vascular density PRS and fractal dimension (FD) polygenic risk score (PRS) with combined prevalent and incident retinal detachment. Original model includes the following covariates: age, age squared, sex, smoking status, and the first 10 principal components of genetic ancestry. +Myopia adjustment reflects additional adjustment for prevalent myopia at the time of image acquisition. B, Relationship of vascular density PRS and vascular FD PRS with fraction of individuals developing retinal detachments and defects during their lifetime. Horizontal and vertical dotted lines reflect the average value for the respective axis. Shaded gray region reflects the 95% CI using a restricted maximum likelihood binomial generalized additive model with integrated smoothness from the gam() function in R. OR indicates odds ratio.
Figure 8.
Figure 8.
Summary of key findings. Here, we successfully implemented deep learning toward image quality control and vessel segmentation to extract 2 features of the retina: vascular density and fractal dimension (FD). Through phenome-wide analyses, we identified significant associations between low vascular density and FD and higher risk of multiple systemic and ocular phenotypes, including ocular conditions influencing both the anterior and posterior segments. Genome-wide association analyses of these microvascular indices discovered multiple loci enriched among pathways related to vascular biology, inflammation, and neovascularization in cancer and may hypothesize potential drug targets for risk modification. Mendelian randomization analyses identified that higher genetic risk for hypertension and type 2 diabetes is associated with lower microvascular density and that higher genetic risk for lower microvascular density is associated with retinal detachment (independently of myopia) and with skin cancer (independently of genetic ancestry principal components, self-reported skin color, and self-reported sun exposure and sun sensitivity). More broadly, our results illustrate the potential for using deep learning on retinal imaging to understand the microvasculature, with wide applications across diseases. This image was made with Biorender. GWAS indicates genome-wide association study.

References

    1. Berry C, Sidik N, Pereira AC, Ford TJ, Touyz RM, Kaski JC, Hainsworth AH. Small-vessel disease in the heart and brain: current knowledge, unmet therapeutic need, and future directions. J Am Heart Assoc. 2019; 8:e011104. doi: 10.1161/JAHA.118.011104 - PMC - PubMed
    1. Patel H, Aggarwal NT, Rao A, Bryant E, Sanghani RM, Byrnes M, Kalra D, Dairaghi L, Braun L, Gabriel S, et al. . Microvascular disease and small-vessel disease: the nexus of multiple diseases of women. J Womens Health (Larchmt). 2020; 29:770–779. doi: 10.1089/jwh.2019.7826 - PMC - PubMed
    1. Taqueti VR, Di Carli MF. coronary microvascular disease pathogenic mechanisms and therapeutic options: JACC state-of-the-art review. J Am Coll Cardiol. 2018; 72:2625–2641. doi: 10.1016/j.jacc.2018.09.042 - PMC - PubMed
    1. Lesnik Oberstein SA, Jukema JW, Van Duinen SG, Macfarlane PW, van Houwelingen HC, Breuning MH, Ferrari MD, Haan J. Myocardial infarction in cerebral autosomal dominant arteriopathy with subcortical infarcts and leukoencephalopathy (CADASIL). Medicine (Baltimore). 2003; 82:251–256. doi: 10.1097/01.md.0000085054.63483.40 - PubMed
    1. Riverol M, Becker JT, López OL, Raji CA, Thompson PM, Carmichael OT, Gach HM, Longstreth WT, Jr, Fried L, Tracy RP, et al. . Relationship between systemic and cerebral vascular disease and brain structure integrity in normal elderly individuals. J Alzheimers Dis. 2015; 44:319–328. doi: 10.3233/JAD-141077 - PMC - PubMed

Publication types