

ECG-Based Deep Learning and Clinical Risk Factors to Predict Atrial Fibrillation
- PMID: 34743566
- PMCID: PMC8748400
- DOI: 10.1161/CIRCULATIONAHA.121.057480
ECG-Based Deep Learning and Clinical Risk Factors to Predict Atrial Fibrillation
Abstract
Background: Artificial intelligence (AI)-enabled analysis of 12-lead ECGs may facilitate efficient estimation of incident atrial fibrillation (AF) risk. However, it remains unclear whether AI provides meaningful and generalizable improvement in predictive accuracy beyond clinical risk factors for AF.
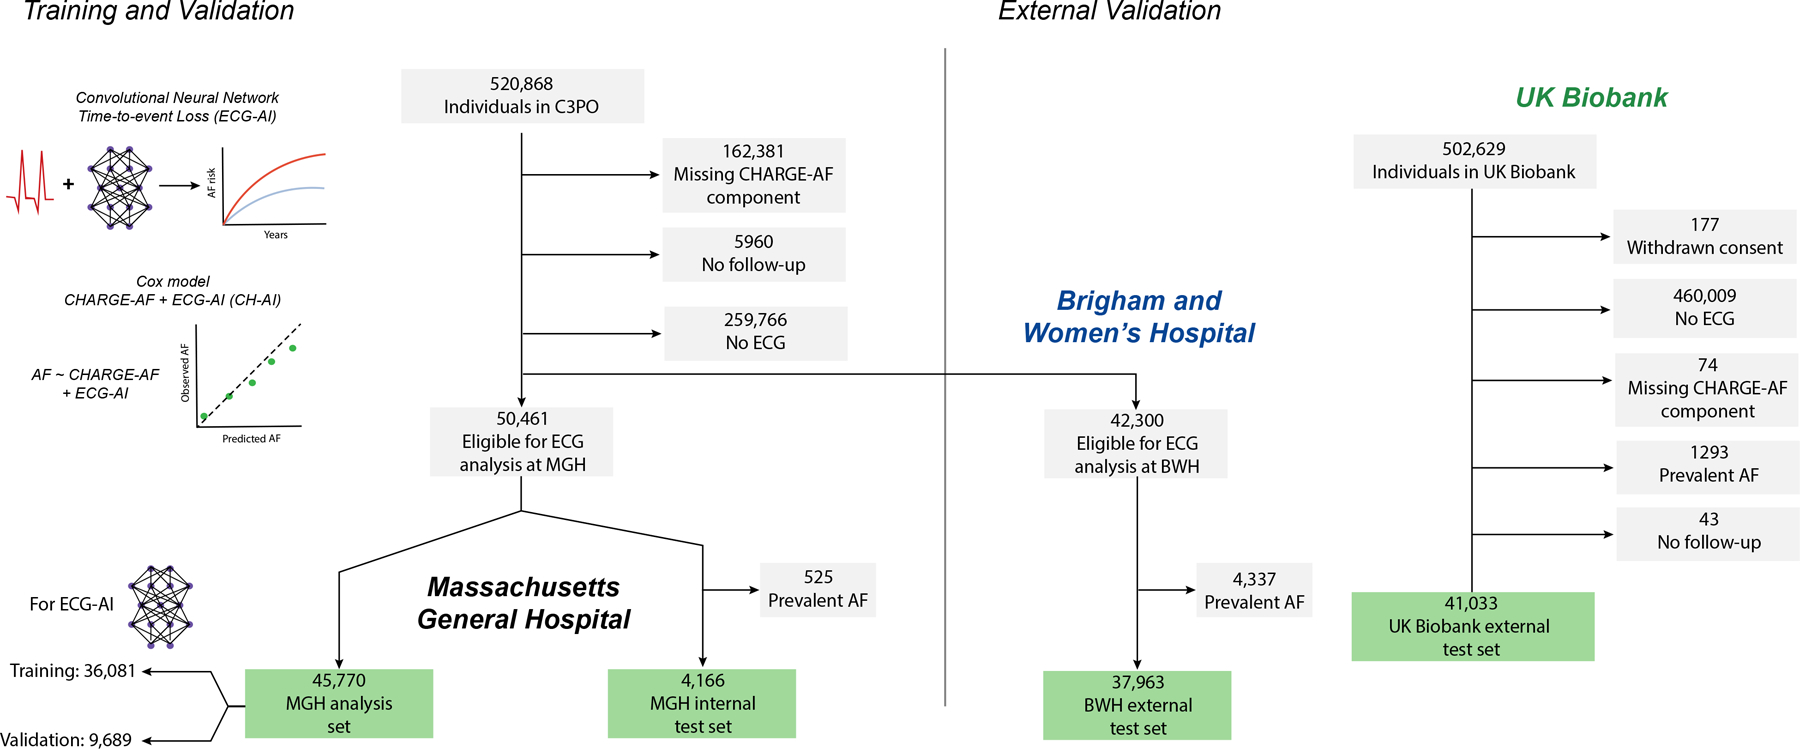
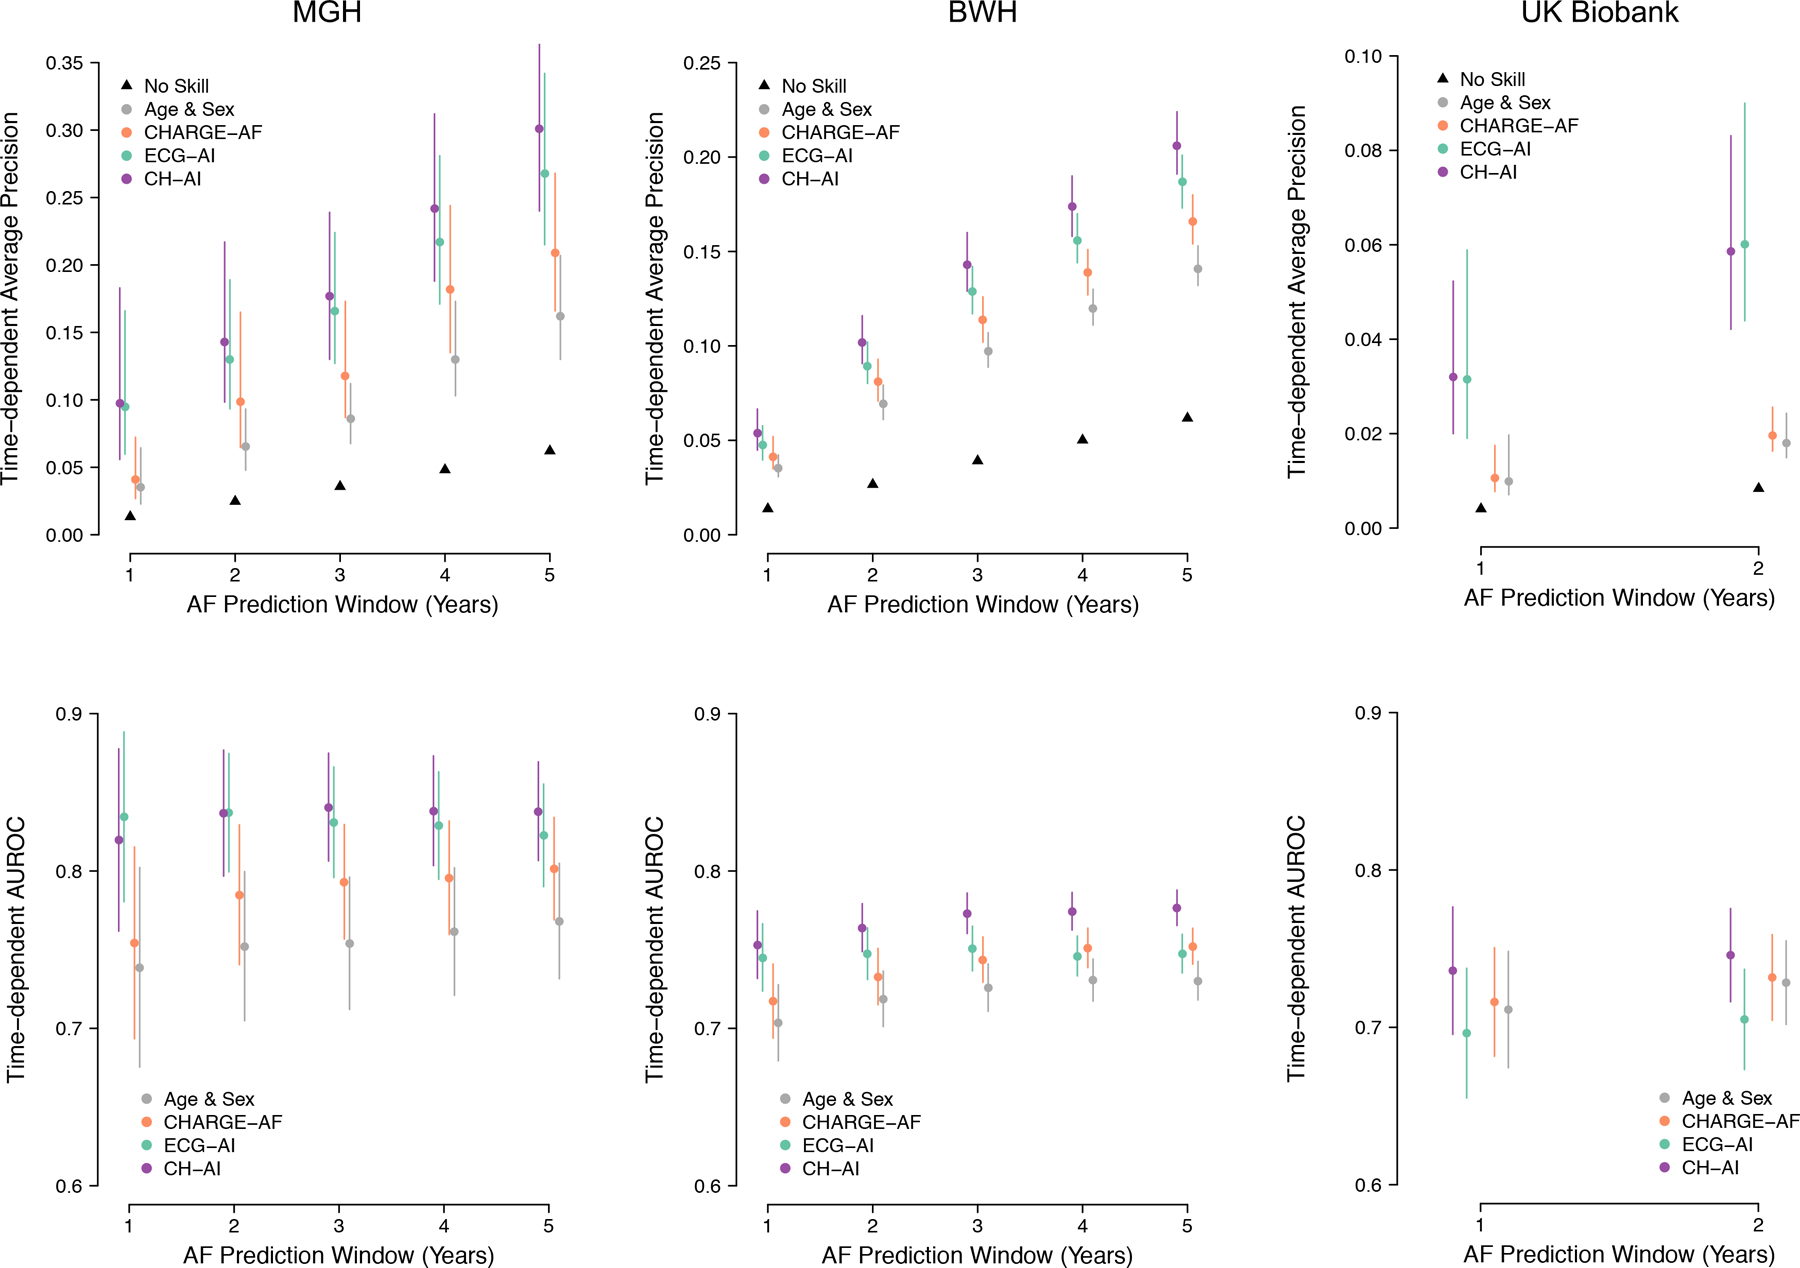
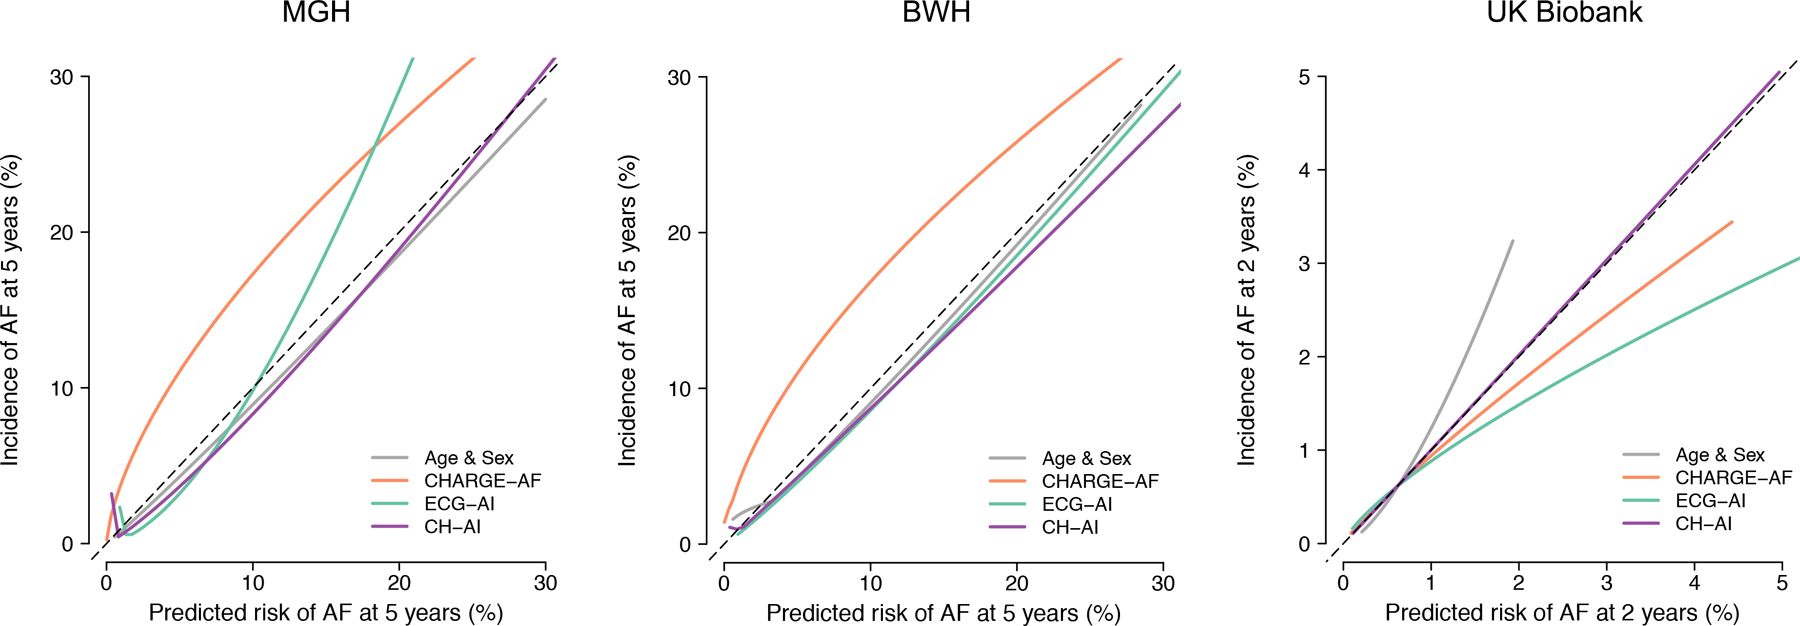
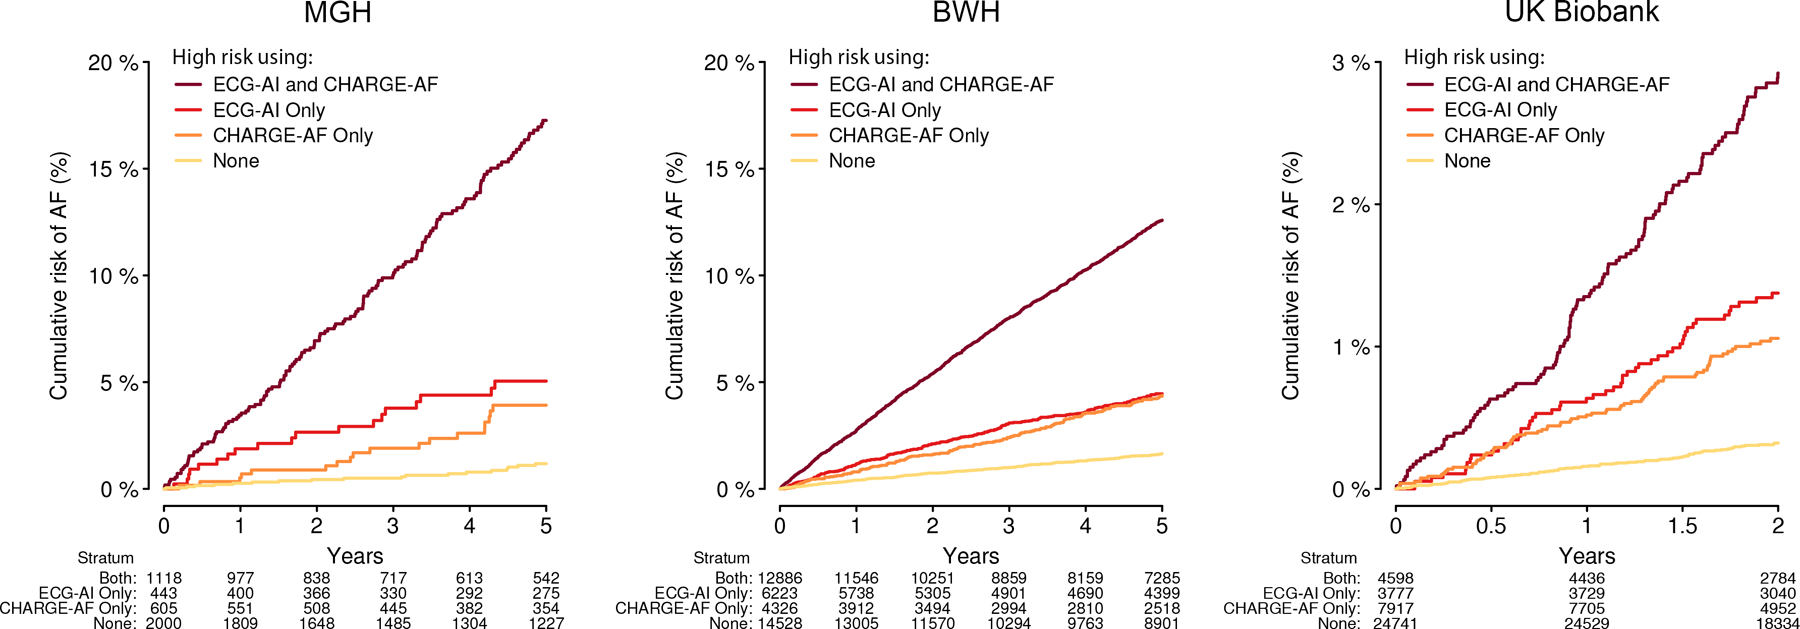
Methods: We trained a convolutional neural network (ECG-AI) to infer 5-year incident AF risk using 12-lead ECGs in patients receiving longitudinal primary care at Massachusetts General Hospital (MGH). We then fit 3 Cox proportional hazards models, composed of ECG-AI 5-year AF probability, CHARGE-AF clinical risk score (Cohorts for Heart and Aging in Genomic Epidemiology-Atrial Fibrillation), and terms for both ECG-AI and CHARGE-AF (CH-AI), respectively. We assessed model performance by calculating discrimination (area under the receiver operating characteristic curve) and calibration in an internal test set and 2 external test sets (Brigham and Women's Hospital [BWH] and UK Biobank). Models were recalibrated to estimate 2-year AF risk in the UK Biobank given limited available follow-up. We used saliency mapping to identify ECG features most influential on ECG-AI risk predictions and assessed correlation between ECG-AI and CHARGE-AF linear predictors.
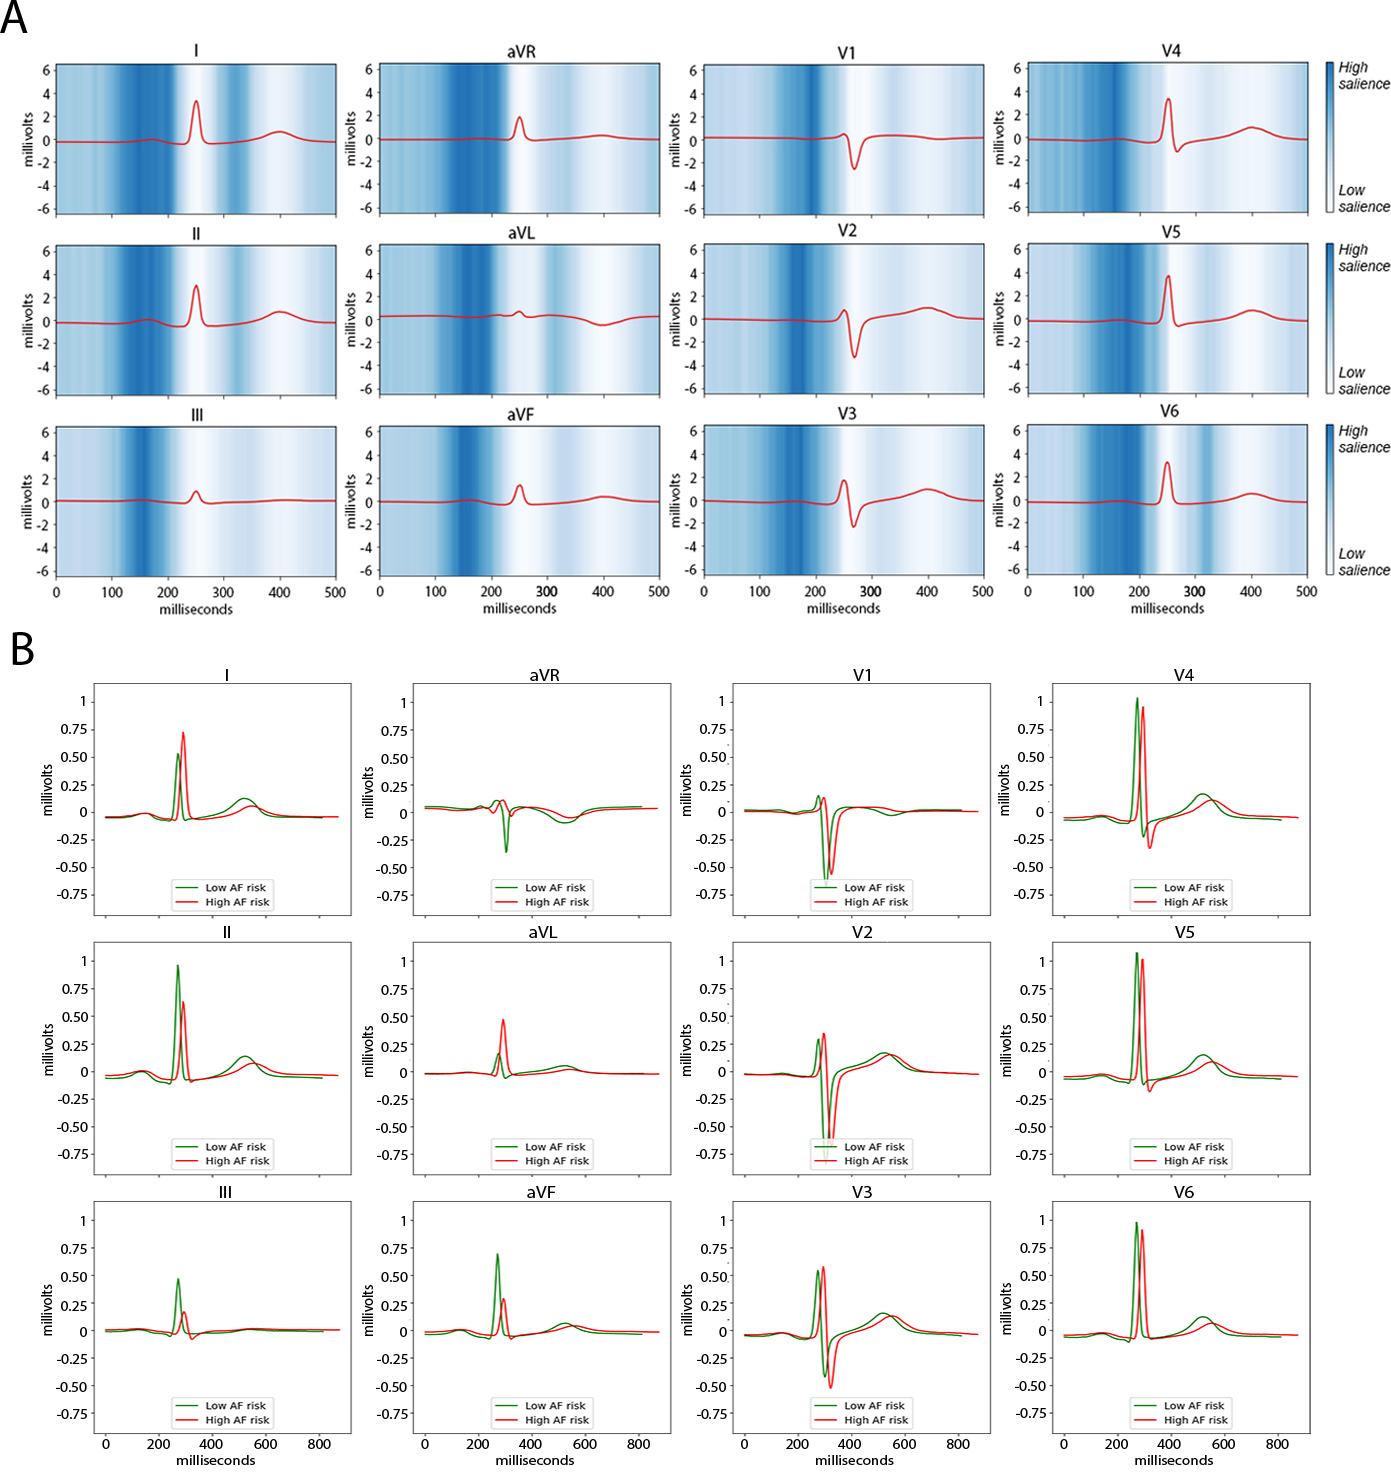
Results: The training set comprised 45 770 individuals (age 55±17 years, 53% women, 2171 AF events) and the test sets comprised 83 162 individuals (age 59±13 years, 56% women, 2424 AF events). Area under the receiver operating characteristic curve was comparable using CHARGE-AF (MGH, 0.802 [95% CI, 0.767-0.836]; BWH, 0.752 [95% CI, 0.741-0.763]; UK Biobank, 0.732 [95% CI, 0.704-0.759]) and ECG-AI (MGH, 0.823 [95% CI, 0.790-0.856]; BWH, 0.747 [95% CI, 0.736-0.759]; UK Biobank, 0.705 [95% CI, 0.673-0.737]). Area under the receiver operating characteristic curve was highest using CH-AI (MGH, 0.838 [95% CI, 0.807 to 0.869]; BWH, 0.777 [95% CI, 0.766 to 0.788]; UK Biobank, 0.746 [95% CI, 0.716 to 0.776]). Calibration error was low using ECG-AI (MGH, 0.0212; BWH, 0.0129; UK Biobank, 0.0035) and CH-AI (MGH, 0.012; BWH, 0.0108; UK Biobank, 0.0001). In saliency analyses, the ECG P-wave had the greatest influence on AI model predictions. ECG-AI and CHARGE-AF linear predictors were correlated (Pearson r: MGH, 0.61; BWH, 0.66; UK Biobank, 0.41).
Conclusions: AI-based analysis of 12-lead ECGs has similar predictive usefulness to a clinical risk factor model for incident AF and the approaches are complementary. ECG-AI may enable efficient quantification of future AF risk.
Keywords: atrial fibrillation; deep learning; electronic health records.
Figures
References
-
- Wolf PA, Abbott RD, Kannel WB. Atrial fibrillation: a major contributor to stroke in the elderly. The Framingham Study. Arch Intern Med. 1987;147:1561–1564. - PubMed
-
- Corley SD, Epstein AE, DiMarco JP, Domanski MJ, Geller N, Greene HL, Josephson RA, Kellen JC, Klein RC, Krahn AD, et al. Relationships between sinus rhythm, treatment, and survival in the Atrial Fibrillation Follow-Up Investigation of Rhythm Management (AFFIRM) Study. Circulation. 2004;109:1509–1513. - PubMed
-
- Carlisle MA, Fudim M, DeVore AD, Piccini JP. Heart Failure and Atrial Fibrillation, Like Fire and Fury. JACC Heart Fail. 2019;7:447–456. - PubMed
-
- Diener H-C, Hart RG, Koudstaal PJ, Lane DA, Lip GYH. Atrial Fibrillation and Cognitive Function: JACC Review Topic of the Week. J Am Coll Cardiol. 2019;73:612–619. - PubMed
-
- Voskoboinik A, Kalman JM, De Silva A, Nicholls T, Costello B, Nanayakkara S, Prabhu S, Stub D, Azzopardi S, Vizi D, et al. Alcohol Abstinence in Drinkers with Atrial Fibrillation. New England Journal of Medicine. 2020;382:20–28. - PubMed
Publication types
MeSH terms
Grants and funding
- T32 HL007208/HL/NHLBI NIH HHS/United States
- 18SFRN34250007/AHA/American Heart Association-American Stroke Association/United States
- CH/1996001/9454/BHF_/British Heart Foundation/United Kingdom
- R01 HL139731/HL/NHLBI NIH HHS/United States
- K24 HL105780/HL/NHLBI NIH HHS/United States
- R01 HL140224/HL/NHLBI NIH HHS/United States
- R01 HL092577/HL/NHLBI NIH HHS/United States
- MC_QA137853/MRC_/Medical Research Council/United Kingdom
- R01 HL157635/HL/NHLBI NIH HHS/United States
- MC_PC_17228/MRC_/Medical Research Council/United Kingdom
- K24 HL153669/HL/NHLBI NIH HHS/United States
- R01 HL134893/HL/NHLBI NIH HHS/United States
LinkOut - more resources
Full Text Sources
Other Literature Sources
Medical
