

Neurodegeneration Over 3 Years Following Ischaemic Stroke: Findings From the Cognition and Neocortical Volume After Stroke Study
- PMID: 34744989
- PMCID: PMC8570373
- DOI: 10.3389/fneur.2021.754204
Neurodegeneration Over 3 Years Following Ischaemic Stroke: Findings From the Cognition and Neocortical Volume After Stroke Study
Abstract
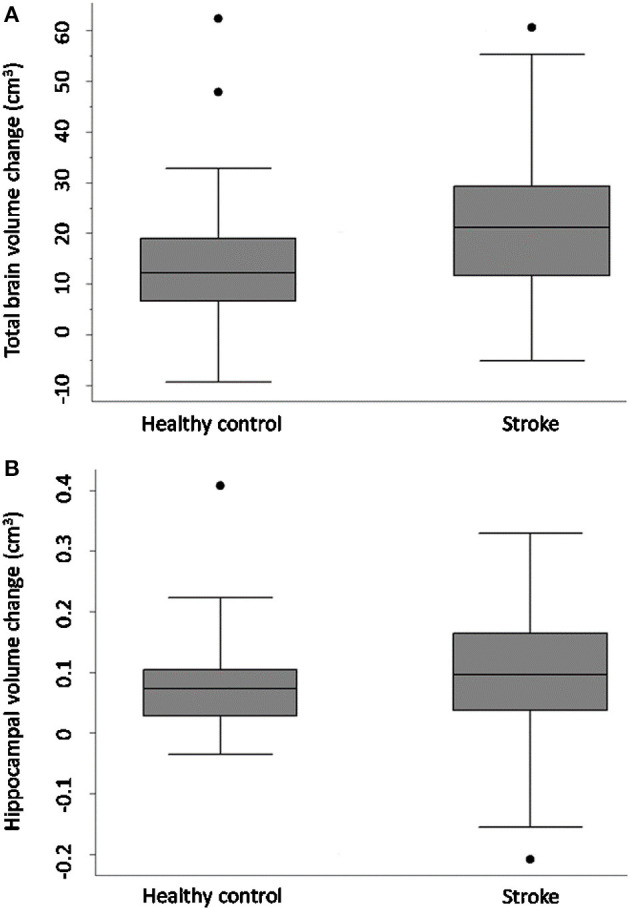
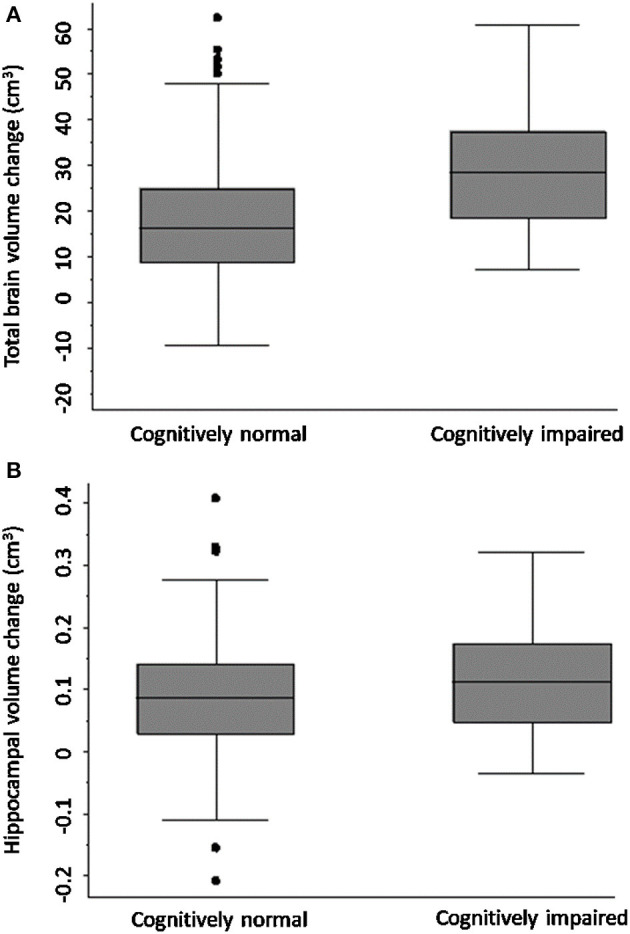
Background: Stroke survivors are at high risk of dementia, associated with increasing age and vascular burden and with pre-existing cognitive impairment, older age. Brain atrophy patterns are recognised as signatures of neurodegenerative conditions, but the natural history of brain atrophy after stroke remains poorly described. We sought to determine whether stroke survivors who were cognitively normal at time of stroke had greater total brain (TBV) and hippocampal volume (HV) loss over 3 years than controls. We examined whether stroke survivors who were cognitively impaired (CI) at 3 months following their stroke had greater brain volume loss than cognitively normal (CN) stroke participants over the next 3 years. Methods: Cognition And Neocortical Volume After Stroke (CANVAS) study is a multi-centre cohort study of first-ever or recurrent adult ischaemic stroke participants compared to age- and sex-matched community controls. Participants were followed with MRI and cognitive assessments over 3 years and were free of a history of cognitive impairment or decline at inclusion. Our primary outcome measure was TBV change between 3 months and 3 years; secondary outcomes were TBV and HV change comparing CI and CN participants. We investigated associations between group status and brain volume change using a baseline-volume adjusted linear regression model with robust standard error. Results: Ninety-three stroke (26 women, 66.7 ± 12 years) and 39 control participants (15 women, 68.7 ± 7 years) were available at 3 years. TBV loss in stroke patients was greater than controls: stroke mean (M) = 20.3 cm3 ± SD 14.8 cm3; controls M = 14.2 cm3 ± SD 13.2 cm3; [adjusted mean difference 7.88 95%CI (2.84, 12.91) p-value = 0.002]. TBV decline was greater in those stroke participants who were cognitively impaired (M = 30.7 cm3; SD = 14.2 cm3) at 3 months (M = 19.6 cm3; SD = 13.8 cm3); [adjusted mean difference 10.42; 95%CI (3.04, 17.80), p-value = 0.006]. No statistically significant differences in HV change were observed. Conclusions: Ischaemic stroke survivors exhibit greater neurodegeneration compared to stroke-free controls. Brain atrophy is greater in stroke participants who were cognitively impaired early after their stroke. Early cognitive impairment was associated greater subsequent atrophy, reflecting the combined impacts of stroke and vascular brain burden. Atrophy rates could serve as a useful biomarker for trials testing interventions to reduce post-stroke secondary neurodegeneration. Clinical Trail Registration: http://www.clinicaltrials.gov, identifier: NCT02205424.
Keywords: brain atrophy; cognitive impairment (CI); neurodegeneration; post-stroke cognition; stroke.
Copyright © 2021 Brodtmann, Werden, Khlif, Bird, Egorova, Veldsman, Pardoe, Jackson, Bradshaw, Darby, Cumming, Churilov and Donnan.
Conflict of interest statement
The authors declare that the research was conducted in the absence of any commercial or financial relationships that could be construed as a potential conflict of interest.
Figures
References
Associated data
LinkOut - more resources
Full Text Sources
Medical