. 2021 Oct 20:12:670338.
doi: 10.3389/fimmu.2021.670338. eCollection 2021.

Mitochondrial Fission Factor Is a Novel Interacting Protein of the Critical B Cell Survival Regulator TRAF3 in B Lymphocytes

Affiliations

Mitochondrial Fission Factor Is a Novel Interacting Protein of the Critical B Cell Survival Regulator TRAF3 in B Lymphocytes

Yingying Liu et al. Front Immunol. .

Abstract

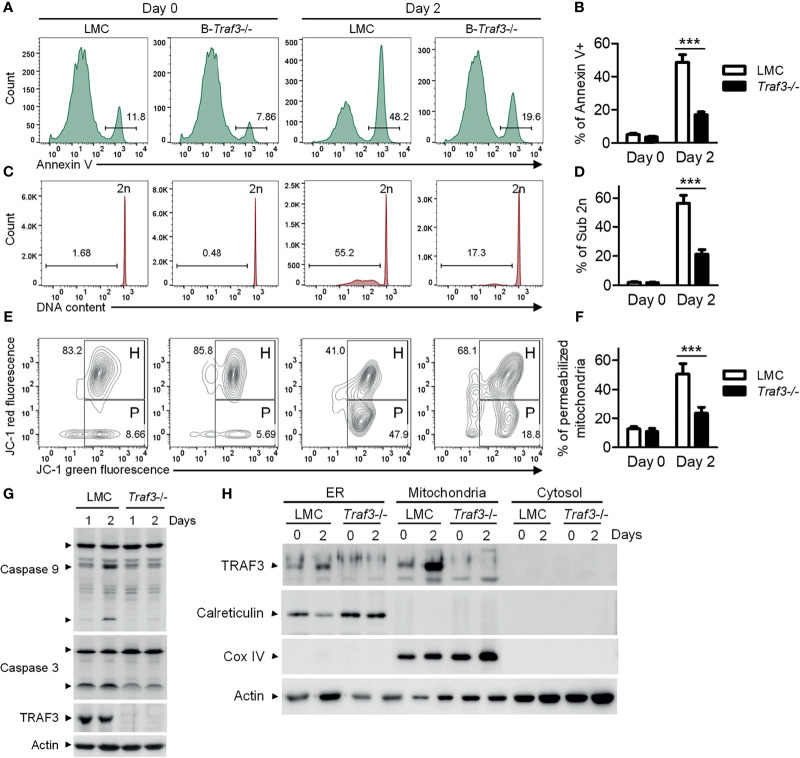
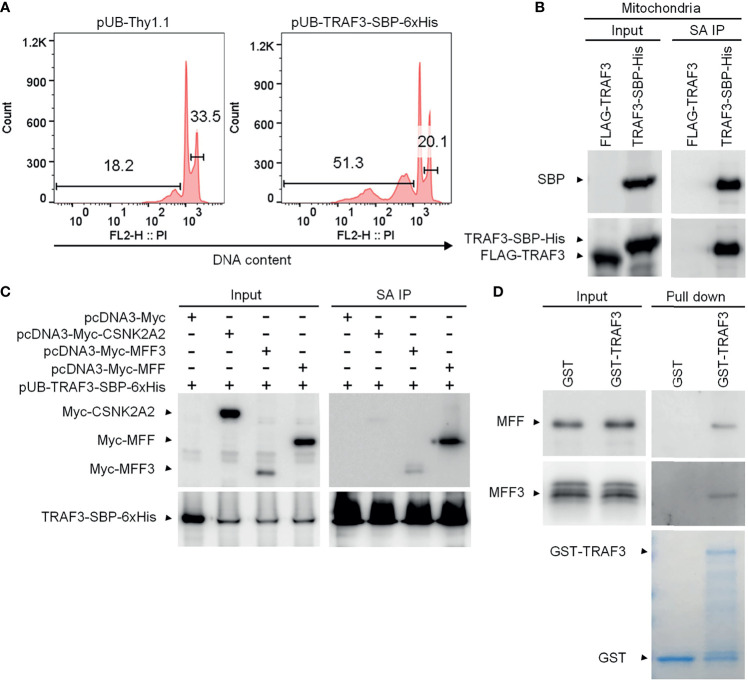
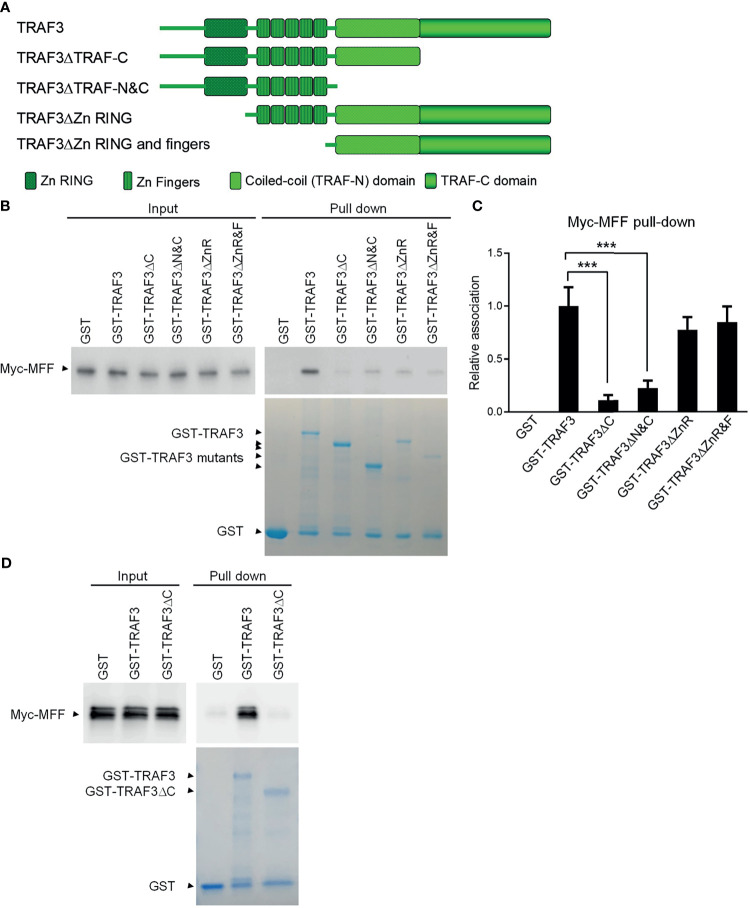
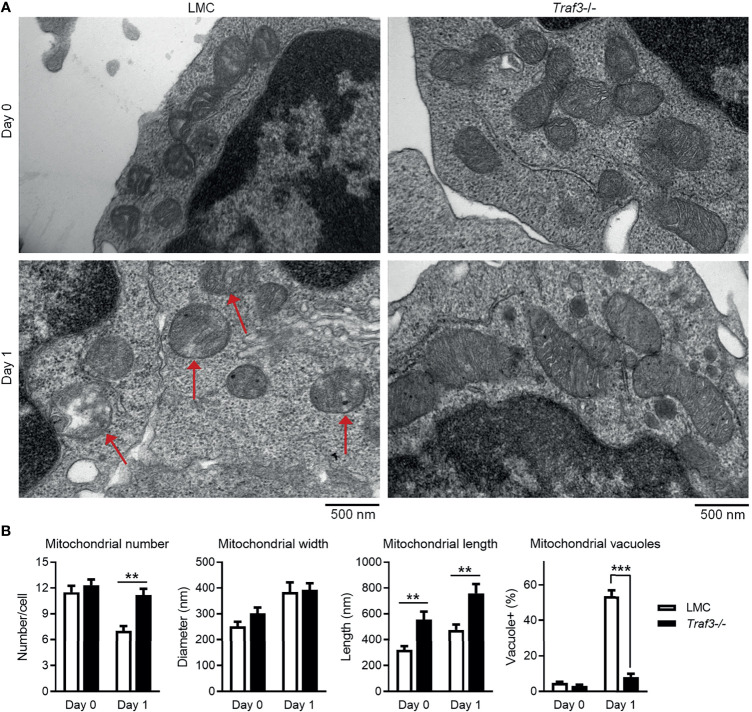
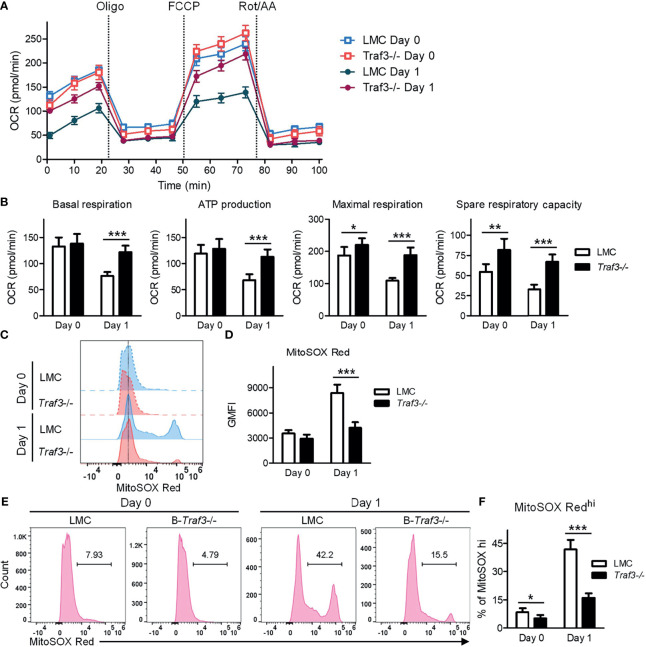
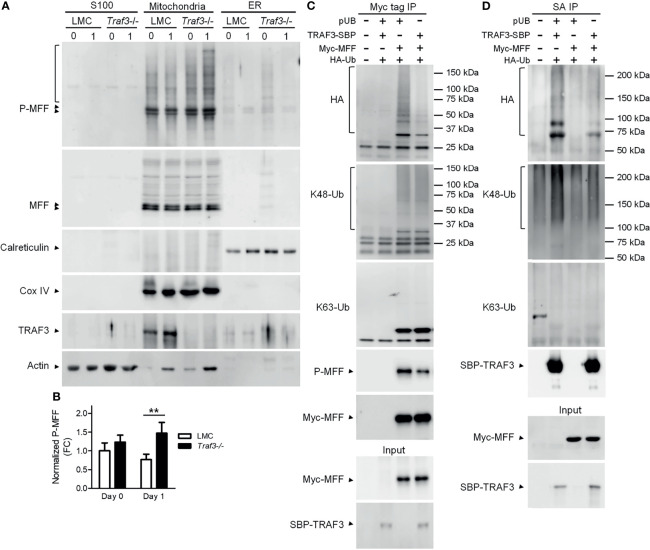
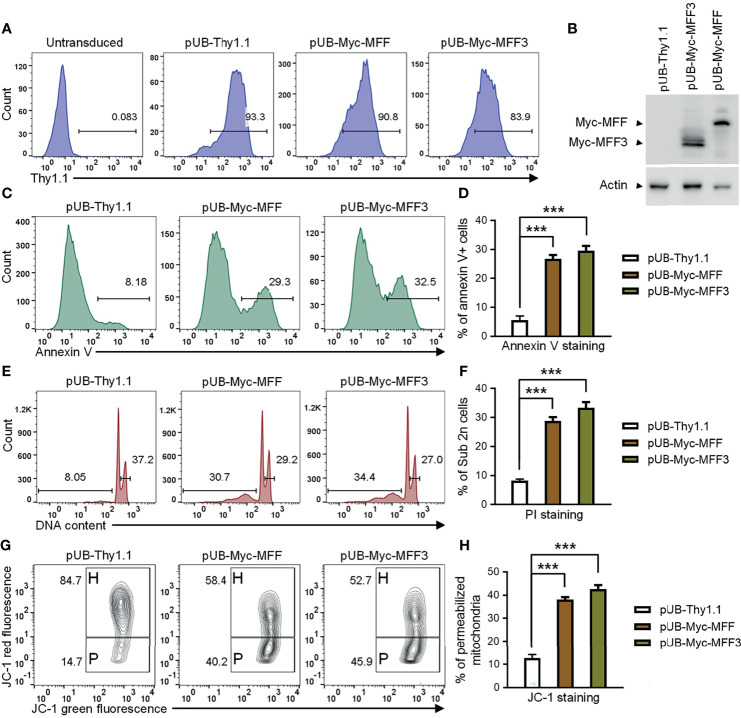
Proteins controlling mitochondrial fission have been recognized as essential regulators of mitochondrial functions, mitochondrial quality control and cell apoptosis. In the present study, we identified the critical B cell survival regulator TRAF3 as a novel binding partner of the key mitochondrial fission factor, MFF, in B lymphocytes. Elicited by our unexpected finding that the majority of cytoplasmic TRAF3 proteins were localized at the mitochondria in resting splenic B cells after ex vivo culture for 2 days, we found that TRAF3 specifically interacted with MFF as demonstrated by co-immunoprecipitation and GST pull-down assays. We further found that in the absence of stimulation, increased protein levels of mitochondrial TRAF3 were associated with altered mitochondrial morphology, decreased mitochondrial respiration, increased mitochondrial ROS production and membrane permeabilization, which eventually culminated in mitochondria-dependent apoptosis in resting B cells. Loss of TRAF3 had the opposite effects on the morphology and function of mitochondria as well as mitochondria-dependent apoptosis in resting B cells. Interestingly, co-expression of TRAF3 and MFF resulted in decreased phosphorylation and ubiquitination of MFF as well as decreased ubiquitination of TRAF3. Moreover, lentivirus-mediated overexpression of MFF restored mitochondria-dependent apoptosis in TRAF3-deficient malignant B cells. Taken together, our findings provide novel insights into the apoptosis-inducing mechanisms of TRAF3 in B cells: as a result of survival factor deprivation or under other types of stress, TRAF3 is mobilized to the mitochondria through its interaction with MFF, where it triggers mitochondria-dependent apoptosis. This new role of TRAF3 in controlling mitochondrial homeostasis might have key implications in TRAF3-mediated regulation of B cell transformation in different cellular contexts. Our findings also suggest that mitochondrial fission is an actionable therapeutic target in human B cell malignancies, including those with TRAF3 deletion or relevant mutations.

Keywords: B cell malignancies; B lymphocytes; MFF; TRAF3; apoptosis; mitochondria.


Conflict of interest statement

The authors declare that the research was conducted in the absence of any commercial or financial relationships that could be construed as a potential conflict of interest.

Figures

Figure 1
Figure 1
TRAF3 promoted the mitochondria-dependent intrinsic apoptotic pathway and was mainly localized at mitochondria in resting B cells. Splenic B cells were purified from gender-matched, young adult (8-12-week-old) naïve LMC or B-Traf3 -/- mice. Purified cells were analyzed directly (Day 0) or at day 2 after ex vivo culture in mouse B cell medium. (A) Representative FACS profiles of annexin V staining. Gated populations indicate the annexin V+ apoptotic cells. (B) Graphical results of the percentage of annexin V+ apoptotic cells. (C) Representative FACS profiles of cell cycle distribution analyzed by PI staining. Gated populations indicate apoptotic cells with DNA fragmentation (DNA content < 2n). (D) Graphical results of the percentage of apoptotic cells with DNA fragmentation. (E) Representative FACS profiles of mitochondrial membrane permeabilization measured by MitoProbe JC-1 staining. Gated populations in H show cells with healthy mitochondria and gated populations in P indicate cells with permeabilized mitochondria. (F) Graphical results of the percentage of cells with permeabilized mitochondria. (G) Cleavage of caspase 9 and caspase 3. Total cellular proteins were prepared at day 1 or day 2 after culture and immunoblotted for caspase 9 and caspase 3, followed by TRAF3 and actin. (H) Cytoplasmic TRAF3 proteins were mainly localized at mitochondria in resting B cells. ER, mitochondrial and S100 (cytosolic) proteins were biochemically fractionated and analyzed by immunoblotting. Proteins in each fraction were immunoblotted for TRAF3, calreticulin (an ER protein), COX IV (a mitochondrial protein) and actin. Immunoblots shown are representative of 3 experiments. Graphs shown in (B, D, F) are the mean ± SD (n=6/group, including 3 female and 3 male samples). ***p < 0.001 by t test.
Figure 2
Figure 2
MFF is a novel TRAF3-interacting protein. (A) Validation of the functionality of C-terminally SBP-6xHis-tagged TRAF3 in human MM 8226 cells. Reconstitution with the lentiviral expression vector pUB-TRAF3-SBP-6xHis induced apoptosis in 8226 cells as demonstrated by the cell cycle analysis. Cells transduced with an empty lentiviral vector (pUB-Thy1.1) were used as a control. Cell cycle analysis was performed by PI staining and FACS at day 7 post transduction. Gated populations indicate apoptotic cells with DNA fragmentation (DNA content < 2n) and proliferating cells (2n < DNA content ≤ 4n). (B) Large scale affinity purification of SBP-6xHis-tagged TRAF3 from isolated mitochondria of transduced 8226 cells. Cells were harvested at day 4 post transduction and were fractionated to isolate mitochondria. Mitochondrial proteins were immunoprecipitated with Streptavidin (SA)-Sepharose beads. Immunoprecipitates of TRAF3-SBP-6xHis (SA IP) from the mitochondrial proteins were analyzed by immunoblotting and used to identify TRAF3-interacting proteins by LC-MS/MS-based sequencing. Immunoblots of mitochondrial proteins before immunoprecipitation were used as the input control. Cells transduced with FLAG-TRAF3 were used as a negative control for SA IP. (C) Co-immunoprecipitation of MFF and MFF3 with TRAF3. 293T cells were co-transfected with pUB-TRAF3-SBP-6xHis and pcDNA3-Myc-MFF, pcDNA3-Myc-MFF3, pcDNA3-Myc-CSNK2A2 or an empty expression vector pcDNA3-Myc. Transfected cells were harvested at day 2 post transfection and total cellular proteins were immunoprecipitated with Streptavidin-Sepharose beads. Immunoprecipitates (SA IP) were immunoblotted for the Myc tag followed by the SBP tag. Bands of Myc-tagged proteins are indicated. (D) MFF and MFF3 pulled down by GST-TRAF3. Pre-cleared whole cell lysates of 293T cells transfected with pcDNA3-Myc-MFF or pcDNA3-Myc-MFF3 were subjected to the pull-down assay by GST alone or GST-TRAF3 fusion protein in the presence of Glutathione-Sepharose beads. GST and GST-TRAF3 used for pull-down were analyzed by SDS-PAGE and visualized by GelCode blue staining (the bottom panel). Lysates that were purified by the same pull-down procedures with GST were used as a negative control. Myc-tagged MFF and MFF3 in the input lysates and pull-down proteins were detected by immunoblotting (the top panel). Results shown are representative of at least 3 independent experiments.
Figure 3
Figure 3
Mapping of the structural domains of TRAF3 required for the interaction with MFF. (A) Schematic diagram of the TRAF3 deletion mutants generated in this study and used for the mapping experiments. Structural domains of TRAF3 that were deleted are depicted in the figure. (B) Interaction with MFF determined by the GST pull-down assay. Pre-cleared whole cell lysates of 293T cells transfected with pcDNA3-Myc-MFF were used in the pull-down experiments by GST alone or GST fusion proteins of WT or deletion mutants of TRAF3 in the presence of Glutathione-Sepharose beads. GST, GST-TRAF3 and GST-TRAF3 deletion mutants used for pull-down were analyzed by SDS-PAGE and visualized by GelCode blue staining (the bottom panel). GST-TRAF3 deletion mutants examined include GST-TRAF3ΔTRAF-C (ΔC), GST-TRAF3ΔTRAF-N&C(ΔN&C), GST-TRAF3ΔZn RING (ΔZnR), and GST-TRAF3ΔZn RING and fingers (ΔZnR&F). Lysates that were purified by the same pull-down procedures with GST alone were used as a negative control and those with GST-TRAF3 were used as the positive control. Myc-tagged MFF in the input lysates and pull-down proteins were detected by immunoblotting (the top panel). Results shown are representative of 3 experiments. (C) Graphical results of the relative association between Myc-MFF and GST fusion proteins of WT or deletion mutants of TRAF3. The Myc-MFF bands on the immunoblots and GST-TRAF3 or mutant bands on the GelCode Blue stained gels in (B) were quantitated using a low-light imaging system and the ImageJ Software, respectively. The amount of Myc-MFF in each pull-down lane was first normalized to the intensity of the corresponding input Myc-MFF band and further normalized to the intensity of the corresponding GST-TRAF3 or mutant band. Fold of change of the normalized Myc-MFF pull-down relative to that detected for GST-TRAF3 WT was shown in the graph (mean ± SD, n = 3). ***p < 0.001 by one-way ANOVA. (D) Direct interaction between TRAF3 and MFF determined by GST pull-down assay of in vitro translated proteins. Pre-cleared protein lysates of in vitro translated Myc-MFF were used in the pull-down experiments by GST alone, GST-TRAF3 or GST-TRAF3ΔC in the presence of Glutathione-Sepharose beads. Myc-tagged MFF in the input lysates and pull-down proteins were detected by immunoblotting (the top panel). GelCode blue staining of GST, GST-TRAF3 and GST-TRAF3ΔC used for pull-down was shown in the bottom panel. Results shown are representative of 3 experiments.
Figure 4
Figure 4
TRAF3 regulated the number and morphology of mitochondria in resting B cells. Splenic B cells were purified from gender-matched, young adult (8-12-week-old) naïve LMC or B-Traf3 -/- mice. Purified cells were analyzed directly (Day 0) or at day 1 after ex vivo culture. The number and morphology of mitochondria in cells were analyzed by electron microscopic (EM) examination. (A) Representative EM micrographs of resting B cells. Sick mitochondria are indicated with red arrows in the figure. (B) Graphical results of the number, width and length of mitochondria as well as the percentage of cells containing sick mitochondria (vacuole+) determined by EM examination. Graphs shown are the mean ± SD (n = 6/group; **p < 0.01; ***p < 0.001 by t test).
Figure 5
Figure 5
Regulation of mitochondrial function by TRAF3 in resting B cells. Splenic B cells were purified from gender-matched, young adult (8-12-week-old) naïve LMC or B-Traf3 -/- mice. Purified cells were analyzed directly (Day 0) or at day 1 after ex vivo culture. (A, B) Mitochondrial respiration and energy production determined by the Seahorse Cell Mito Stress Test. (A) Kinetic changes of the oxygen consumption rate (OCR). Injection time points of oligomycin (Oligo), FCCP and rotenone/antimycin A (Rot/AA) are indicated in the figure. (B) Graphical results of the OCRs for basal respiration, ATP production, maximal respiration and spare respiratory capacity. (C–F) Mitochondrial superoxide levels analyzed MitoSOX Red staining and flow cytometry. (C) Representative FACS histogram overlay comparing the levels of MitoSOX Red staining intensity. (D) Graphical results of the geometric mean (GM) of MitoSOX Red fluorescence intensity (FI). (E) Representative FACS profiles showing the gated MitoSOX Redhi populations. (F) Graphical results of the percentage of MitoSOX Redhi subsets. (B, D, F) Graphs shown are the mean ± SD (n = 6/group; *p < 0.05; **p < 0.01; ***p < 0.001 by t test).
Figure 6
Figure 6
The TRAF3-MFF interaction affected the modifications of MFF and TRAF3. (A, B) Phosphorylation of MFF in resting B cells. Splenic B cells were purified from gender-matched, young adult (8-12-week-old) naïve LMC or B-Traf3 -/- mice. Purified cells were analyzed directly (Day 0) or at day 1 after ex vivo culture. S100 (cytosolic), mitochondrial and ER proteins were biochemically fractionated and analyzed by immunoblotting. Proteins in each fraction were immunoblotted for phosphorylated MFF (P-MFF), total MFF, Calreticulin (an ER protein) and COX IV (a mitochondrial protein), followed by TRAF3 and actin. (B) Graphical results of the normalized P-MFF in the mitochondrial fraction. The phosphorylated and total MFF bands on the immunoblots in (A) were quantitated using a low-light imaging system. The intensity of P-MFF bands in each lane of the mitochondrial fraction was normalized to that of the corresponding total MFF bands. Fold of change of the normalized P-MFF relative to that detected for LMC B cells at Day 0 was shown in the graph (mean ± SD, n = 3). **p < 0.01 by t test. (C, D) Ubiquitination of MFF and TRAF3 was affected by the MFF-TRAF3 interaction in 293T cells. Cells were co-transfected with lentiviral expression vectors of HA-tagged ubiquitin (LPA-HA-Ub) and Myc-tagged MFF (pUB-Myc-MFF), SBP-tagged TRAF3 (pUB-TRAF3-SBP-6xHis) or an empty vector pUB-Thy1.1. Transfected cells were harvested at day 2 post transfection. Total cellular proteins were immunoprecipitated with Anti-c-Myc Tag (9E10) Affinity Gel (C) or Streptavidin-Sepharose beads (D). Immunoprecipitates [Myc tag IP in (C) or SA IP in (D)] were immunoblotted for the HA tag, K48-Ub and K63-Ub to detect the ubiquitination, K48- or K63-linked polyubiquitination of MFF (C) and TRAF3 (D), respectively. Phosphorylated MFF (P-MFF) was also analyzed in the Myc tag IP (C). Immunoblotting of Myc-MFF and SBP-TRAF3 was performed with both the immunoprecipitates and input lysates (bottom panels). Immunoblots shown are representative of 3 experiments.
Figure 7
Figure 7
Overexpression of MFF induced mitochondria-dependent apoptosis in human MM 8226 cells. Cells were transduced with individual lentiviral expression vector of MFF (pUB-Myc-MFF), MFF3 (pUB-Myc-MFF3), or an empty vector (pUB-Thy1.1). (A) Transduction efficiency of 8226 cells analyzed by Thy1.1 immunofluorescence staining and FACS. Cells were analyzed at day 3 post transduction. Gated population (Thy1.1+) indicates the cells that were successfully transduced with the lentiviral expression vector. (B) Ectopic overexpression of MFF and MFF3 in transduced 8226 cells. Total cellular proteins were prepared at day 4 post transduction, and then immunoblotted for the Myc tag, followed by actin. Bands of Myc-MFF and Myc-MFF3 are indicated in the figure. (C–H) Cell apoptosis, DNA fragmentation and mitochondrial membrane permeabilization were analyzed at day 6 post transduction. (C) Representative FACS profiles of annexin V staining. Gated populations indicate the annexin V+ apoptotic cells. (D) Graphical results of the percentage of annexin V+ apoptotic cells. (E) Representative FACS profiles of cell cycle analysis by PI staining. Gated populations indicate apoptotic cells with DNA fragmentation (DNA content < 2n) and proliferating cells (2n < DNA content ≤ 4n). (F) Graphical results of the percentage of apoptotic cells with DNA fragmentation. (G) Representative FACS profiles of mitochondrial membrane permeabilization measured by MitoProbe JC-1 staining. Gated populations in H show cells with healthy mitochondria and gated populations in P indicate cells with permeabilized mitochondria. (H) Graphical results of the percentage of cells with permeabilized mitochondria. (D, F, H) The graphs depict the results of 3 independent experiments with duplicate samples in each experiment (mean ± SD). ***p < 0.001 by one-way ANOVA.

References

    1. Morton LM, Wang SS, Devesa SS, Hartge P, Weisenburger DD, Linet MS. Lymphoma Incidence Patterns by WHO Subtype in the United States, 1992-2001. Blood (2006) 107:265–76. doi: 10.1182/blood-2005-06-2508 - DOI - PMC - PubMed
    1. Ruddon R. The Epidemiology of Human Cancer. In: Ruddon RW, editor. Cancer Biology, 4th ed. Oxford, England: Oxford University Press; (2007). p. 62–116.
    1. Horner MJ, Ries LAG, Krapcho M, Neyman N, Aminou R, Howlader N, et al. . Surveillance, Epidemiology, and End Results (SEER) Program. SEER Cancer Statistics Review, 1975-2006. Bethesda, MD: National Cancer Institute; (2008). Available at: www.seer.cancer.gov. (Nov 2008 Sub).
    1. Miao Y, Medeiros LJ, Xu-Monette ZY, Li J, Young KH. Dysregulation of Cell Survival in Diffuse Large B Cell Lymphoma: Mechanisms and Therapeutic Targets. Front Oncol (2019) 9:107. doi: 10.3389/fonc.2019.00107 - DOI - PMC - PubMed
    1. Adams CM, Clark-Garvey S, Porcu P, Eischen CM. Targeting the Bcl-2 Family in B Cell Lymphoma. Front Oncol (2018) 8:636. doi: 10.3389/fonc.2018.00636 - DOI - PMC - PubMed

Publication types