. 2020 Mar 2;11(13):3405-3417.
doi: 10.1039/d0sc00785d. eCollection 2020 Apr 7.

Type I photosensitizers based on phosphindole oxide for photodynamic therapy: apoptosis and autophagy induced by endoplasmic reticulum stress

Affiliations

Type I photosensitizers based on phosphindole oxide for photodynamic therapy: apoptosis and autophagy induced by endoplasmic reticulum stress

Zeyan Zhuang et al. Chem Sci. .

Abstract

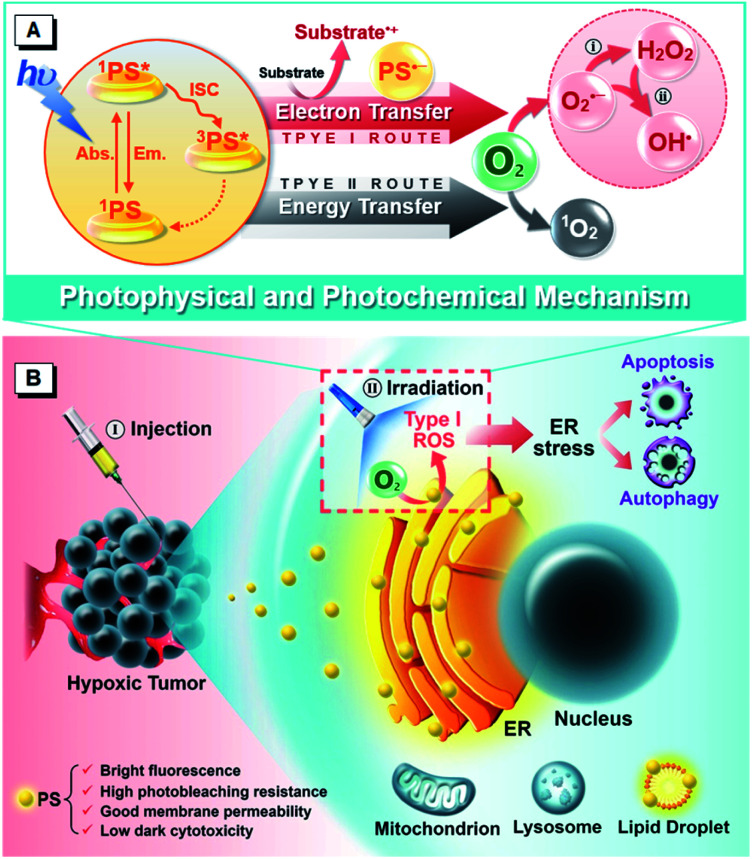
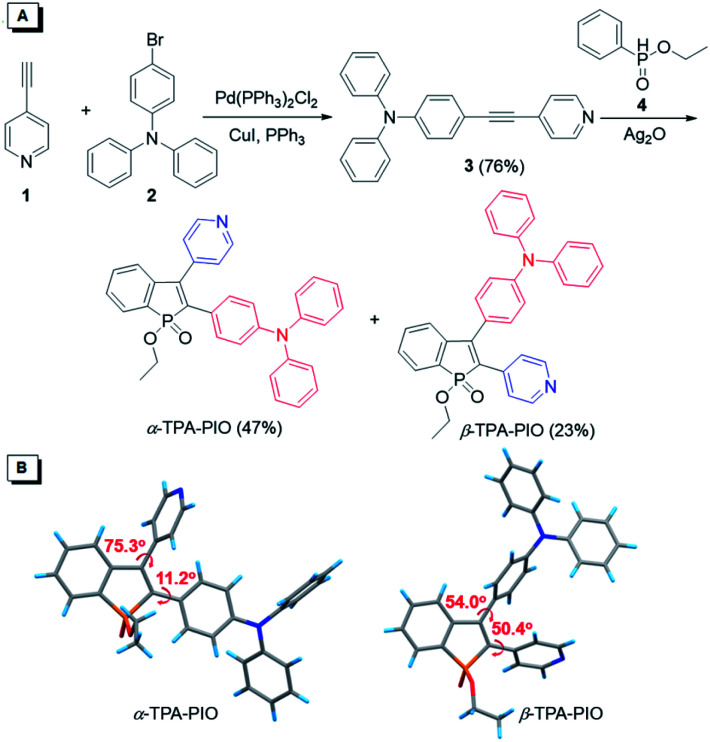
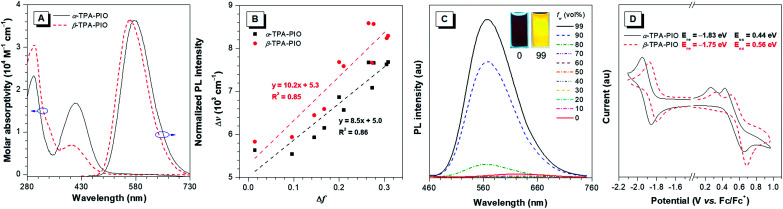
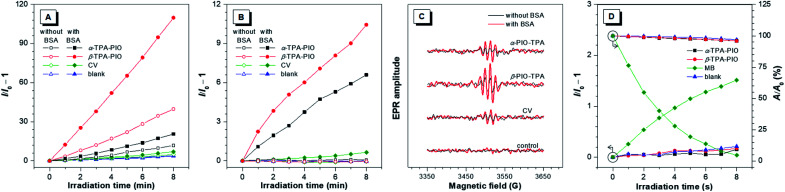
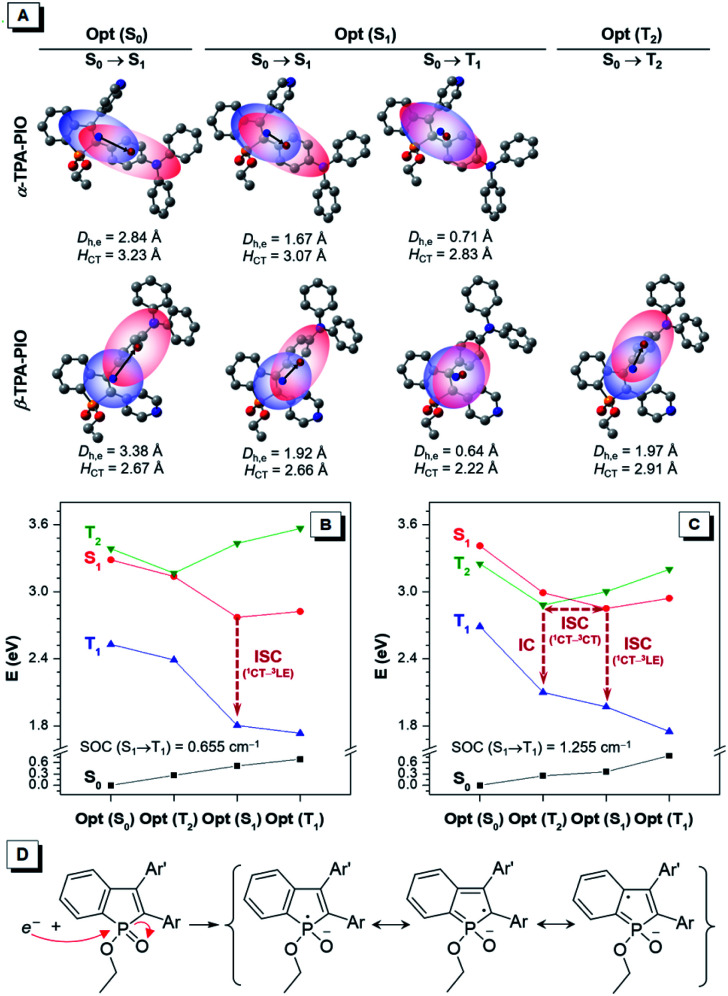
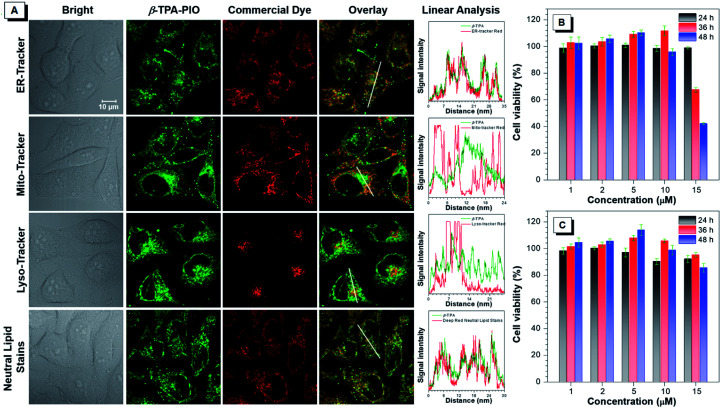
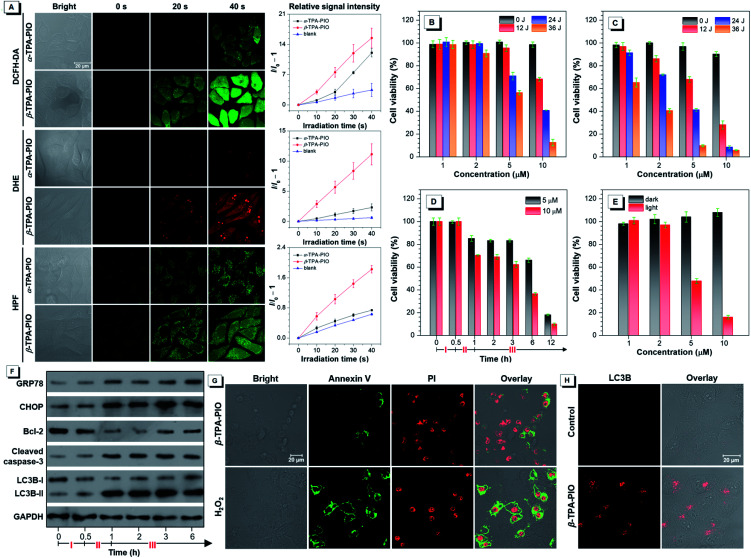
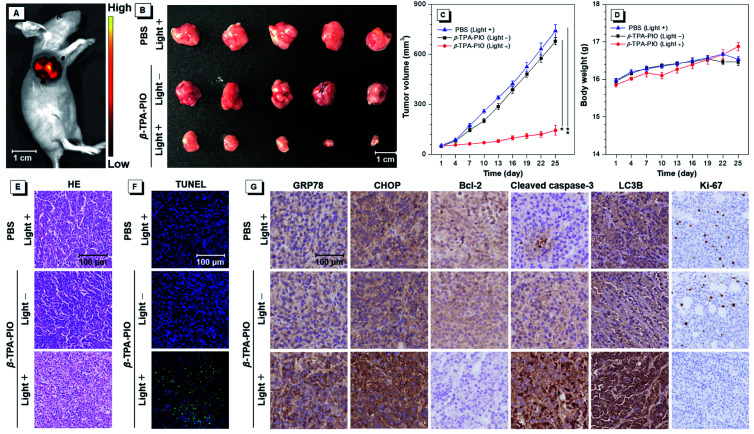
Photodynamic therapy (PDT) is considered a pioneering and effective modality for cancer treatment, but it is still facing challenges of hypoxic tumors. Recently, Type I PDT, as an effective strategy to address this issue, has drawn considerable attention. Few reports are available on the capability for Type I reactive oxygen species (ROS) generation of purely organic photosensitizers (PSs). Herein, we report two new Type I PSs, α-TPA-PIO and β-TPA-PIO, from phosphindole oxide-based isomers with efficient Type I ROS generation abilities. A detailed study on photophysical and photochemical mechanisms is conducted to shed light on the molecular design of PSs based on the Type I mechanism. The in vitro results demonstrate that these two PSs can selectively accumulate in a neutral lipid region, particularly in the endoplasmic reticulum (ER), of cells and efficiently induce ER-stress mediated apoptosis and autophagy in PDT. In vivo models indicate that β-TPA-PIO successfully achieves remarkable tumor ablation. The ROS-based ER stress triggered by β-TPA-PIO-mediated PDT has high potential as a precursor of the immunostimulatory effect for immunotherapy. This work presents a comprehensive protocol for Type I-based purely organic PSs and highlights the significance of considering the working mechanism in the design of PSs for the optimization of cancer treatment protocols.


Conflict of interest statement

There are no conflicts to declare.

Figures

Scheme 1
Scheme 1. Schematic illustration of (A) photophysical and photochemical mechanisms and (B) the cytological process of PDT treatment mediated by PIO-based fluorogens. (i) Disproportionation reaction; (ii) Haber–Weiss/Fenton reaction.
Fig. 1
Fig. 1. (A) Synthetic route and (B) crystal structures of α-TPA-PIO and β-TPA-PIO.
Fig. 2
Fig. 2. (A) Absorption spectra of α-TPA-PIO and β-TPA-PIO in DMSO and normalized PL spectra of α-TPA-PIO and β-TPA-PIO in PBS with 1 vol% DMSO excited at 415 nm and 400 nm, respectively (concentration: 10 μM). (B) Plots of the Stokes shift (Δν) of α-TPA-PIO and β-TPA-PIO in different solvents vs. the corresponding orientation polarizability (Δf) with the fitting lines (concentration: 10 μM). (C) PL spectra of β-TPA-PIO in DMSO/water mixtures with different fws, excited at 400 nm (concentration: 10 μM). Inset: Photos of solutions of β-TPA-PIO in DMSO/water mixtures (fw = 0 and 99 vol%) obtained under the illumination of a UV lamp (365 nm). (D) Cyclic voltammograms of α-TPA-PIO and β-TPA-PIO (concentration: 1 mM).
Fig. 3
Fig. 3. (A) Plots of relative PL intensity of DCFH (for general ROS detection) and (B) plots of relative PL intensity of HPF (for OH˙ detection) in the presence of 1 μM α-TPA-PIO, β-TPA-PIO or CV (without/with 500 nM BSA) in PBS with 1 vol% DMSO vs. irradiation time (white light, 20 mW cm−2). (C) EPR signals of BMPO (for Type I ROS detection) in the presence of 1 μM α-TPA-PIO, β-TPA-PIO or CV (without/with 500 nM BSA) in PBS with 1 vol% DMSO (white light, 100 mW cm−2). (D) Plots of relative PL intensity of SOSG and decomposition rates of ABDA (for 1O2 detection) in the presence of 1 μM α-TPA-PIO, β-TPA-PIO or MB in PBS with 1 vol% DMSO vs. irradiation time (white light, 20 mW cm−2). I0 and I are the PL intensities of the indicator before and after irradiation, respectively. A0 and A are the absorbances of ABDA before and after irradiation, respectively.
Fig. 4
Fig. 4. (A) Centroids of holes (red region) and electrons (blue region) of the corresponding transition at the optimized structures of α-TPA-PIO and β-TPA-PIO, with labels of the centers of holes (red point) and electrons (blue point) and two indexes, Dh,e and HCT. Calculated energy diagram at the optimized S0, S1, T1, and T2 state structures of (B) α-TPA-PIO and (C) β-TPA-PIO with labels of SOC values and the processes from excited singlets to triplets. (D) The proposed representative resonance structure of the PIO radical ions.
Fig. 5
Fig. 5. (A) Colocalization images of HeLa cells co-stained with β-TPA-PIO and ER-Tracker Red, Mito-Tracker Red, Lyso-Tracker Red or HCS LipidTOX™ Deep Red neutral lipid stain, with the intensity profile of synchrony for the white line. Cell viability after treatment with a range of concentrations of (B) α-TPA-PIO and (C) β-TPA-PIO for different time periods. Data are shown as mean ± SD (n = 6).
Fig. 6
Fig. 6. (A) General ROS, O2˙ and OH˙ generation of α-TPA or β-TPA in HeLa cells by using DCFH-DA, DHE and HPF as indicators, respectively, before and after exposure to 405 nm laser irradiation at 1% power with the plot of relative signal intensity of indicators against irradiation time. Data are shown as mean ± SD (n = 3). Cell viability after treatment with a range of concentrations and irradiation doses using (B) α-TPA-PIO or (C) β-TPA-PIO as the PS and white light irradiation of 20 mW cm−2 for 0, 10, 20 or 30 min. (D) Cell viability vs. time during the PDT treatment with β-TPA-PIO. (E) Viability of cells after treatment with a range of concentrations without or with white light irradiation of 20 mW cm−2 for 30 min under hypoxic conditions. Cell viability data are shown as mean ± SD (n = 6). (F) Western blot analysis of various protein expressions vs. time during PDT treatment with β-TPA-PIO. (G) Cell apoptosis analysis after treatment by PDT using 10 μM β-TPA-PIO as the PS (white light irradiation of 20 mW cm−2 for 30 min) and further culturing for 12 h or 880 μM H2O2 for 6 h, by staining with annexin V-Alexa Fluor™ 488 conjugate and PI as the indicator. (H) Immunofluorescence of HeLa cells after treatment with 10 μM β-TPA-PIO (white light irradiation of 20 mW cm−2 for 30 min) and further culturing for 2 h, using anti-LC3B antibody with an Alexa Fluor® 488-labeled secondary antibody as an autophagosome marker. Phase I: treatment with β-TPA-PIO in the dark for 30 min; Phase II: irradiation with white light of 20 mW cm−2 for 30 min; Phase III: further culturing in the dark.
Fig. 7
Fig. 7. (A) Image of a mouse after intratumoral injection of β-TPA-PIO for 24 h. (B) Representative tumor images. (C) Tumor volume and (D) body weight curve of mice during PDT treatment employing β-TPA-PIO as the PS and white light irradiation of 200 mW cm−2 for 15 min at different time points post-treatment in different groups: PBS (light +), β-TPA-PIO (light −) and β-TPA-PIO (light +) groups. Data are shown as mean ± SD (n = 5, *P < 0.05, β-TPA-PIO (light +) groups vs. PBS (light +) group, **P < 0.01, β-TPA-PIO (light +) groups vs. β-TPA-PIO (light −) groups, determined by Student's t test). (E) H&E staining, (F) TUNEL staining, and (G) IHC staining of the tumor sections from mice after treatment.

References

    1. Dolmans D. E. Fukumura D. Jain R. K. Nat. Rev. Cancer. 2003;3:380–386. doi: 10.1038/nrc1071. - DOI - PubMed
    1. Agostinis P. Berg K. Cengel K. A. Foster T. H. Girotti A. W. Gollnick S. O. Hahn S. M. Hamblin M. R. Juzeniene A. Kessel D. Korbelik M. Moan J. Mroz P. Nowis D. Piette J. Wilson B. C. Golab J. CA-Cancer J. Clin. 2011;61:250–281. doi: 10.3322/caac.20114. - DOI - PMC - PubMed
    1. Straten D. V. Mashayekhi V. Bruijn H. S. Oliveira S. Robinson D. J. Cancers. 2017;9:19. doi: 10.3390/cancers9020019. - DOI - PMC - PubMed
    1. Chapman J. D. Stobbe C. C. Arnfield M. R. Santus R. Lee J. McPhee M. S. Radiat. Res. 1991;126:73–79. doi: 10.2307/3578173. - DOI - PubMed
    1. Vaupel P. Mayer A. Cancer Metastasis Rev. 2007;26:225–239. doi: 10.1007/s10555-007-9055-1. - DOI - PubMed