. 2021 Jun 3;12(39):12959-12970.
doi: 10.1039/d1sc01734a. eCollection 2021 Oct 13.

The crystalline state as a dynamic system: IR microspectroscopy under electrochemical control for a [NiFe] hydrogenase

Affiliations

The crystalline state as a dynamic system: IR microspectroscopy under electrochemical control for a [NiFe] hydrogenase

Philip A Ash et al. Chem Sci. .

Abstract

Controlled formation of catalytically-relevant states within crystals of complex metalloenzymes represents a significant challenge to structure-function studies. Here we show how electrochemical control over single crystals of [NiFe] hydrogenase 1 (Hyd1) from Escherichia coli makes it possible to navigate through the full array of active site states previously observed in solution. Electrochemical control is combined with synchrotron infrared microspectroscopy, which enables us to measure high signal-to-noise IR spectra in situ from a small area of crystal. The output reports on active site speciation via the vibrational stretching band positions of the endogenous CO and CN- ligands at the hydrogenase active site. Variation of pH further demonstrates how equilibria between catalytically-relevant protonation states can be deliberately perturbed in the crystals, generating a map of electrochemical potential and pH conditions which lead to enrichment of specific states. Comparison of in crystallo redox titrations with measurements in solution or of electrode-immobilised Hyd1 confirms the integrity of the proton transfer and redox environment around the active site of the enzyme in crystals. Slowed proton-transfer equilibria in the hydrogenase in crystallo reveals transitions which are only usually observable by ultrafast methods in solution. This study therefore demonstrates the possibilities of electrochemical control over single metalloenzyme crystals in stabilising specific states for further study, and extends mechanistic understanding of proton transfer during the [NiFe] hydrogenase catalytic cycle.


Conflict of interest statement

There are no conflicts to declare.

Figures
Scheme 1
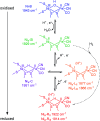
Scheme 1. Skeletal structure of the active site redox states for [NiFe] hydrogenases ordered by redox level. Dashed arrows represent the H2 binding and activation step during catalytic H2 oxidation. States are colour-coded to match data throughout this work. Catalytically active states are labelled “Nia–X”, where X = SI, C, L or R. νCO band positions refer to Hyd1, pH 5.9.
Fig. 1
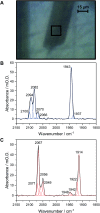
Fig. 1. (A) Visible image at 36× magnification of a single Hyd1 crystal on the working electrode of the IR microspectroscopic-electrochemical cell, showing the 15 × 15 μm2 sampling area used to collect IR spectra. (B) IR spectrum collected on a single crystal prepared from as-isolated Hyd1 at pH 5.9, equilibrated at open circuit potential (+209 mV), showing the νCO and νCN regions. (C) IR spectrum collected on a Hyd1 single crystal at pH 5.9 at an applied potential of −597 mV after reduction for 1 hour.
Fig. 2
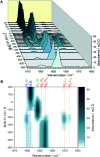
Fig. 2. The νCO region observed during electrochemical oxidative titration of a single crystal of Hyd1 at pH 5.9 recorded using the IR microspectroscopic-electrochemical technique showing the potential dependence of each active site redox species. (A) Baseline corrected IR spectra of νCO region. (B) Heatmap of νCO region.
Fig. 3
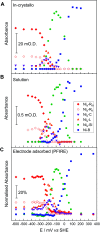
Fig. 3. Comparison of redox speciation curves (from oxidative titrations) of Hyd1 at pH 5.9 by three IR spectroscopic-electrochemical methods: single crystal IR microspectroscopic electrochemistry/in crystallo (A); in solution (B); and PFIRE/electrode adsorbed (C). The relative band positions in cm−1 for each species per methodology are provided in Table S2. For clarity the intensities arising from the Nia–LII and Nia–LIII species have been summed and are represented collectively as Nia–L here.
Fig. 4
Fig. 4. Electrochemical redox titration of a Hyd1 crystal at pH 8.0 recorded using the IR microspectroscopic electrochemical technique. (A) Baseline-corrected IR spectra showing the νCO region at selected potentials. Dotted lines show the wavenumber positions of the intrinsic νCO bands of the active site redox states of Hyd1. Wavenumber positions are given in Table S3. For IR spectra of the νCN and νCO regions across the full potential range of −600 to +200 mV see Fig. S10. (B) The speciation curves illustrate how the absorbance of the νCO peaks of Hyd1 active site species vary with potential at pH 8.0.
Fig. 5
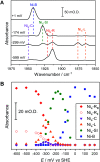
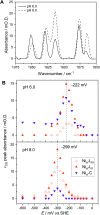
Fig. 5. The pH dependence of the Nia–C and Nia–L redox species. (A) Baseline-corrected IR spectra showing the νCO region of Hyd1 crystals, recorded at pH 8.0 (−299 mV) and pH 5.9 (−222 mV). (B) Speciation as a function of potential as measured by IR microspectroscopic-electrochemistry. The potential at which maximum νCO peak intensity for each species is observed is marked.
Fig. 6
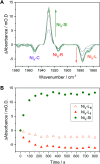
Fig. 6. Nia–L to Nia–SI transition in Hyd1 pH 5.9 crystals following a potential step from −197 mV to −172 mV vs. SHE. (A) Difference spectra following the potential step showing the increase in Nia–SI and decrease in Nia–L species over time. Any change in Nia–R and Nia–C is not apparent after the initial IR spectrum. (B) Time dependence of the change in Nia–SI and Nia–L species. Traces including other active site redox species are in the ESI, Fig. S18.

References

    1. Jeoung J. H. Dobbek H. J. Am. Chem. Soc. 2009;131:9922–9923. doi: 10.1021/ja9046476. - DOI - PubMed
    1. Sippel D. Rohde M. Netzer J. Trncik C. Gies J. Grunau K. Djurdjevic I. Decamps L. Andrade S. L. A. Einsle O. Science. 2018;359:1484–1489. doi: 10.1126/science.aar2765. - DOI - PubMed
    1. Hough M. A. Antonyuk S. V. Strange R. W. Eady R. R. Hasnain S. S. J. Mol. Biol. 2008;378:353–361. doi: 10.1016/j.jmb.2008.01.097. - DOI - PubMed
    1. Kachalova G. Decker K. Holt A. Bartunik H. D. Proc. Natl. Acad. Sci. U. S. A. 2011;108:4800–4805. doi: 10.1073/pnas.1016684108. - DOI - PMC - PubMed
    1. Beaton S. E. Evans R. M. Finney A. J. Lamont C. M. Armstrong F. A. Sargent F. Carr S. B. Biochem. J. 2018;475:1353–1370. doi: 10.1042/BCJ20180053. - DOI - PMC - PubMed