. 2021 Oct 20:11:755433.
doi: 10.3389/fonc.2021.755433. eCollection 2021.

Immunogenic Cell Death and Immunomodulatory Effects of Cabozantinib

Affiliations

Immunogenic Cell Death and Immunomodulatory Effects of Cabozantinib

Fabio Scirocchi et al. Front Oncol. .

Abstract

Cabozantinib (XL-184) is a multitarget tyrosine kinase inhibitor (TKI) targeting receptor tyrosine kinases (RTKs) involved in oncogenesis and angiogenesis. It is currently the standard therapy for medullary thyroid cancer (MTC), metastatic renal cell carcinoma (mRCC), and hepatocellular carcinoma (HCC). Combination of Cabozantinib with immunotherapy is now a standard treatment in metastatic renal cancer, and its efficacy is being tested in ongoing clinical trial in prostate cancer patients. Here, we report that Cabozantinib may exert an immunostimulatory role by inducing immunogenic stress of prostate cancer cells and directly modulating dendritic cells (DCs). Cabozantinib treatment arrested the cell cycle and triggered immunogenic cell death (ICD) in prostate cancer cells in vitro. Cabozantinib had a direct effect on DCs by the down-modulation of β-catenin and change in migratory and costimulatory phenotype of the DCs. These results may suggest possible immunomodulatory effects induced by Cabozantinib that could be exploited to optimize patient-tailored immunotherapeutic treatments.

Keywords: Cabozantinib; HMGB1; TKI (tyrosine kinase inhibitors); dendritic cell (DC); extracellular vesicle (EV); immunogenic cell death (ICD); immunotherapy; prostate cancer.


Conflict of interest statement

The authors declare that the research was conducted in the absence of any commercial or financial relationships that could be construed as a potential conflict of interest.

Figures

Figure 1
Figure 1
Effect of Cabozantinib on proliferation of DU-145 and PC-3 prostate tumor cells. (A) MTT proliferation assay of cells treated for 24 or 48 h with 2.5 and 5 μg/ml of Cabozantinib. Histograms represent the mean values of optical density (OD) 550 nm of three independent experiments (triplicate each condition) ± SEM. (B) Apoptosis of cells treated for 24 or 48 h with Cabozantinib (2.5 and 5 μg/ml). Histograms represent the mean values of percentage of apoptotic cells identified as Annexin positive of three independent experiments ± SEM. (C) Cell cycle analysis by propidium iodide (PI) staining analyzed by flow cytometry. One representative analysis out of three experiments is shown. The histograms represent the count of PI-positive cells found in untreated (NT) and Cabozantinib-treated (2.5 and 5 μg/ml) DU-145 and PC-3 cells as analyzed by FACS DIVA software. Gates allow the identification of phase G1, S, and G2 cell cycle. NT, untreated cells. *p < 0.05; **p < 0.01, Student’s t-test.
Figure 2
Figure 2
Extracellular release of HMGB1 and ATP following Cabozantinib treatment of DU-145 and PC-3 prostate cancer cell lines. (A) Western blot analysis of HMGB1 expression in cytosolic membrane fraction of untreated (NT) or Cabozantinib-treated (2.5 μg/ml) DU-145 cells. β-Tubulin was employed as internal reference standard. Bands intensity was measured by ImageJ software; histograms represent the ratio between HMGB1 (25–29 kDa) and β-tubulin (55 kDa) band intensities. (B) HMGB1 release upon Cabozantinib treatment. Histograms represent the ratio between the median values of HMGB1 released by treated cells (2.5 and 5 μg/ml) vs. values of HMGB1 released by untreated cells (NT). (C) Release of ATP induced by Cabozantinib. The ATP release was measured by ENLITEN-Promega KIT as luminescence signals. The histograms represent the mean value of ATP moles of two independent experiments in duplicate ± SEM. The line on histograms represents the NT (not treated) value. *p < 0.05; **p < 0.01; ***p < 0.001, Student’s t-test. NT, untreated cells as experimental control.
Figure 3
Figure 3
Flow cytometry analysis to evaluate Calreticulin (CRT) cell membrane expression in DU-145 and PC-3 prostate cancer cells treated with Cabozantinib (2.5 and 5 μg/ml) or 24 and 48 h. Dot plots show the analysis of cell population considering the 7-ADD vs. CRT staining (y- vs. x-axis, respectively). Histograms represent the ratio (T/NT) between the average of percentage of CRT+ cells in Cabozantinib-treated cells (2.5 and 5 μg/ml) vs. untreated cells ± SEM, evaluated in three independent experiments. *p < 0.05; **p < 0.01; ****p < 0.0001, Student’s t-test. NT, untreated cells as experimental control. ns, not significant.
Figure 4
Figure 4
The ICD markers HMGB1, CRT, and HSP70 are released as cargo of EVs shed by Cabozantinib-treated DU-145 cells. (A) Western Blot analysis of EV protein cargo (8 μg/sample) obtained from untreated (NT) or Cabozantinib-treated DU-145 (2.5 and 5 μg/ml for 48 h, respectively, 2.5CB and 5CB). As internal control, DU-145 total cell lysates (30 μg/sample) were used. Loading control was performed by Ponceau staining. The histograms represent densiometric evaluation reporting the ratio of band intensity of the sample lane vs. Ponceau lane. (B) Uptake by DCs of antigens released by untreated and Cabozantinib-treated DU-145. DU-145 cells (treated or untreated) were labeled with CSFE, and DCs were incubated with cell culture supernatants. Transfer of CSFE+ antigen to DCs was evaluated by flow cytometry. The negative control is the autofluorescence of DC exposed to DU-145 culture supernatant (gray histograms); the dark histograms represent the fluorescence signals derived from DCs exposed to culture supernatant of CSFE labelled DU-145. Fold increase values are the ratio between the mean fluorescence intensity (MIF) of DCs exposed to CSFE+DU-145 cell supernatant and DCs control.
Figure 5
Figure 5
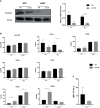
Effect of Cabozantinib on DCs. (A) Modulation of β-catenin in DCs upon Cabozantinib treatment. Western blot analysis in iDCs and mDCs, untreated (NT) or treated with 2.5 μg/ml of Cabozantinib (2.5 CB) to detect β-catenin protein (92 kDa). β-Actin (43kDa) was employed as internal reference standard. Band intensity was measured by ImageJ software. Histograms represent normalization of the intensity values obtained as ratio between the sample value and the control. (B) The histograms represent the average of MFI values of DC phenotypic markers from healthy donor. The monocytes after 4 days of differentiation were treated with Cabozantinib (2.5 μg/ml), and at day 5, iDCs were collected and matured with cytokine cocktail (rhIL1β, IL6, TNFα, and PGE2). The concentration of Cabozantinib used for the culture corresponds to serum levels achieved in TKI-treated patients. The histograms correspond to the average of MFI values among six healthy donors ± SEM. (C) Uptake of the fluorescein isothiocyanate (FITC)-dextran by iDCs cultured in presence or absence of Cabozantinib. Results are reported as ratio between the mean fluorescence intensity (MFI) obtained incubating the cells with FITC-dextran for 1 h at 37°C and 4°C. *p < 0.05; **p < 0.01, Student’s t-test.

References

    1. Hanahan D, Weinberg RA. Hallmarks of Cancer: The Next Generation. Cell (2011) 144:646–74. doi: 10.1016/j.cell.2011.02.013 - DOI - PubMed
    1. Kumari S, Advani D, Sharma S, Ambasta RK, Kumar P. Combinatorial Therapy in Tumor Microenvironment: Where do We Stand? Biochim Biophys Acta Rev Cancer (2021) 1876:188585. doi: 10.1016/j.bbcan.2021.188585 - DOI - PubMed
    1. Yamaoka T, Kusumoto S, Ando K, Ohba M, Ohmori T. Receptor Tyrosine Kinase-Targeted Cancer Therapy. Int J Mol Sci (2018) 19:1–35. doi: 10.3390/ijms19113491 - DOI - PMC - PubMed
    1. Ocaña-Guzman R, Vázquez-Bolaños L, Sada-Ovalle I. Receptors That Inhibit Macrophage Activation: Mechanisms and Signals of Regulation and Tolerance. J Immunol Res (2018) 2018:8695157. doi: 10.1155/2018/8695157 - DOI - PMC - PubMed
    1. Pottier C, Fresnais M, Gilon M, Jérusalem G, Longuespée R, Sounni NE. Tyrosine Kinase Inhibitors in Cancer: Breakthrough and Challenges of Targeted Therapy. Cancers (Basel) (2020) 12:731. doi: 10.3390/cancers12030731 - DOI - PMC - PubMed

LinkOut - more resources