. 2021 Oct 22:16:100949.
doi: 10.1016/j.ssmph.2021.100949. eCollection 2021 Dec.

The increasing cost of happiness

Affiliations

The increasing cost of happiness

R W Morris et al. SSM Popul Health. .

Abstract

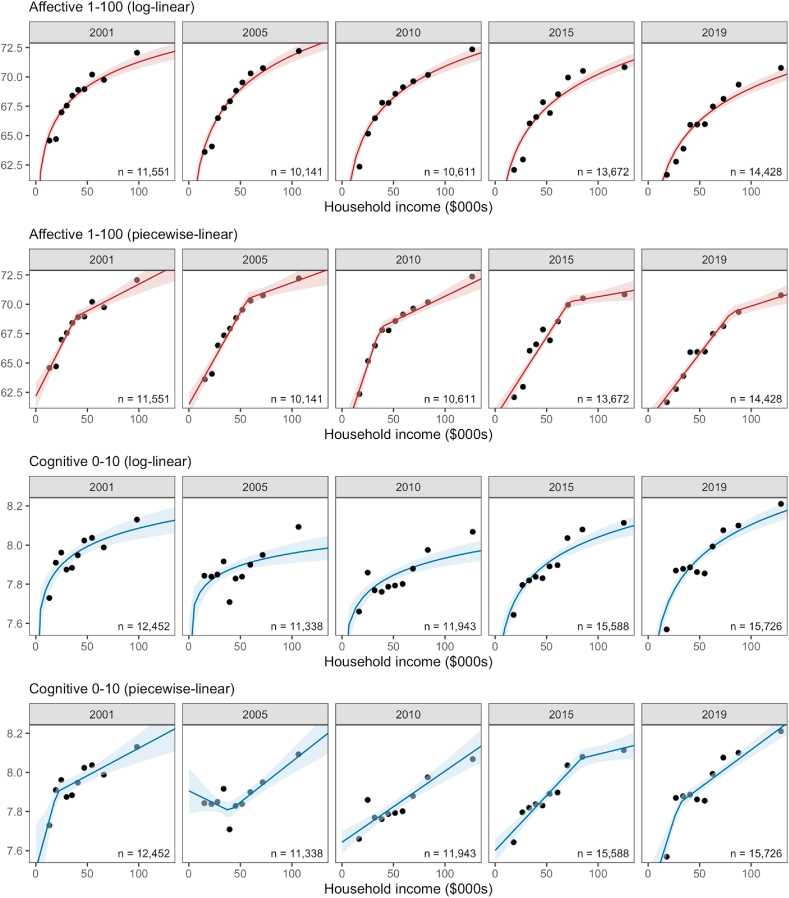
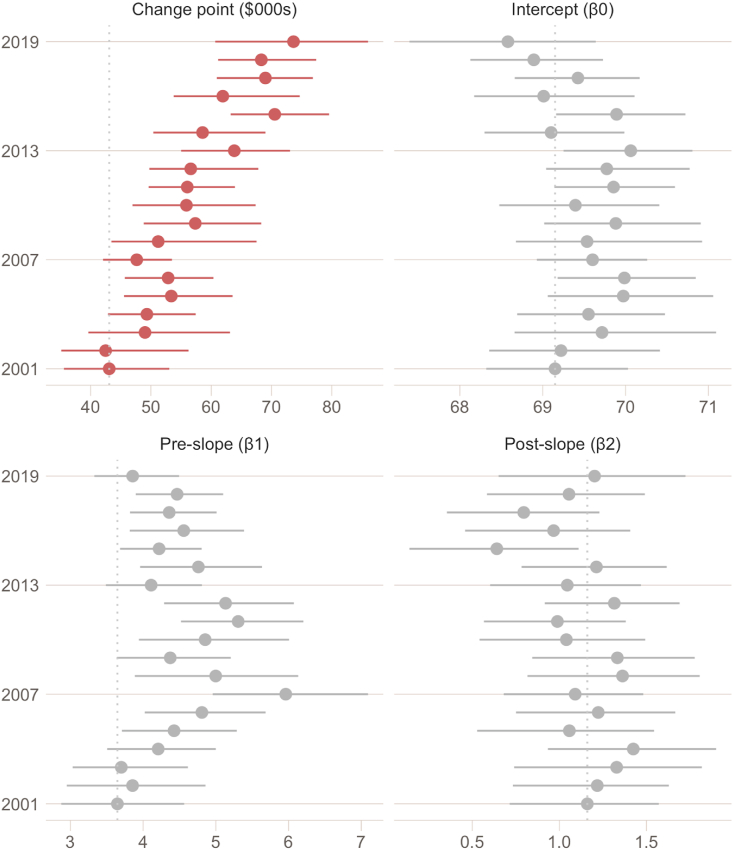
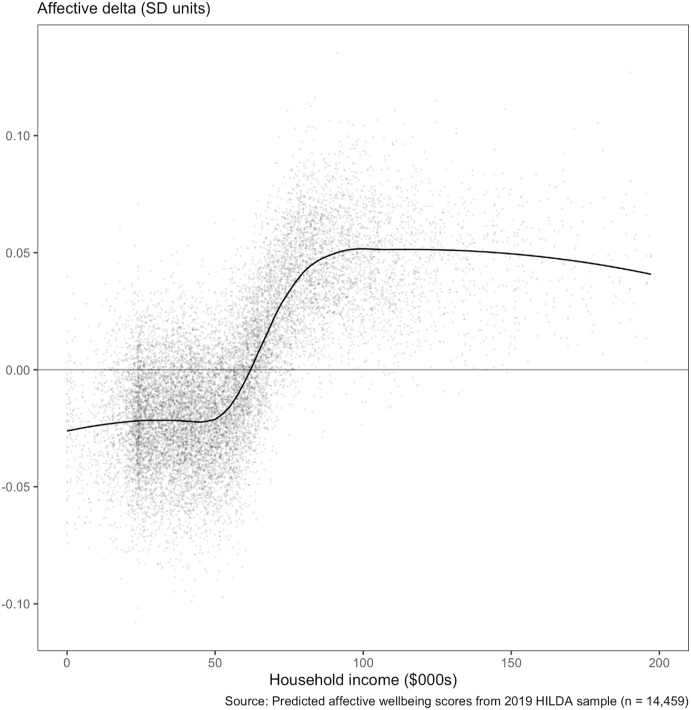
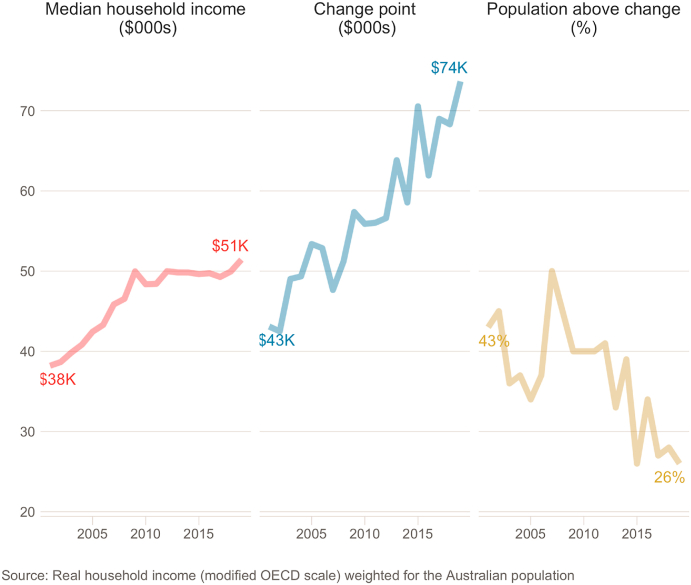
A fundamental question for society is how much happiness does a dollar buy? The accepted view among economists and psychologists is that income has diminishing marginal returns on happiness: money and happiness increase together up to a point after which there is relatively little further gain. In this paper we estimate the relationship between income and subjective wellbeing over a 19-year period focusing on where the greatest change in the marginal return on income occurs and whether this change point has shifted over time. We formally test for the presence of a change point as well as temporal changes in the relationship between income and affective wellbeing (happiness), and income and cognitive wellbeing (life satisfaction), using household economic data from Australia between 2001 and 2019. The results indicate that the change point between affective wellbeing and income has increased over those 19 years faster than inflation (i.e., cost of living). This suggests that inequalities in income may be driving increasing inequities in happiness between the rich and the poor, with implications for health and recent government policy-goals to monitor and improve wellbeing.

Keywords: HILDA; Household income; Subjective wellbeing.


Conflict of interest statement

None.

Figures

Fig. 1
Fig. 1
Association Between Household Income and Affective- (red) and Cognitive- (blue) Wellbeing from 5-years 2001–2019. The relationship between income and wellbeing across equal-sized income deciles, overlaid by regression lines from log-linear and piecewise-linear models (±95%CI). Wellbeing was measured as affective- (red) or cognitive- (blue) wellbeing. The total number of individuals contributing to each regression in each year are noted (n). . (For interpretation of the references to colour in this figure legend, the reader is referred to the Web version of this article.)
Fig. 2
Fig. 2
Posterior parameters of the affective-wellbeing ∼ income piecewise-linear model (real 2019 dollars). Posterior distributions of the change point parameter representing the location in real household income (real 2019 dollars), as well as the intercept, pre-slope and post-slope parameters in happiness units (0–100). Horizontal bar represents the 95% credible region and the solid point indicates the expected value (median) of each distribution. Vertical dotted line indicates the 2001 expected value (median) as a base year comparison.
Fig. 3
Fig. 3
Counterfactual difference in affective wellbeing between 2019 and 2001 for a given level of income. The difference (Δ) in predicted affective wellbeing between 2019 and 2001 for the same n = 14,459 individuals. Values below zero on the y-axis indicate lower affective wellbeing predictions using the 2019 model compared to using the 2001 model. The smoothed overlay (solid line) indicates how the average affective wellbeing changes across the income distribution.
Fig. 4
Fig. 4
Rise in median income, change point, and population in Australia 2001–2019. Real household income has stagnated in Australia since 2009 (post GFC) while the change point between affective wellbeing and income has increased.

References

    1. Apc . Australian Productivity Commission (APC) Research Paper; Canberra: 2018. Rising inequality? A stocktake of the evidence.
    1. Bürkner P.-C. brms: An R package for Bayesian multilevel models using Stan. Journal of Statistical Software. 2017;80:1–28. doi: 10.18637/jss.v080.i01. - DOI
    1. Butterworth P., Crosier T. The validity of the sf-36 in an australian national household survey: Demonstrating the applicability of the household income and labour dynamics in Australia (hilda) survey to examination of health inequalities. BMC Public Health. 2004;4:1–11. - PMC - PubMed
    1. Clark A.E. Four decades of the economics of happiness: Where next? Review of Income and Wealth. 2018;64:245–269.
    1. Clark A.E., Frijters P., Shields M.A. Relative income, happiness, and utility: An explanation for the easterlin paradox and other puzzles. Journal of Economic Literature. 2008;46:95–144.

LinkOut - more resources