. 2021 Oct 12;24(11):103221.
doi: 10.1016/j.isci.2021.103221. eCollection 2021 Nov 19.

An integrated multi-omic analysis of iPSC-derived motor neurons from C9ORF72 ALS patients

Collaborators, Affiliations

An integrated multi-omic analysis of iPSC-derived motor neurons from C9ORF72 ALS patients

NeuroLINCS Consortium et al. iScience. .

Abstract

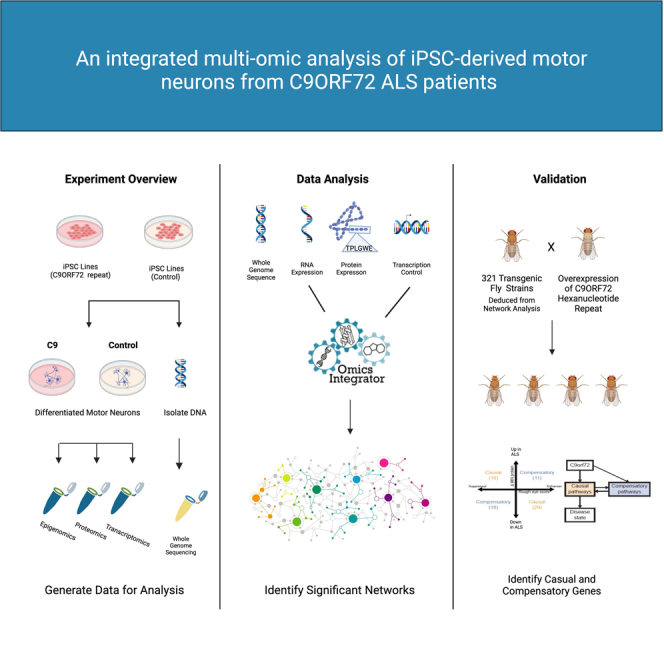
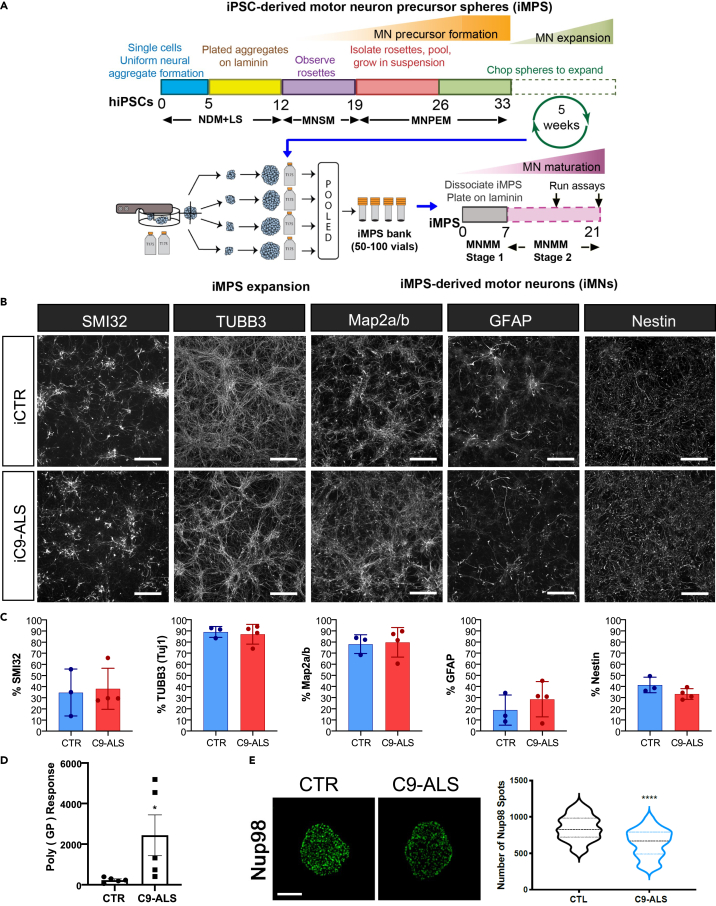
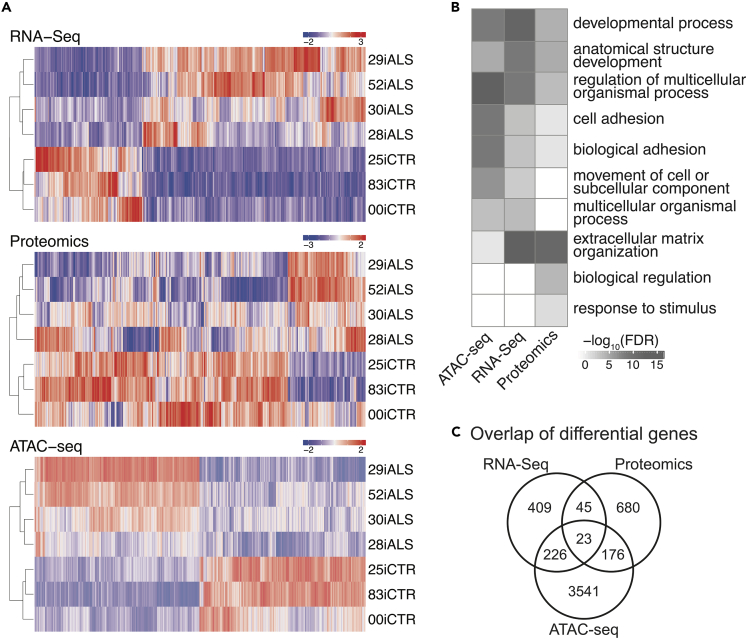
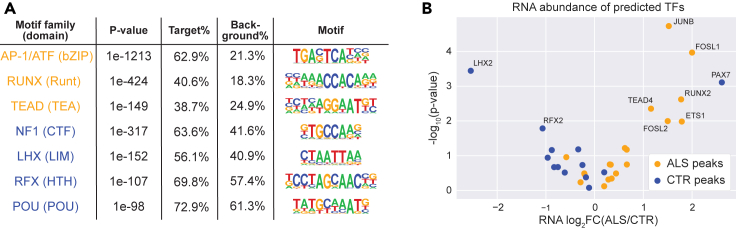
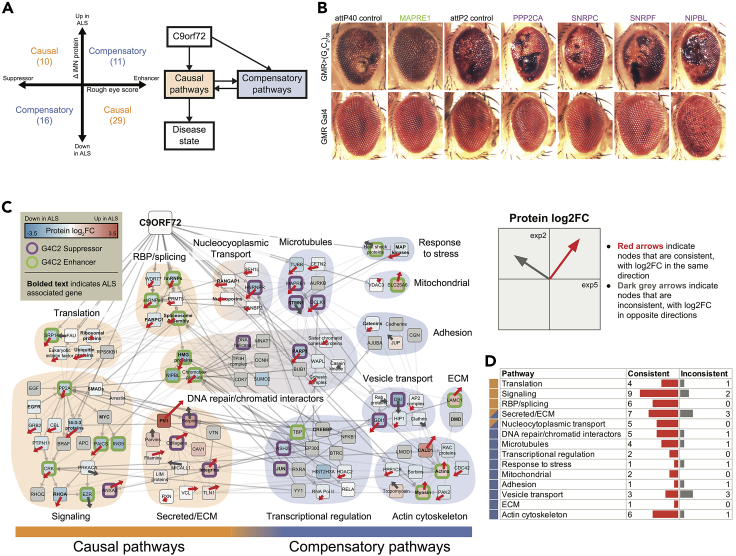
Neurodegenerative diseases are challenging for systems biology because of the lack of reliable animal models or patient samples at early disease stages. Induced pluripotent stem cells (iPSCs) could address these challenges. We investigated DNA, RNA, epigenetics, and proteins in iPSC-derived motor neurons from patients with ALS carrying hexanucleotide expansions in C9ORF72. Using integrative computational methods combining all omics datasets, we identified novel and known dysregulated pathways. We used a C9ORF72 Drosophila model to distinguish pathways contributing to disease phenotypes from compensatory ones and confirmed alterations in some pathways in postmortem spinal cord tissue of patients with ALS. A different differentiation protocol was used to derive a separate set of C9ORF72 and control motor neurons. Many individual -omics differed by protocol, but some core dysregulated pathways were consistent. This strategy of analyzing patient-specific neurons provides disease-related outcomes with small numbers of heterogeneous lines and reduces variation from single-omics to elucidate network-based signatures.

Keywords: Biological sciences; Neuroscience; Omics; Systems biology; Systems neuroscience.


Conflict of interest statement

The authors declare no competing interests.

Figures

None
Graphical abstract
Figure 1
Figure 1
iPSC differentiations (A) Schematic of protocol for iPSC differentiation into motor neuron cultures used by NeuroLINCS for transcriptomics, proteomics, and epigenomics assays. The iPSC-derived motor neuron precursor spheres (iMPS) were dissociated into single cells from C9-ALS and healthy patient iPSC lines and plated on laminin substrate to differentiate further into motor neuron (iMN) cultures over 21 days. (B) Representative images of iMNs from control (25iCTR) and C9-ALS (52iALS). iMNs show consistent distribution of neural cell populations marked by SMI32, TuJ1, Map2a/b, GFAP, and nestin. Scale bars are 50 μm. (C) Levels of SMI32, TUBB3 (TuJ1), GFAP, nestin, and Map2a/b in control and C9-ALS iMN cultures from the individual iPSC lines. Two-sided unpaired t test with Welch's correction (CTR n = 3 and C9-ALS n = 4). (D) Poly(GP) DPR levels as determined by MSD ELISA assay in iMNs (from CS29 ISO 191.06, CS52 4544.25, CS0702 60.45, CS7VCZ 5180.33, CS29 405.69, CS0465 297.85, CS0594 391.5, CS0BUU 1323.32, CS52 ISO 233.72, CS6ZLD 738.54). p = 0.0348. (E) Maximum intensity projections from SIM imaging of Nup98 in nuclei isolated from control and C9ORF72 iMNs (CS0188, CS0594, CS0702, CS29, CS52, CS7VCZ). Quantification of Nup98 spots. N = 3 control and 3 C9ORF72 iPSC lines, 20 NeuN+ nuclei/line. Student’s t test was used to calculate statistical significance (Gendron et al., 2017). p < 0.0001. Scale bar, 5 μm.
Figure 2
Figure 2
OMIC assays (A) Hierarchical clustering of RNA-Seq, Proteomics, and ATAC-seq signals normalized by Z score. (B) Top GO term enrichments for each assay reveal common biological processes. The top five GO process terms (sorted by FDR significance) for each assay were included in the visualization. (C) Venn diagram of differential genes or proteins from each assay. Each differential ATAC-seq peak was assigned the nearest protein coding gene (up to a limit of 50 kb from the TSS).
Figure 3
Figure 3
Transcription factor predictions (A) Transcription factor (TF) families that are predicted to be differentially active between ALS and control samples. Orange motifs are predicted to be more active in ALS, and blue motifs are predicted to be more active in controls. (B) A volcano plot of RNA abundance for each predicted TF shows that TFs that are predicted to be active in ALS are also more highly expressed in ALS samples, whereas TFs that are predicted to be active in controls are less expressed in ALS samples.
Figure 4
Figure 4
Data integration (A) Integrative analysis reveals a network of 374 proteins organized by subcellular location, of which 264 are experimentally determined from proteomics (circles), 27 are predicted transcription factors, and 83 are other proteins that were closely connected by physical interactions. Borders indicate ALS-associated proteins from experiments or screens (purple) and text mining (green). (B) A zoomed-in view of the nucleus compartment displaying genes with RNA metabolism functions. (C) A zoomed-in view of the extracellular matrix compartment.
Figure 5
Figure 5
Validation in Drosophila (A) Left: Each gene that was tested in the fly model is sorted into causal or compensatory categories using its fly phenotype and change in protein values in iMNs. Right: A schematic showing the interplay between causal and compensatory pathways that eventually result in the disease. (B) The effect of genetic manipulations on external eye morphology and depigmentation in G4C2-expressing flies. (C) Causal and compensatory genes from A were connected via intermediate genes and the resulting network was organized by cellular process. Proteins from the same families were consolidated into a single node for readability. The borders indicate whether the gene is a G4C2 suppressor (purple) or enhancer (green). Bolded names indicate ALS-associated genes. The horizontal and vertical components of the arrows indicate protein fold changes (ALS/CTR) between the original and validation experiments, respectively. Red arrows indicate proteins whose fold changes were consistent between experiments, whereas dark gray arrows indicate proteins that were inconsistent. (D) Numbers of consistent and inconsistent nodes between the original and validation experiments within each pathway in the Drosophila network in (C).

References

    1. Abel O., Shatunov A., Jones A.R., Andersen P.M., Powell J.F., Al-Chalabi A. Development of a smartphone app for a genetics website: the amyotrophic lateral sclerosis online genetics database (ALSoD) JMIR Mhealth Uhealth. 2013;1:e18. - PMC - PubMed
    1. Agarwal V., Bell G.W., Nam J.W., Bartel D.P. Predicting effective microRNA target sites in mammalian mRNAs. Elife. 2015;4:e05005. - PMC - PubMed
    1. Amberger J.S., Bocchini C.A., Schiettecatte F., Scott A.F., Hamosh A. OMIM.org: online Mendelian Inheritance in Man (OMIM(R)), an online catalog of human genes and genetic disorders. Nucleic Acids Res. 2015;43:D789–D798. - PMC - PubMed
    1. Anders S., Pyl P.T., Huber W. HTSeq—a Python framework to work with high-throughput sequencing data. Bioinformatics. 2015;31:166–169. - PMC - PubMed
    1. Auton A., Brooks L.D., Durbin R.M., Garrison E.P., Kang H.M., Korbel J.O., Marchini J.L., Mccarthy S., Mcvean G.A., Abecasis G.R. A global reference for human genetic variation. Nature. 2015;526:68–74. - PMC - PubMed