. 2021 Oct 9;24(11):103250.
doi: 10.1016/j.isci.2021.103250. eCollection 2021 Nov 19.

IL-1beta promotes the age-associated decline of beta cell function

Affiliations

IL-1beta promotes the age-associated decline of beta cell function

Marianne Böni-Schnetzler et al. iScience. .

Abstract

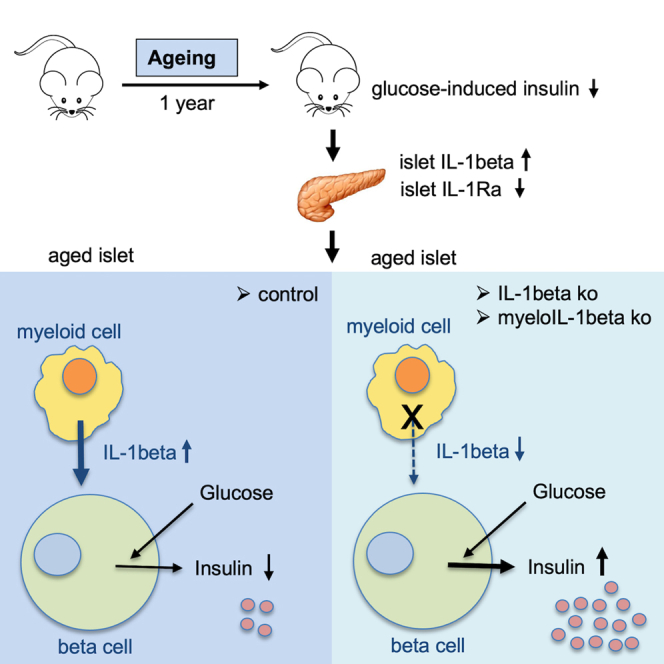
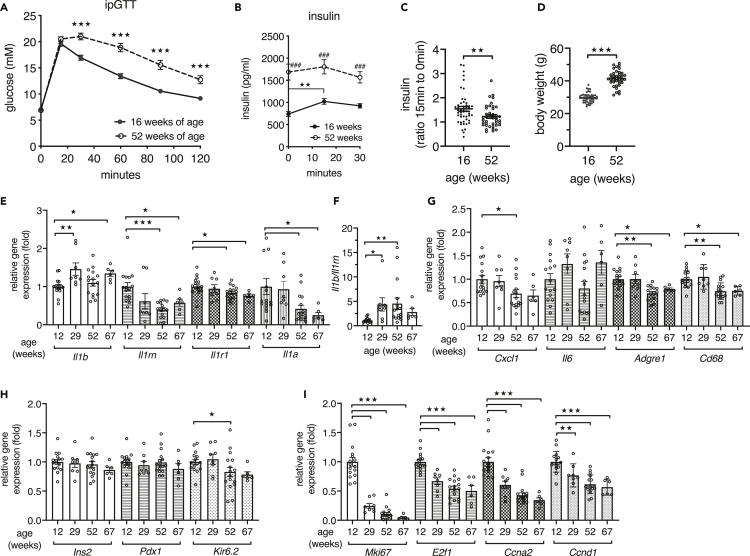
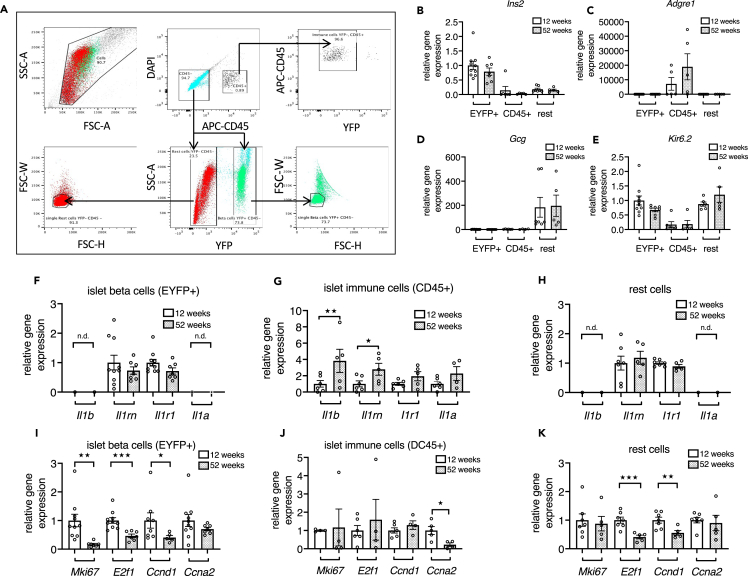
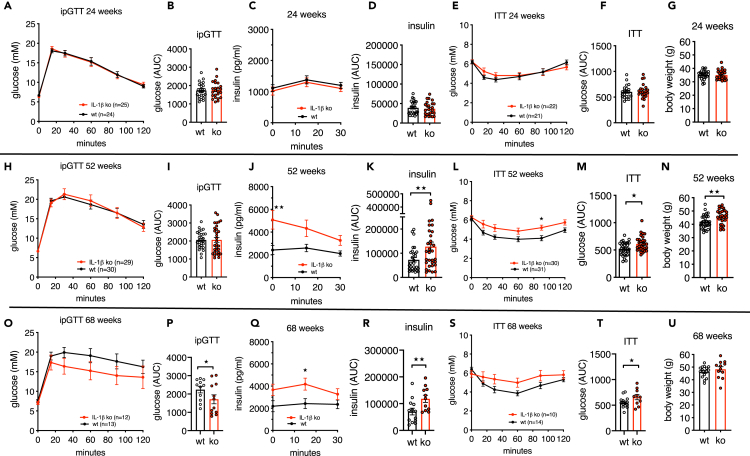
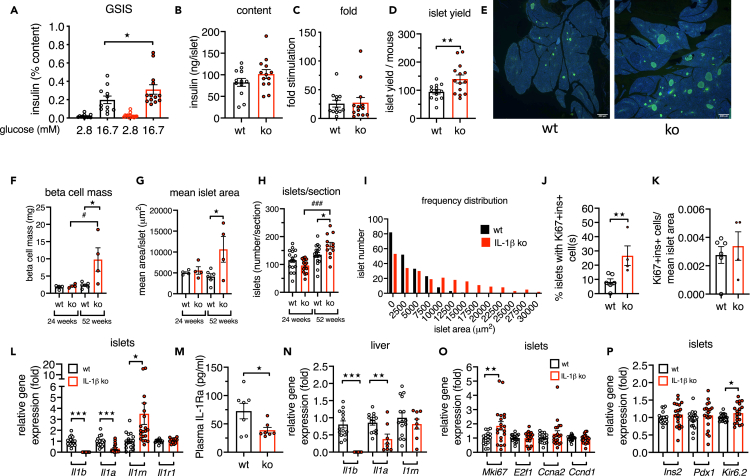
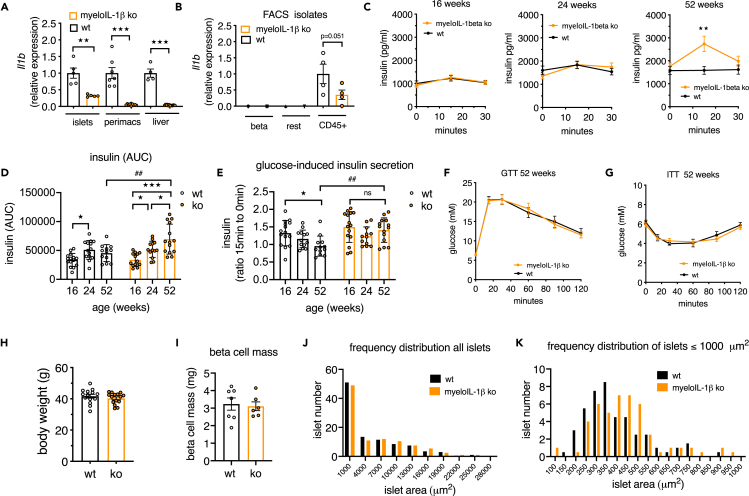
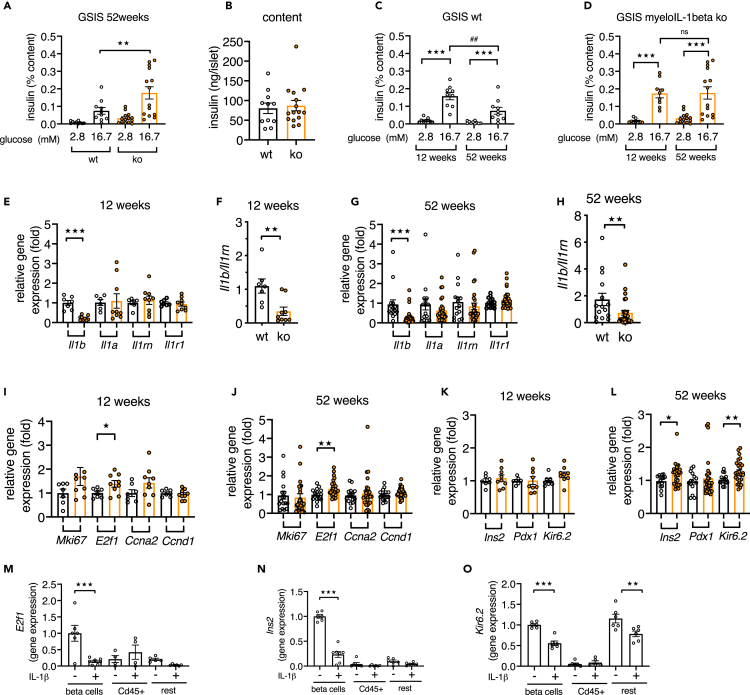
Aging is the prime risk factor for the development of type 2 diabetes. We investigated the role of the interleukin-1 (IL-1) system on insulin secretion in aged mice. During aging, expression of the protective IL-1 receptor antagonist decreased in islets, whereas IL-1beta gene expression increased specifically in the CD45 + islet immune cell fraction. One-year-old mice with a whole-body knockout of IL-1beta had higher insulin secretion in vivo and in isolated islets, along with enhanced proliferation marker Ki67 and elevated size and number of islets. Myeloid cell-specific IL-1beta knockout preserved glucose-stimulated insulin secretion during aging, whereas it declined in control mice. Isolated islets from aged myeloIL-1beta ko mice secreted more insulin along with increased expression of Ins2, Kir6.2, and of the cell-cycle gene E2f1. IL-1beta treatment of isolated islets reduced E2f1, Ins2, and Kir6.2 expression in beta cells. We conclude that IL-1beta contributes the age-associated decline of beta cell function.

Keywords: Cell biology; Cellular physiology; Physiology.


Conflict of interest statement

M.Y.D. is listed as the inventor on a patent filed in 2003 for the use of an IL-1 receptor antagonist for the treatment of or prophylaxis for type 2 diabetes.

Figures

None
Graphical abstract
Figure 1
Figure 1
Aging leads to reduced beta cell function and altered IL-1 and cell-cycle gene expression in islets (A) Plasma glucose concentrations during an ipGTT of male C57BL/6NCrl mice measured at the age of 16 weeks (n = 49) and again at the age of 52 weeks (n = 41). (B) Corresponding plasma insulin concentrations during ipGTT. (C) Ratio of plasma insulin at 15 min to 0 min of the ipGTT. (D) Corresponding body weights of 16-week-old and 52-week-old male C57BL/6NCrl mice. (E and G–I) Relative gene expression of islets isolated from male C57BL/6NCrl mice at the indicated ages; n = 16 mice at 12 and 52 weeks, n = 8 mice at 29 weeks, and n = 6 mice at 67 weeks. (F) Ratio of relative gene expression of Il1b to Il1rn. Statistics: (C and D) Student's t test; (E–I) one-way ANOVA and Sidak's multiple comparison test; error bars represent SEM, p < 0.05, ★★p < 0.01, ★★★p < 0.001. (A and B) two-way ANOVA and Sidak's multiple comparison test; (A) ★★★p < 0.001, 16 versus 52 weeks of age at the indicated time points; (B) ###p < 0.001, compares 16 weeks with 52 weeks at the indicated time points; ★★p < 0.01 compares 16-week-old mice at 0 min with 16-week-old mice at 15 min.
Figure 2
Figure 2
IL-1 family gene expression is induced in islet immune cells in aging (A) Representative blots detailing the sorting strategy used for isolation of beta cell, rest cell and immune cell fractions from 12- and 52-week-old RIP-EYFP reporter mice. Upper panel: gating for Forward-Side Scatter Area (FSC-A/SSC-A) for bulk cells selection; size and granularity of beta cells (green) and rest cells (red) in sorted fractions; gating of CD45-negative and CD45-positive cells, DAPI was used to remove dead cells; sorting gate for the immune cell fraction based on CD45 positivity and YFP negativity. Lower panel: from the CD45-negative cell gate (upper middle blot), beta cells (green) were gated as YFP-positive cells and rest cells (red) as YFP-negative cells; single cell sorting gates for beta cells (right blot) and rest cells (left blot). (B–E) Relative gene expression in all FACS fractions expressed as fold of mean expression level of EYFP+ cells from 12-week-old beta cell reporter mice. (F–K) Relative gene expression of purified (F and I) beta cell, (G and J) islet immune cell, and (H and K) rest cell fractions from 12-week-old and 52-week-old mice, normalized to mean expression level of 12-week-old mice; n = 7–10 beta cell fractions, n = 5–6 immune cell fractions, and n = 5–7 rest cell fraction from 7–10 mice per age group (in case of low yield, immune cells or rest cells from 2 age-matched mice were pooled). Statistics: Student's t test; error bars represent SEM; p < 0.05, ★★p < 0.01, ★★★p < 0.001.
Figure 3
Figure 3
Aged IL-1beta knockout mice show increased insulin secretion (A–G) 24-week-old IL-1beta ko mice (red) and littermate controls (black); (A and B) ipGTT and area under the curve (AUC) for glucose; (C and D) plasma insulin during ipGTT and AUC for insulin; (E and F) ipITT and AUC for glucose; (G) body weight. (H–N) 52-week-old IL-1beta ko mice (red) and littermate controls (black); (H and I) ipGTT and area under the curve (AUC) for glucose; (J and K) plasma insulin during ipGTT and AUC for insulin; (L and M) ipITT and AUC for glucose; (N) body weight. (O–U) 68-week-old IL-1beta ko mice (red) and littermate controls (black); (O and P) ipGTT and area under the curve (AUC) for glucose; (Q and R) plasma insulin during ipGTT and AUC for insulin; (S and T) ipITT and AUC for glucose; (U) body weight. Number of mice is indicated in figures. Statistics: (A, C, E, H, J, L, O, Q and S) two-way ANOVA and Sidak's multiple comparison test; (B, D, F, G, I, K, M, N, P, R, T, and U) Student's t test; error bars represent SEM, p < 0.05, ★★p< 0.01. See also Figures S1A–S1C.
Figure 4
Figure 4
Deletion of IL-1beta increases beta cell mass and insulin secretion in isolated islets (A–D) GSIS of isolated islets of 52-weeks-old IL-1beta ko (red) and littermate WT control (black) mice; (A) 1 h insulin secretion expressed as percentage of the insulin content per mouse; (B) insulin content per islet; (C) insulin fold stimulation by glucose, (mean of 4 x 10 islets per mouse); (D) number of islets isolated per mouse; n = 11–12 WT and n = 13–14 IL-1beta ko mice. (E) Example of immunohistochemical staining of pancreata from IL-1beta ko and WT control mice (green = insulin, blue = DAPI, scale bar, 400 μm). (F and G) Beta cell mass and mean islet area from 3–4 sections/mouse of 24- and 52-week-old WT and IL-1beta ko mice. (H) Number of islets per pancreas section. (I) Frequency distribution of islet area from 52-week-old IL-1beta ko mice and WT mice. (J) Percentage of islets with one or more Ki67+/ins+/DAPI + cell(s); 472 islets from 4 IL-1beta ko mice and 509 islets from 6 littermate control mice were analyzed. (K) Ki67+/ins+/DAPI + normalized to the mean ins + islet area. (L, N–P) Relative gene expression of 52-week-old IL-1beta ko versus littermate WT control mice; (L and N) IL-1 family genes in islets and liver; (O) cell-cycle genes in islets; (P) islet genes. (M) Plasma IL-1Ra in 52-week-old IL-1beta ko and control WT mice. All data were expressed per mouse. Statistics: (A, F-H) two-way ANOVA and Sidak's multiple comparison test; (B–D, and J–P) Student's t test; error bars represent SEM, p < 0.05, ★★p < 0.01, ★★★p < 0.001, #p < 0.05, ###p < 0.001. See also Figures S2A–S2C.
Figure 5
Figure 5
Deletion of IL-1beta in myeloid cells preserves GSIS in aged mice (A) Il1b expression in islets, peritoneal macrophages (perimacs), and liver from myeloIL-1beta ko (orange) and control mice (black). (B) Il1b expression in FACS-isolated islet cell fractions (n = 4, one data point stems from an islet pool of 2 mice, total 8 mice per genotype). (C–H) Age trajectory of myeloIL-1beta ko mice (orange) and control mice (black); (C) in vivo glucose-stimulated plasma insulin of the same myeloIL-1beta ko (orange) and control mice (black) measured at different ages during ipGTT (n = 13–15 WT mice and n = 14–15 myeloIL-1beta ko mice from 2 separate cohorts); (D) area under the curve (AUC) of plasma insulin of the age trajectory; (E) ratio of plasma insulin at 15 min to 0 min during ipGTT of the age trajectory; (F) plasma glucose during ipGTT; (G) plasma glucose during ipITT; (H) body weight of 52-week-old mice. (I) Beta cell mass determination. (J) Frequency distribution of all islets in histological sections of 52-week-old myeloIL-1beta ko (n = 6) and control (n = 7) mice. (K) Frequency distribution of islets zooming into islet area <1,000 μm2. Statistics: (A, B, H, and I) Student's t test; (C–G) two-way ANOVA and Sidak's multiple comparison test; error bars represent SEM, p < 0.05, ★★p < 0.01, ★★p < 0.01, ★★★p < 0.001, ##p < 0.01; ns, not significant. See also Figures S3A, S3B, S4A, and S4B.
Figure 6
Figure 6
Deletion of IL-1beta in myeloid cells preserves insulin secretion in isolated islets from aged mice (A and B) GSIS of isolated islets of 52-week-old myeloIL-1beta ko (orange) and littermate WT control (black) mice; (A) 1 h insulin secretion expressed as percentage of the insulin content per mouse; (B) insulin content per islet (mean of 3–4 x 10 islets per mouse; n = 10–11 WT and n = 14–15 ko mice). (C and D) Comparison of GSIS data from Figure 6A with GSIS data from 12-week-old mice (mean of 3–4 ×10 islets per mouse, n = 9 WT and n = 9 ko mice). (E, G, and I–L) Relative gene expression of islets from 12-week-old or 52-week-old myeloIL-1beta ko versus respective littermate controls. (F and H) Ratio of Il1b/Il1rn gene expression. All data were expressed per mouse. (M–O) Gene expression in FACS-isolated islet cell fractions from islets isolated from EYFP beta cell reporter mice and treated with or without 1 ng/ml IL-1beta (n = 4–7 FACS-isolated cell fractions from 4 separate experiments). Statistics: (A, C, and D) two-way ANOVA and Sidak's multiple comparison test; (E–O) Student's t test; error bars represent SEM, p < 0.05, ★★p < 0.01, ★★★p < 0.001, ##p < 0.01; ns, not significant. See also Figures S5A–S5E and S6.

References

    1. Aguayo-Mazzucato C. Functional changes in beta cells during ageing and senescence. Diabetologia. 2020;63:2022–2029. - PMC - PubMed
    1. Aguayo-Mazzucato C., Andle J., Lee T.B., Jr., Midha A., Talemal L., Chipashvili V., Hollister-Lock J., van Deursen J., Weir G., Bonner-Weir S. Acceleration of beta cell aging determines diabetes and senolysis improves disease outcomes. Cell Metab. 2019;30:129–142 e124. - PMC - PubMed
    1. Aguayo-Mazzucato C., van Haaren M., Mruk M., Lee T.B., Jr., Crawford C., Hollister-Lock J., Sullivan B.A., Johnson J.W., Ebrahimi A., Dreyfuss J.M. Beta cell aging markers have heterogeneous distribution and are induced by insulin resistance. Cell Metab. 2017;25:898–910 e895. - PMC - PubMed
    1. Almaca J., Molina J., Arrojo E.D.R., Abdulreda M.H., Jeon W.B., Berggren P.O., Caicedo A., Nam H.G. Young capillary vessels rejuvenate aged pancreatic islets. Proc. Natl. Acad. Sci. U S A. 2014;111:17612–17617. - PMC - PubMed
    1. Annicotte J.S., Blanchet E., Chavey C., Iankova I., Costes S., Assou S., Teyssier J., Dalle S., Sardet C., Fajas L. The CDK4-pRB-E2F1 pathway controls insulin secretion. Nat. Cell Biol. 2009;11:1017–1023. - PMC - PubMed