. 2021 Sep;2(9):904-918.
doi: 10.1038/s43018-021-00244-2. Epub 2021 Sep 23.

Dual Targeting CAR-T Cells with Optimal Costimulation and Metabolic Fitness enhance Antitumor Activity and Prevent Escape in Solid Tumors

Affiliations

Dual Targeting CAR-T Cells with Optimal Costimulation and Metabolic Fitness enhance Antitumor Activity and Prevent Escape in Solid Tumors

Koichi Hirabayashi et al. Nat Cancer. 2021 Sep.

Abstract

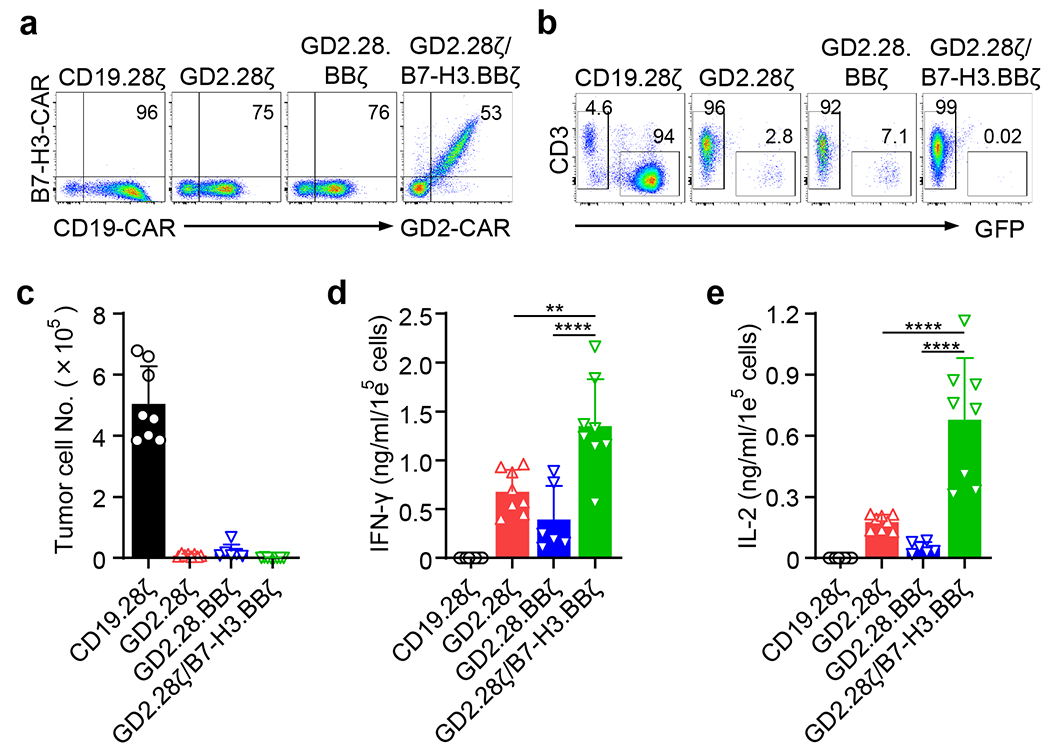
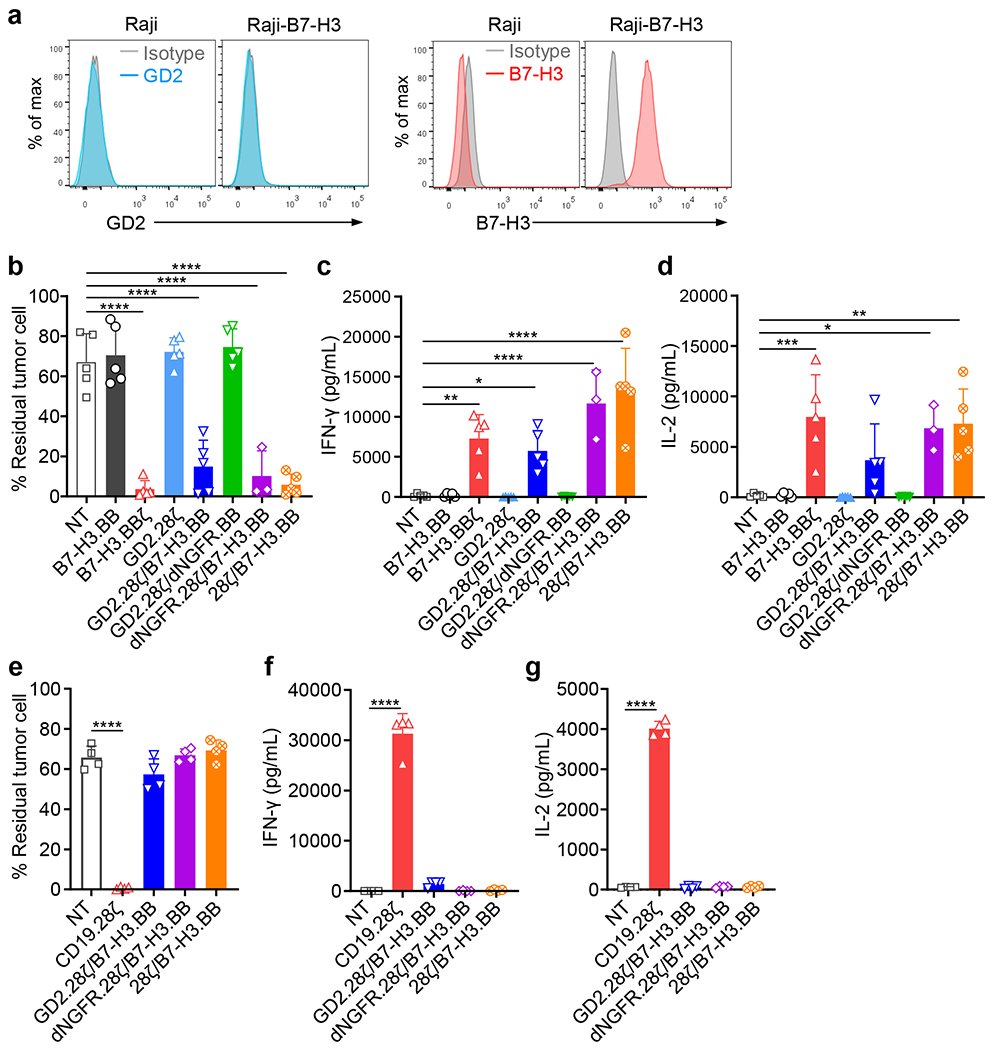
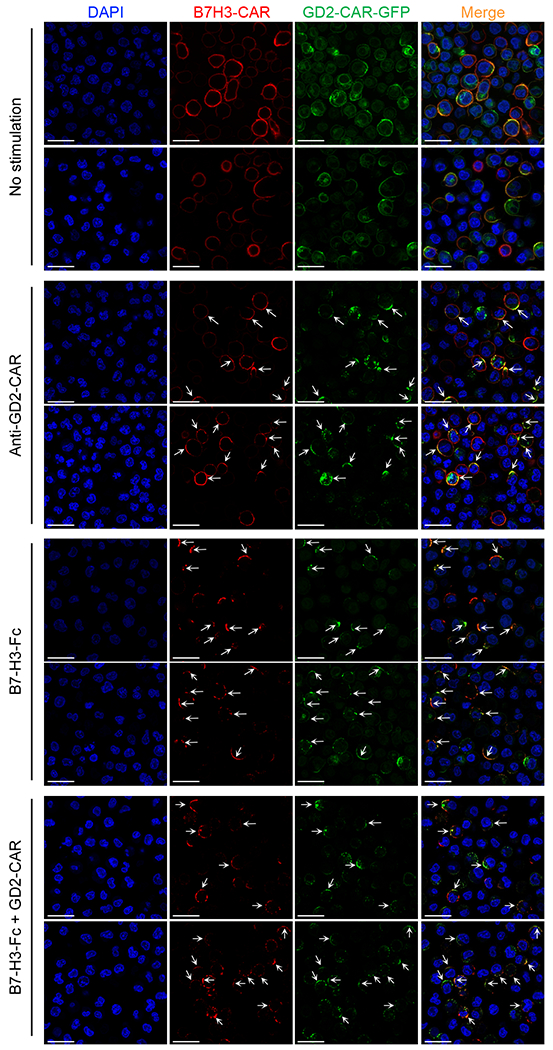
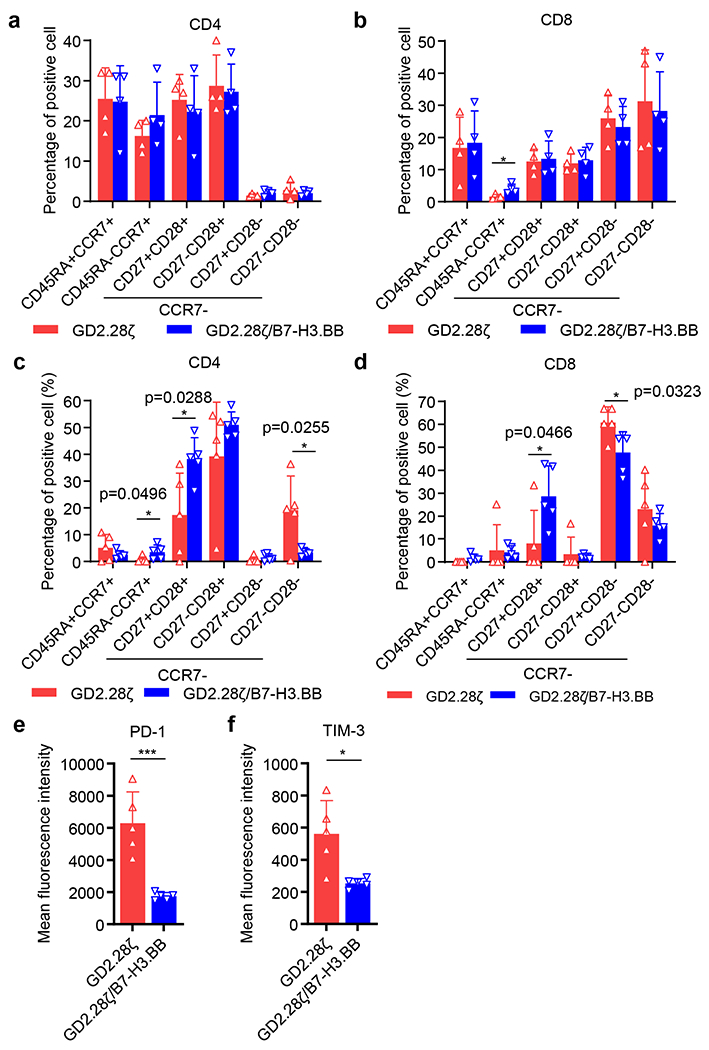
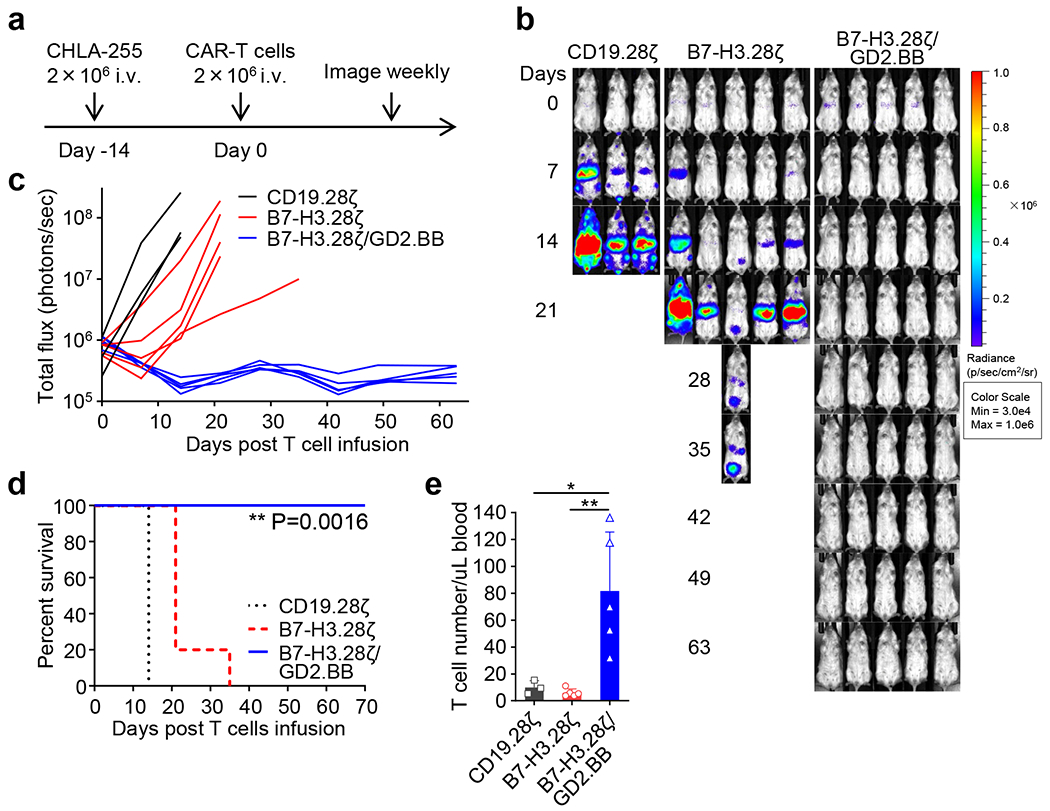
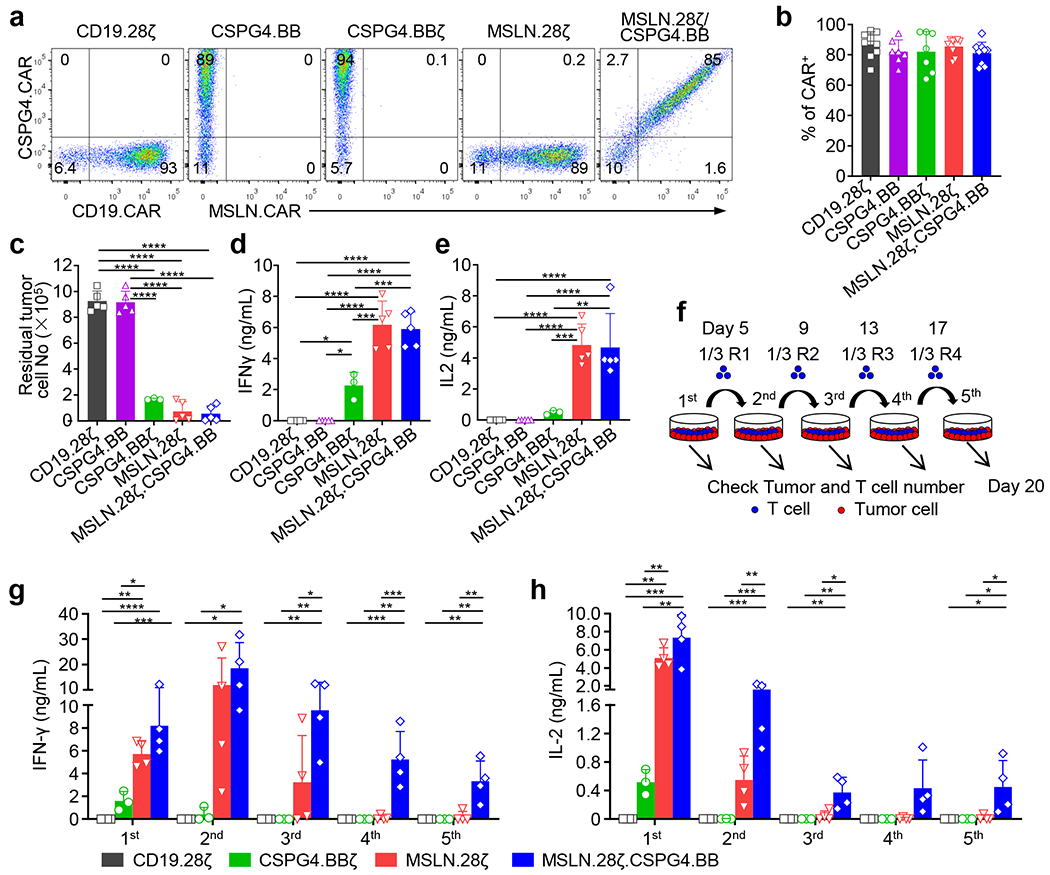
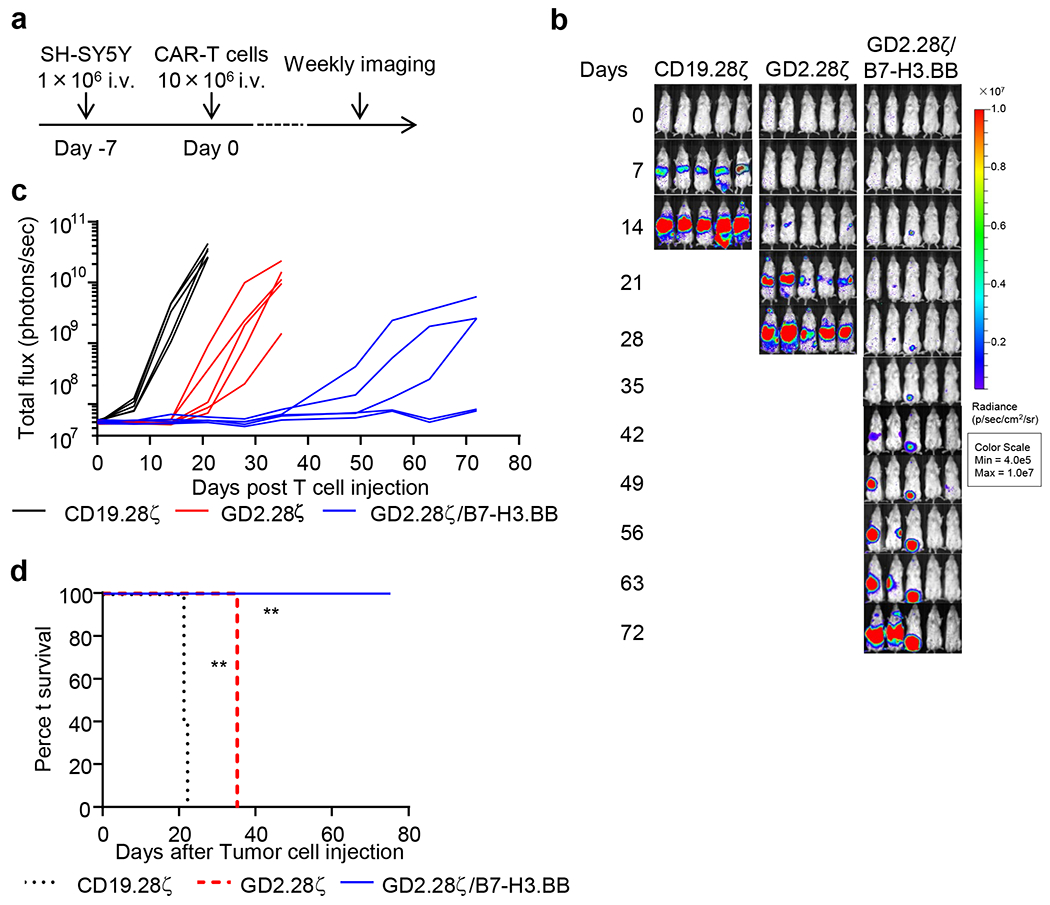
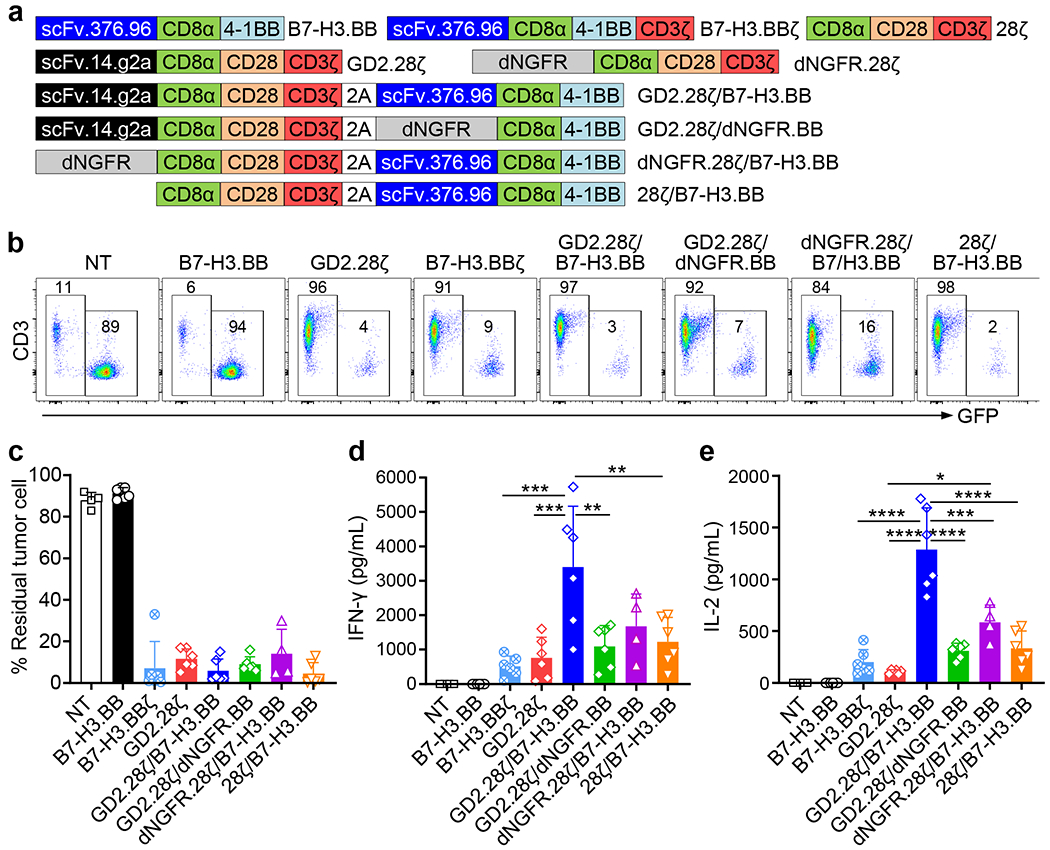
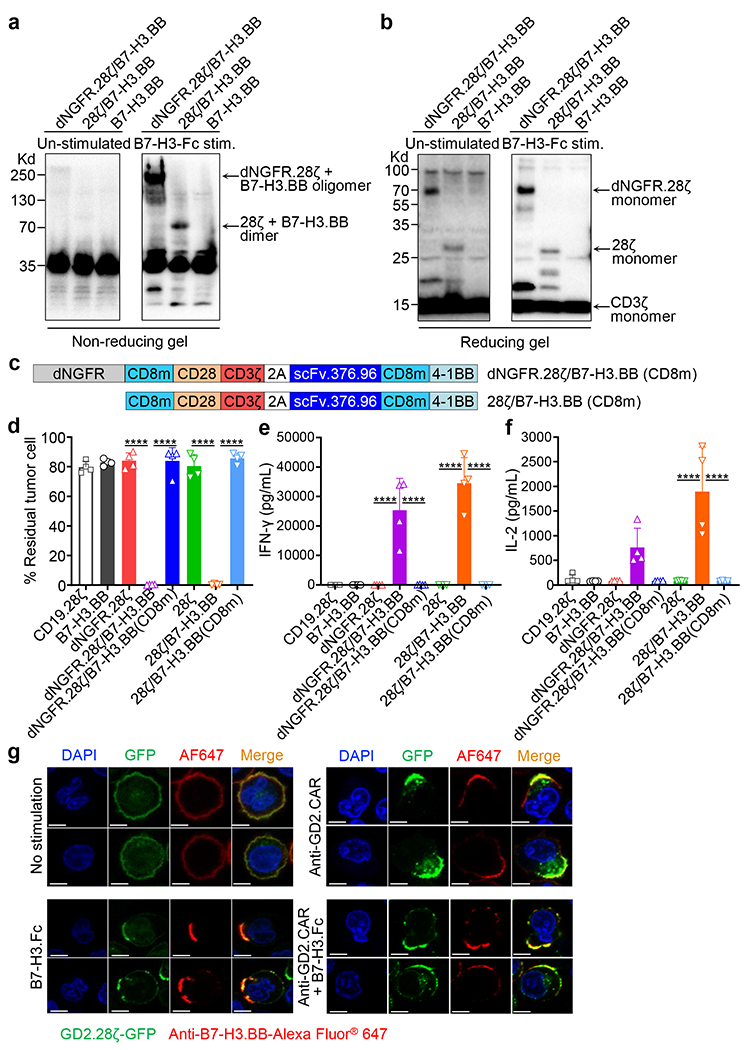
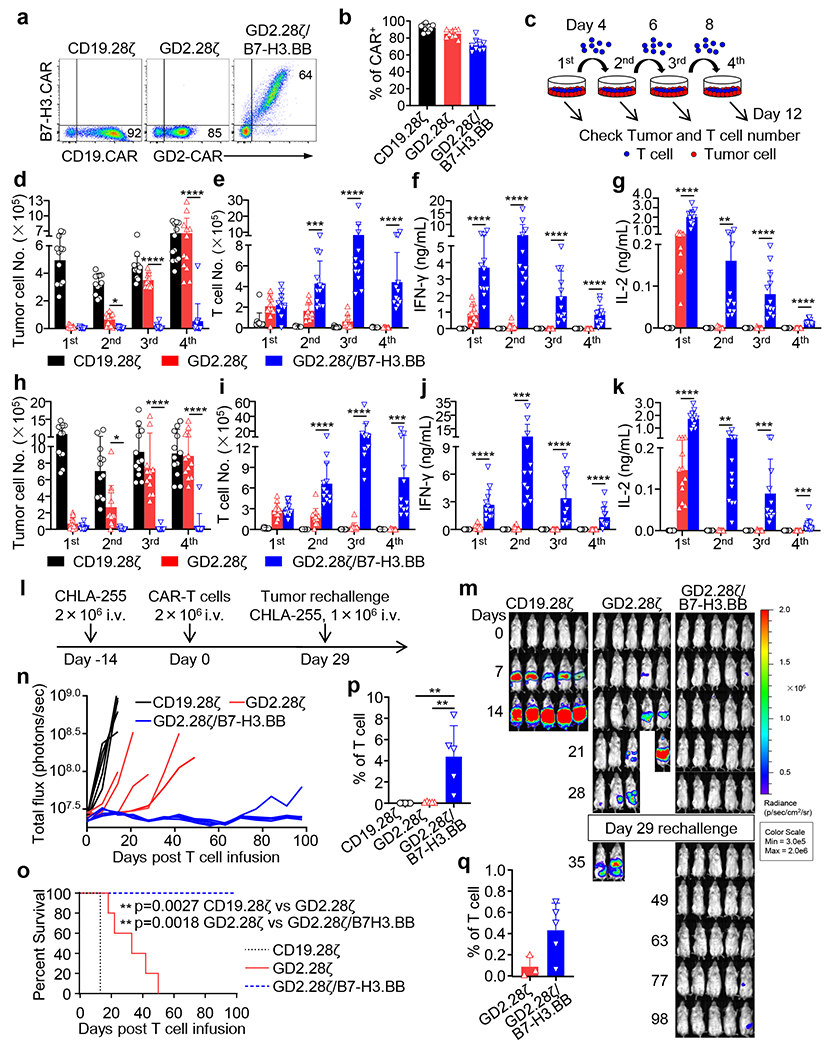
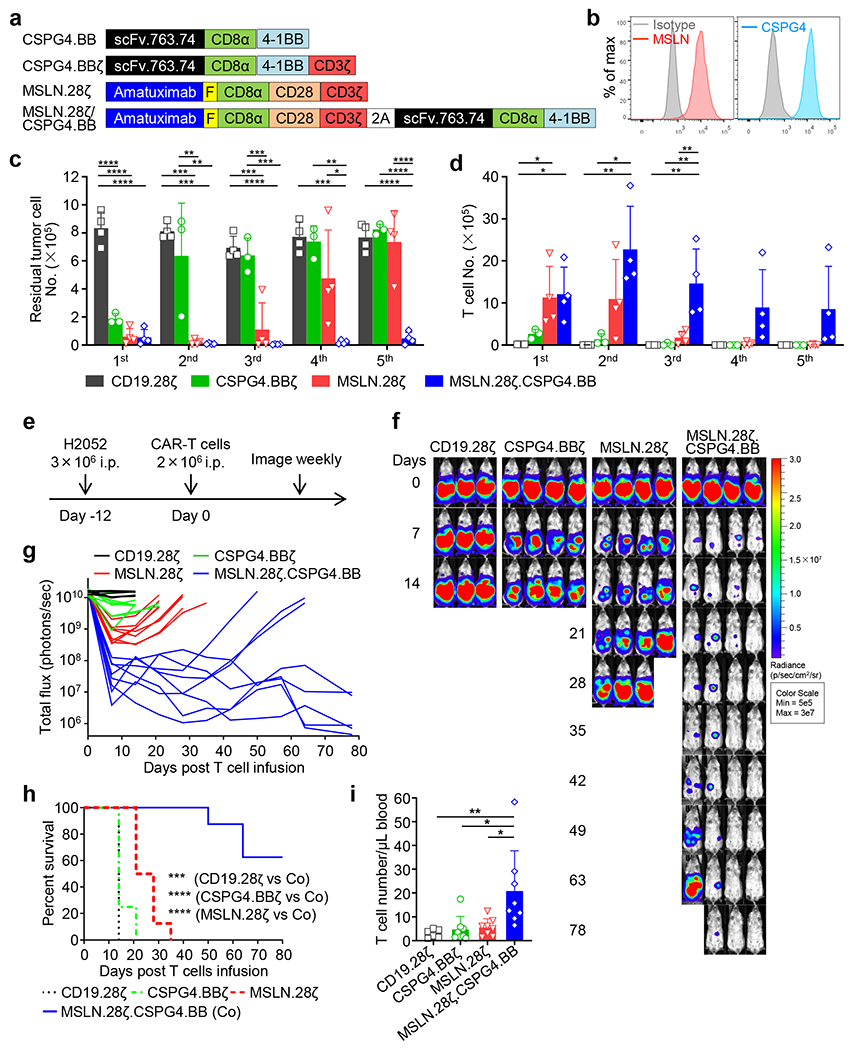
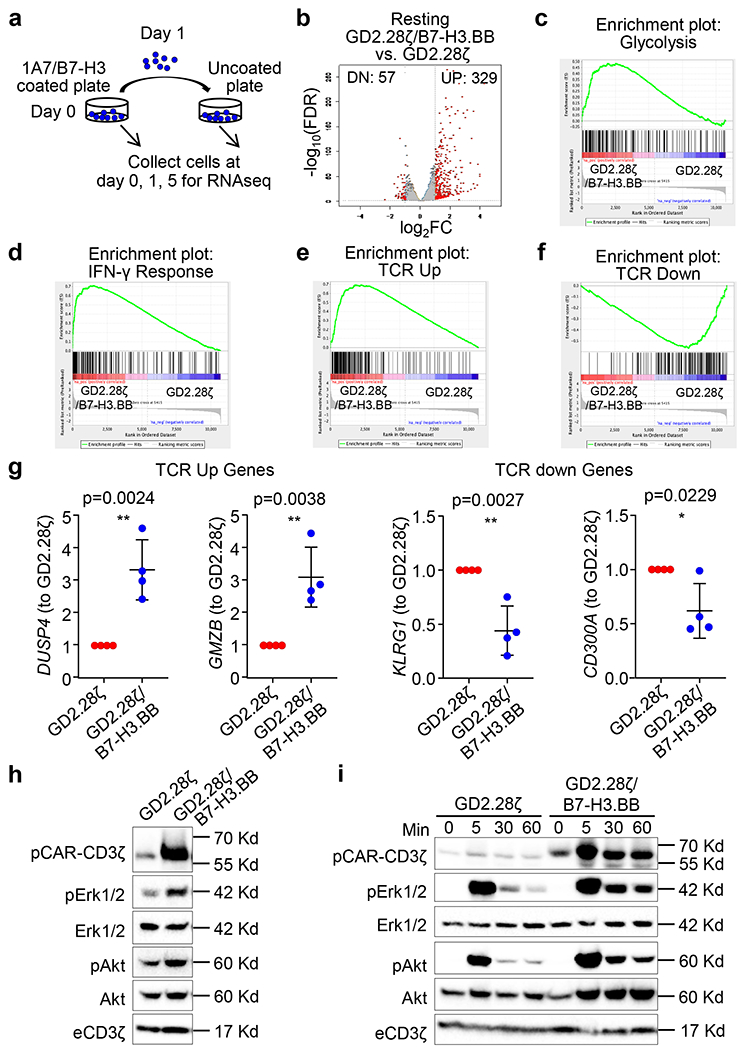
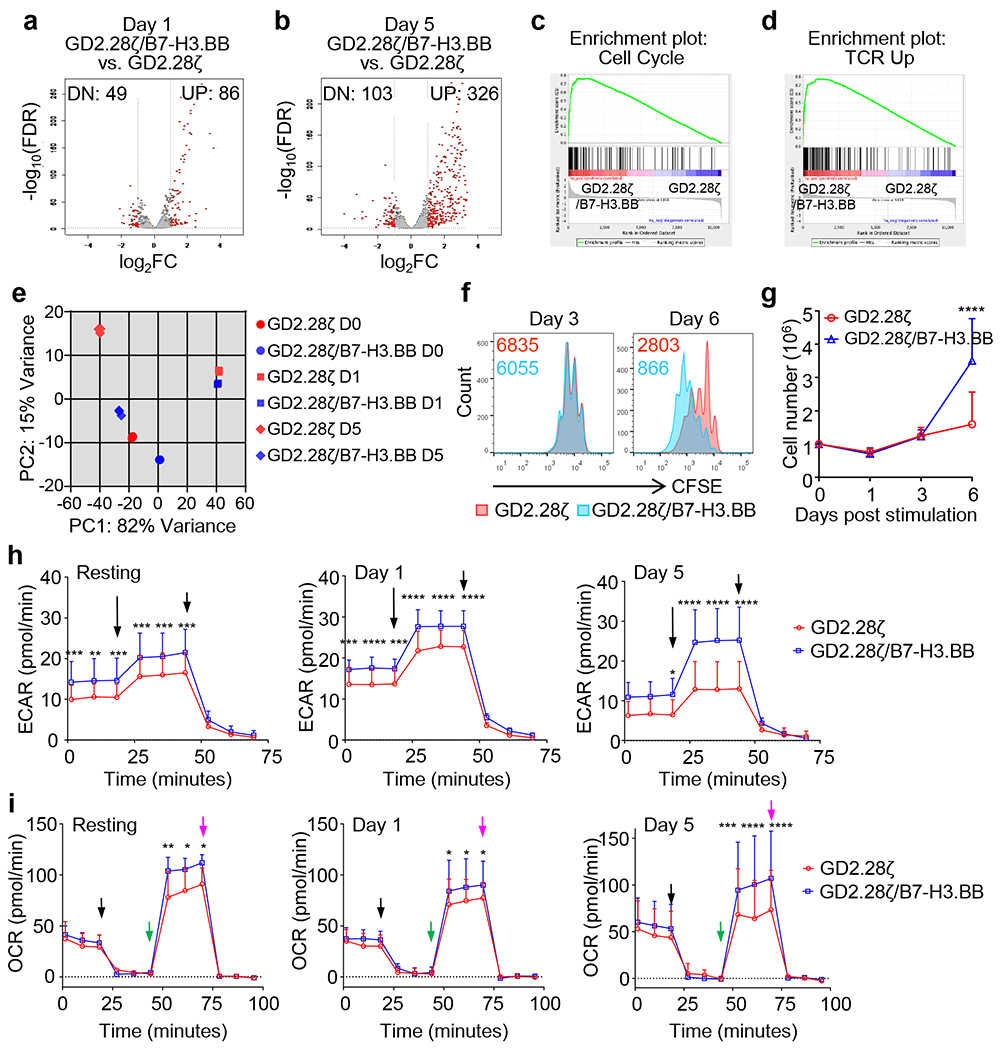
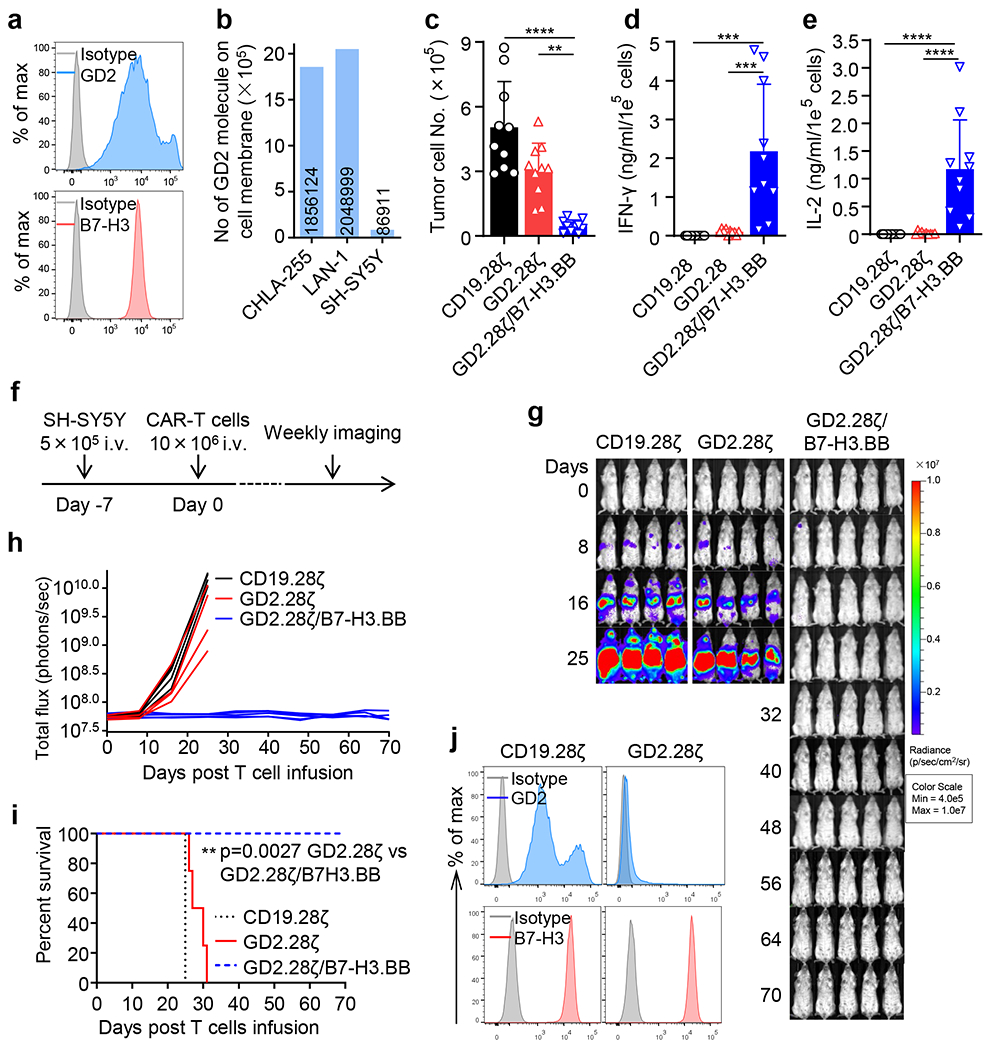
Chimeric antigen receptor (CAR) T cells showed great activity in hematologic malignancies. However, heterogeneous antigen expression in tumor cells and suboptimal CAR-T cell persistence remain critical aspects to achieve clinical responses in patients with solid tumors. Here we show that CAR-T cells targeting simultaneously two tumor-associated antigens and providing transacting CD28 and 4-1BB costimulation, while sharing the sane CD3ζ-chain cause rapid antitumor effects in in vivo stress conditions, protection from tumor re-challenge and prevention of tumor escape due to low antigen density. Molecular and signaling studies indicate that T cells engineered with the proposed CAR design demonstrate sustained phosphorylation of T cell receptor-associated (TCR) signaling molecules and a molecular signature supporting CAR-T cell proliferation and long-term survival. Furthermore, metabolic profiling of CAR-T cells displayed induction of glycolysis that sustains rapid effector T cell function, but also preservation of oxidative functions, which are critical for T cell long-term persistence.


Conflict of interest statement

Reporting Summary. Further information on research design is available in the Nature Research Reporting Summary linked to this article.

Figures

Extended Data Fig. 1.
Extended Data Fig. 1.. GD2-specific CAR-T cells and B7-H3-specific CAR-T cells target neuroblastoma in vitro.
(a) Flow cytometry histogram showing the expression of GD2 and B7-H3 in two human NB cell lines, CHLA-255 and LAN-1. Representative of three independent experiments. (b) Representative flow cytometry histograms showing the expression of CARs in human T cells transduced with retroviral vectors encoding CD19.28ζ, GD2.28ζ, GD2.BBζ, B7-H3.28ζ, and B7-H3.BBζ CARs. (c-e) Representative flow cytometry plots (c) and quantification of residual CHLA-255 (d) and LAN-1 (e) cells labelled with GFP and co-cultured with CAR-T cells at the T cell to tumor cell ratio of 1 to 5. On day 5, NB cells (GFP+) and CAR-T cells (CD3+) were enumerated by flow cytometry. Data are shown as individual values and the mean ± SD, n = 6 independent co-cultures using CAR-T cells generated from 6 different donors. (f,g) Summary of IFN-γ (f) and IL-2 (g) released by CAR-T cells in the culture supernatant after 24 hours of co-culture with NB cells as measured by ELISA. Data are shown as individual values and the mean ± SD, n = 6 independent co-cultures using CAR-T cells generated from 6 different donors. (h) Representative CFSE dilution of CSFE-labeled CAR-T cells co-cultured with NB cells for 5 days at the T cell to tumor cell ratio of 1 to 1 (red histogram). CFSE-labeled CAR-T cell alone (grey histogram) was used as negative control. Representative of three independent experiments.
Extended Data Fig. 2.
Extended Data Fig. 2.. The antitumor activity of GD2-specific CAR-T cells and B7-H3-specific CAR-T cells with either CD28 or 4-1BB costimulation in vivo.
(a) Schema of the CHLA-255 metastatic xenograft NB model using NSG mice inoculated via tail vein injection with 2 × 10⁶ of FFluc-CHLA-255 cells and 14 days later received high doses of CAR-T cells (6 × 10⁶ cells/mouse) intravenously. (b,c) Representative tumor bioluminescence (BLI) images (b) and tumor BLI kinetics (c) of FFluc-CHLA-255 tumor growth (n = 3 mice for the CD19.28z group, n = 5 mice for the other four groups) in the metastatic xenograft NB models shown in (a). (d) Kaplan-Meier survival curve of mice in (b,c), n = 3 mice for CD19.28z group, n = 5 mice for other 4 groups, comparisons of survival curves were determined by Log-rank test, **p = 0.0042 for CD19.28z vs. other 4 groups. (e) Schema of the LAN-1 metastatic xenograft NB model using NSG mice inoculated via tail vein injection with FFLuc-LAN-1 cells and treated 21 days later with low doses CD19.28ζ, GD2.28ζ, GD2.BBζ, B7-H3.28ζ or B7-H3.BBζ CAR-T cells intravenously. (f,g) Representative tumor BLI images (f) and tumor BLI kinetics (g) of FFLuc-LAN-1 tumor growth (n = 3 mice/group). (h) Kaplan-Meier survival curve of mice in (f,g), n = 3 mice/group, comparisons of survival curves were determined by Log-rank test, *p = 0.0253 for CD19.28z vs. GD2.28ζ, GD2.BBζ and B7-H3.BBζ groups, *p = 0.0295 for GD2.28ζ vs. GD2.BBζ, *p = 0.0246 for GD2.28ζ vs. B7-H3.BBζ.
Extended Data Fig. 3.
Extended Data Fig. 3.. Addition of 4-1BB in tandem to the GD2.28ζ CAR and co-expression of both GD2.28ζ and B7-H3.BBζ CARs do not improve antitumor activity in vitro.
(a) Representative flow cytometry plots showing the CAR expression in human T cells transduced with retroviral vectors encoding CD19.28ζ, GD2.28ζ, GD2.28.BBζ, or GD2.28ζ/B7-H3.28ζ CARs. Representative of six independent experiments. (b,c) Representative flow cytometry plots (b) and quantification of residual CHLA-255 cells (c) labelled with GFP co-cultured with CAR-T cells at the T cell to tumor cell ratio of 1 to 5. Data are shown as individual values and the mean ± SD, n = 6 or 8 independent co-cultures using CAR-T cells generated from 6 or 8 different donors. (d,e) Summary of IFN-γ (d) and IL-2 (e) released by CAR-T cells in the culture supernatant after 24 hours of co-culture with NB cells as measured by ELISA. Data are shown as individual values and the mean ± SD, n = 6 or 8 independent co-cultures using CAR-T cells generated from 6 or 8 different donors; **p = 0.0011, ****p <0.0001 by one-way ANOVA with Tukey’s multiple comparison test adjusted p value.
Extended Data Fig. 4.
Extended Data Fig. 4.. Cytotoxic activity of the double CAR-T cells with shared CD3ζ is antigen dependent.
(a) Flow cytometry plots showing the expression of B7-H3 and GD2 in Raji cells wild type and B7-H3 expression in Raji cells transduced with a retroviral vector encoding B7-H3 (Raji-B7-H3). Representative of three independent experiments. (b-d) CAR-T cells (B7-H3.BB, B7-H3.BBζ, GD2.28ζ, GD2.28ζ/B7-H3.BB, dNGFR.28ζ/B7-H3.BB and 28ζ/B7-H3.BB) were co-cultured with Raji-B7-H3 cell at 1 to 1 ratio, and 5 days later tumor cells (CD19+) and T cells (CD3+) were collected and enumerated by flow cytometry (b). Supernatants of the co-cultures were collected 24 hours later, and IFN-γ (c) and IL-2 (d) released by CAR-T cells were measured by ELISA. Data are shown as individual values and the mean ± SD, n = 3 independent co-cultures using CAR-T cells generated from 3 different donors for dNGFR.28ζ/B7-H3.BB group, and n = 5 independent co-cultures using CAR-T cells generated from 5 different donors for all the other groups; *p <0.05 (0.0228 in c, 0.0141 in d ), **p <0.01 (0.0025 in c, 0.0015 in d), ***p = 0.0005, ****p <0.0001 by one-way ANOVA with Tukey’s multiple comparison test adjusted p value. (e-g) CAR-T cells (CD19.28ζ, GD2.28ζ/B7-H3.BB, dNGFR.28ζ/B7-H3.BB and 28ζ/B7-H3.BB) were co-cultured with Raji cell wild type at 1 to 1 ratio, and 5 days later tumor cells (CD19+) and T cells (CD3+) were collected and enumerated by flow cytometry (e). Supernatants of the co-cultures were collected 24 hours later, and IFN-γ (f) and IL-2 (g) released by CAR-T cells were measured by ELISA. Data are shown as individual values and the mean ± SD, n = 4 independent co-cultures using CAR-T cells generated from 4 different donors for each group; ****p <0.0001 by one-way ANOVA with Tukey’s multiple comparison test adjusted p value.
Extended Data Fig. 5.
Extended Data Fig. 5.. CAR clustering and aggregation in CAR-T cells after CAR engagement.
Representative confocal microscopy imaging showing CAR molecule clustering in T cells expressing GFP-tagged GD2.28ζ (green) and B7-H3.BB (red) with and without engagement of the CARs using either the anti-14g2a idiotype antibody (1A7) or the B7-H3.Fc protein. Blue staining indicates the DAPI. Shown are representative cells of a single field (Magnification 63X). Data are representative of three independent validations. Shown in white are the scale bars that correspond to 20 μm.
Extended Data Fig. 6.
Extended Data Fig. 6.. Phenotypic analysis of CAR-T cells in vitro and in vivo.
(a,b) Frequency of CD45RA+CCR7+, CD45RACCR7+, CCR7CD28+CD27+, CCR7CD28+CD27, CCR7CD28CD27+, and CCR7CD28CD27 in CD4+ (a) and CD8+ (b) T cells on day 13 after retroviral vector transduction and expansion in vitro. Data are shown as individual values and the mean ± SD, n = 4 independent experiments using CAR-T cells generated from 4 different donors; *p = 0.0299, two-tailed p value determined by unpaired t test. (c-f) Tumor-baring mice infused with CAR-T cells were bled at day 14 and CAR-T cells in the peripheral blood were analyzed by flow cytometry. (c,d) Frequency of CD45RA+CCR7+, CD45RACCR7+, CCR7CD28+CD27+, CCR7CD28+CD27, CCR7CD28CD27+, and CCR7CD28CD27 in CD4+ (c) and CD8+ (d) T cells. Data are shown as individual values and the mean ± SD, n = 5 samples from 5 mice, *p < 0.05, two-tailed p value determined by unpaired t test. (e,f) Mean Fluorescence Intensity (MFI) of PD-1 (e) and TIM-3 (f) in T cells. Data are shown as individual values and the mean ± SD, n = 5 samples from 5 mice; *p = 0.0109, ***p = 0.0008, two-tailed p value determined by unpaired t test.
Extended Data Fig. 7.
Extended Data Fig. 7.. Inverting the orientation of the B7-H3-specifc CAR and GD2-specific CAR does not alter the beneficial effects of dual targeting CAR-T cells with split costimulation and shared CD3ζ in vitro.
(a) Schematic representation of retroviral vectors encoding B7-H3.28ζ, GD2.BB and B7-H3.28ζ/GD2.BB CARs. (b) Representative flow cytometry plots of 5 independent experiments showing the expression of CARs. (c) Summary of the transduction efficiency of the CARs. Data are shown as individual values and the mean ±; SD, n = 5 or 7 independent experiments using CAR-T cells generated from 5 or 7 different donors; ***p = 0.002, ****p <0.0001 by one-way ANOVA with Tukey’s multiple comparison test adjusted p value. (d-f) CAR-T cells were co-cultured with CHLA-255-GFP at T cell to tumor cell ratio of 1 to 5. IFN-γ (e) and IL-2 (f) released by CAR-T cells were measured by ELISA. On day 5, tumor cells (GFP+) and CAR-T cells (CD3+) number were measured by flow cytometry (d). Data are shown as individual values and the mean ± SD, n = 3 independent co-cultures using CAR-T cells generated from 3 different donors ; *p <0.05, **p <0.01, ***p <0.001, ****p <0.0001 by one-way ANOVA with Tukey’s multiple comparison test adjusted p value, the full list of p values can be found in the source data. (g) Schema of the repetitive multi-round co-culture experiments. Tumor cells were seeded in 24-well plates one day prior to the addition of T cells. At day 0, CAR-T cells were added at T cell to tumor cell ratio of 1 to 5. At day 4, 7, and 10, all T cells were collected and transferred into a new well in which 5 × 10⁵ NB cells were seeded one day before. T cells and tumor cells, and cytokine were quantified at each cycle. (h-o) Multi-round co-culture with NB cell lines CHLA-255 (h-k) and LAN-1 (l-o) cells as described in (g). Summary of percentage of residual CHLA-255 (h) and LAN-1 (l) cells and number of T cells (i, m) at the end of each round of co-culture. Summary of IFN-γ (j, n) and IL-2 (k, o) released by CAR-T cells in the culture supernatant after 24 hours of co-culture with CHLA-255 (j, k) and LAN-1 (n, o) cells. Data are shown as individual values and the mean ± SD, n = 6 independent co-cultures using CAR-T cells generated from 6 different donors; *p <0.05, **p <0.01, ***p <0.001, ****p <0.0001 by one-way ANOVA with Tukey’s multiple comparison test adjusted p value, the full list of p values can be found in the source data.
Extended Data Fig. 8.
Extended Data Fig. 8.. Dual targeting with split co-stimulation and shared CD3ζ provide superior antitumor activity and better T cell persistence in NB model when mice are treated with inverted B7-H3-specifc CAR and GD2-specific CAR.
(a) Schema of the CHLA-255 metastatic xenograft NB model in NSG mice. Eight week old female NSG mice were inoculated with 2 x 10⁶ FFLuc-labelled CHLA-255 cells via tail vein injection, and 14 days later mice were treated with 2 x 10⁶ CD19.28ζ, B7-H3.28ζ or B7-H3.28ζ/GD2.BB CAR-T cells via tail vein injection. (b, c) Representative tumor bioluminescence (BLI) images (b) and tumor BLI kinetics (c) of FFLuc-CHLA-255 tumor growth in the metastatic xenograft NB model shown in (a) (n = 3 mice for the CD19.28ζ group, n = 5 mice for the other two groups). (d) Kaplan-Meier survival curve of mice in (b, c) (n = 3 for the CD19.28ζ group, n = 5 for the other two groups); **p = 0.0016 (B7-H3.28ζ vs. B7-H3.28ζ/GD2.BB) by Log-rank test. (e) Detection of circulating CAR-T cells (CD45+CD3+) in mice 14 days after CAR-T cell treatment by flow cytometry. Data are shown as individual values and the mean ± SD, (n = 3 samples from 3 mice for the CD19.28ζ group, n = 5 samples from 5 mice for the other two groups); *p = 0.0144, **p = 0.0042 by one-way ANOVA with Tukey’s multiple comparison test adjusted p value.
Extended Data Fig. 9.
Extended Data Fig. 9.. MSLN and CSPG4 dual targeting CAR-T cells with split co-stimulation and shared CD3ζ show sustained T cell activation and proliferation in vitro.
(a) Representative flow cytometry plots showing the expression of CARs. (b) Summary of the transduction efficiency of the CARs (n = 7 or 9 independent experiments using CAR-T cells generated from 7 or 9 different donors). Data are shown as individual values and the mean + SD. (c-e) CAR-T cells co-cultured with GFP labeled H2052 cell at T cell to tumor cell ratio of 1 to 5. IFN-γ (d) and IL-2 (e) released by CAR-T cells. On day 5, tumor cells (GFP+) and CAR-T cells (CD3+) were measured by flow cytometry (c). Data are shown as individual values and the mean ± SD, n = 3 independent co-cultures using CAR-T cells generated from 3 different donors for the CSPG4.BBζ group, n = 5 independent co-cultures using CAR-T cells generated from 5 different donors for the other groups; *p <0.05, **p <0.01, ***p <0.001, ****p <0.0001 by one-way ANOVA with Tukey’s multiple comparison test adjusted p value, the full list of p values can be found in the source data. (f) Schema of the multi-round co-culture experiments of CAR-T cells and H2052. Tumor cells were seeded one day prior to the addition of T cells. At day 0, CAR-T cells were added at T cell to tumor cell ratio of 1 to 5. At the end of each round of co-culture, which are at days 5, 9, 13 and 17, one third of T cells were collected and transferred into a new well with 2.5 × 10⁵ H2052 cells that were seeded one day before. T cells and tumor cells and cytokine released by CAR-T cells were quantified at each round of co-culture. (g-h) Summary of IFN-γ (g) and IL-2 (h) released by CAR-T cells in the multi-round co-culture with H2052 as described in (f). Data are shown as individual values and the mean ± SD, n = 3 independent co-cultures using CAR-T cells generated from 3 different donors for the CSPG4.BBζ group, n = 4 independent co-cultures using CAR-T cells generated from 4 different donors for the other groups; *p <0.05, **p <0.01, ***p <0.001, ****p <0.0001 by one-way ANOVA with Tukey’s multiple comparison test adjusted p value, the full list of p values can be found in the source data.
Extended data 10.
Extended data 10.. Dual specific GD2 and B7-H3 CAR-T cells with split costimulation and shared CD3z have superior antitumor activity and prevent antigen escape in high tumor burden xenograft model with neuroblastoma cells showing heterogeneous GD2 expression.
(a) Schema of the high tumor burden SH-SY5Y metastatic xenograft NB model using NSG mice inoculated via tail vein injection with FFLuc-SH-SY5Y cells (1 × 10⁶ cell/mouse) and treated 7 days later with CD19.28ζ, GD2.28ζ or GD2.28ζ/B7-H3BB CAR-T cells (1 × 10⁷ cells/mouse) intravenously. (b,c) Representative tumor bioluminescence (BLI) images (b), and tumor BLI kinetics (c) of FFLuc-SH-SY5Y tumor growth (n = 5 mice/group) in the metastatic xenograft NB models shown in (a). (d) Kaplan-Meier survival curve of mice in (B,C), n = 5 mice/group, comparisons of survival curves were determined by Log-rank test, **p = 0.0023 for CD19.28ζ vs. GD2.28ζ, **p = 0.0027 for GD2.28ζ vs. GD2.28ζ/B7-H3.BB.
Figure 1.
Figure 1.. Single or dual antigen targeting and single or dual CD28 or 4-1BB costimulation do not eradicate the tumor in stress conditions.
(a) Schema of the CHLA-255 metastatic xenograft NB model in NSG mice inoculated via tail injection with FFLuc-labelled CHLA-255 cells and treated 14 days later with low doses of CAR-T cells targeting either GD2 (GD2.28ζ and GD2.BBζ) or B7-H3 (B7-H3.28ζ and B7-H3.BBζ) or control CD19.28ζ. (b,c) Representative tumor bioluminescence (BLI) images (b) and BLI kinetics (c) of FFLuc-CHLA-255 tumor growth in the metastatic xenograft NB model shown in (a) (n = 5 mice/group). (d) Kaplan-Meier survival curve of mice in (b, c) (n = 5 mice/group); Comparison of survival curves were determined by Log-rank test, **p = 0.0027 for CD19.28ζ vs. all other groups, **p = 0.0027 for GD2.28ζ vs. B7-H3.BBζ, GD2.BBζ vs. B7-H3.BBζ, and B7-H3.28ζ vs. B7-H3.BBζ, **p = 0.0018 for GD2.28ζ vs. GD2.BBζ, and GD2.28ζ vs. B7-H3.28ζ, **p = 0.0018 for GD2.BBζ vs. B7-H3.28ζ. (e) Schema of the CHLA-255 metastatic xenograft NB model in NSG mice inoculated via tail vein injection with FFLuc-labelled CHLA-255 cells and treated 14 days later with low doses of GD2.28ζ, GD2.28.BBζ, GD2.28ζ/B7-H3.BBζ, and control CD19.28ζ CAR-T cells. (f,g) Representative tumor BLI (f) and BLI kinetics (g) of FFLuc-CHLA-255 tumor growth in the metastatic xenograft NB models shown in (e) (n = 4 or 5 mice/group). (h) Kaplan-Meier survival curve of mice in (f,g) (n = 4 or 5 mice/group); Comparison of survival curves were determined by Log-rank test, **p = 0.0072 for CD19.28ζ vs. GD2.28ζ, **p = 0.0027 for CD19.28ζ vs. GD2.28.BBζ and CD19.28ζ vs. GD2.28ζ/B7-H3.BBζ, *p = 0.0350 for GD2.28ζ vs. GD2.28ζ/B7-H3.BBζ, *p = 0.0157 for GD2.28.BBζ vs. GD2.28ζ/B7-H3.BBζ.
Figure 2.
Figure 2.. One single shared CD3ζ chain is sufficient for transducing the activation signal in dual specific CAR-T cells.
(a) Schematic representation of the retroviral vectors encoding B7-H3.BB, B7-H3.BBζ, GD2.28ζ, 28ζ, dNGFR.28ζ, GD2.28ζ/B7-H3.BB, GD2.28ζ/dNGFR.BB, dNGFR.28ζ/B7-H3.BB and 28ζ/B7-H3.BB. scFv.14.g2a, single-chain variable fragment of the anti-GD2 monoclonal antibody 14.g2a; scFv.276.96, single-chain variable fragment of the anti-B7-H3 monoclonal antibody 376.96; CD8α, the stalk and transmembrane region of human CD8α; CD28, intracellular domain of human CD28; 4-1BB, intracellular domain of human 4-1BB; CD3ζ, intracellular domain of human CD3ζ chain; dNGFR, extracellular domain of human nerve growth factor receptor. (b) Representative flow cytometry plots showing residual GFP-labelled CHLA-255 cells in co-culture experiments in which CAR-T cells and tumor cells were plated at the T cell to tumor cell ratio of 1 to 5, and tumor cells (GFP+) and T cells (CD3+) were numerated by flow cytometry at 5 days after co-culture. Representative of 4 independent experiments. (c-e) Summary of residual tumor cells (e), IFN-γ (d) and IL-2 (e) released by CAR-T cells in the co-culture experiments described in (B). NT, Non-transduced T cell; Data are shown as individual values and the mean + SD, n = 4 independent co-culture with CAR-T cells generated from 4 different donors for NT and dNGFR.28ζ/B7-H3.BB groups, n = 6 independent co-culture with CAR-T cells generated from 6 different donors for other groups; *p = 0.0119 in (e), **p = 0.0027 for GD2.28ζ/B7-H3.BB vs. GD2.28ζ/dNGFR.BB and **p = 0.0051 for GD2.28ζ/B7-H3.BB vs. 28ζ/B7-H3.BB in (d), ***p = 0.0002 for B7-H3.BBζ vs. GD2.28ζ/B7-H3.BB and ***p = 0.0005 for GD2.28ζ vs. GD2.28ζ/B7-H3.BB in (d), ***p = 0.0001 in (e), ****p <0.0001 in (c-e) by one-way ANOVA with Tukey’s multiple comparison test adjusted p value.
Figure 3.
Figure 3.. CD3ζ sharing in the dual CAR relies on CD8α mediated dimerization.
(a, b) T cells co-expressing B7-H3.BB and dNGFR.28ζ or 28ζ were stimulated with the B7-H3-Fc protein followed by incubation with an anti-Fc secondary Ab for 20 minutes at 37°C. Cells were then lysed in Laemmli buffer in non-reducing (without β-mercaptoethanol) (a) or reducing (with β-mercaptoethanol) (b) conditions for 10 minutes at 100°C, and separated on non-reducing gel or reducing gels. Membranes were stained with the anti-CD3ζ antibody. Data are representative of two independent experiments in (a, b). (c) Schematic representation of the retroviral vectors encoding dNGFR.28ζ/B7-H3.BB(CD8m) and 28ζ/B7-H3.BB(CD8m). CD8m, the stalk and transmembrane region of human CD8α that carrying the C164S and C181S mutations. (d-f) Summary of residual tumor cells (d), IFN-γ (e) and IL-2 (f) in the co-culture experiments of CAR-T cells with CHLA-255 at T cell to tumor cell ratio of 1 to 5. Data are shown as individual values and the mean + SD, n = 4 independent co-culture with CAR-T cells generated from 4 different donors; ****p <0.0001 by one-way ANOVA with Tukey’s multiple comparison test adjusted p value. (g) Representative confocal microscopy imaging showing CARs clustering in T cells expressing GFP-tagged GD2.28ζ (green) and B7-H3.BB (red) with and without CAR engagement using either the anti-14g2a idiotype antibody (1A7) or the B7-H3-Fc protein. Blue staining indicates the DAPI. Shown are representative cells. Data are representative of three independent validations. Shown in white are the scale bars that correspond to 5 μm.
Figure 4.
Figure 4.. Dual targeting with split costimulation and shared single CD3ζ promotes sustained antitumor activity.
(a) Representative flow cytometry plots showing the expression of CARs in CAR-T cells. (b) Summary of CARs transduction efficiency (n = 9 independent experiments); data are shown as individual values and the mean + SD. (c) Schema of the multi-rounds co-culture experiment. Tumor cells were seeded in 24-well plates one day prior to the addition of T cells. At day 0, CAR-T cells were added at T cell to tumor cell ratio of 1 to 5. At days 4, 6, and 8, all T cells were collected and transferred into a new well in which 5 × 10⁵ NB cells were seeded one day before. T cells and NB cells were quantified by flow cytometry after each cycle. Supernatants were also collected for cytokine measurements 24 hours after adding T cells for each cycle. (d-k) Multi-rounds co-culture experiments with CHLA-255 (d-g) and LAN-1 (h-k) cells. Quantification of residual tumor cells (d,h) and enumeration of T cells (e,i), and summary of IFN-γ (f,j) and IL-2 (g,k) released by CAR-T cells in the multi-rounds co-culture experiments. Data are shown as individual values and the mean + SD, n = 12 independent co-culture with CAR-T cells generated from 12 different donors; *p <0.05, **p <0.01, ***p <0.001, ****p <0.0001, by one-way ANOVA with Tukey’s multiple comparison test adjusted p value, the full list of p values can be found in the source data. (l) Schema of the CHLA-255 metastatic xenograft NB model. (m,n) Representative tumor BLI images (m) and BLI kinetics (n) of FFLuc-CHLA-255 tumor growth in the tumor models shown in (l) (n = 5 mice/group). (o) Kaplan-Meier survival curve of mice in (m,n) (n = 5 mice/group); **p<0.01 by Log-rank test. (p,q) Summary of circulating CAR-T cells (CD45+CD3+) in mice 14 days (p) and 28 days (q) after CAR-T cell treatment (n = 3 mice in GD2.28ζ group in (q), n = 5 mice/group in other groups), Data are shown as individual values and the mean + SD, **p = 0.0038 for CD19.28ζ vs. GD2.28ζ/B7-H3.BB and **p = 0.0044 for GD2.28ζ vs. GD2.28ζ/B7-H3.BB in (p), adjusted p value by one-way ANOVA with Tukey test for multiple comparison.
Figure 5.
Figure 5.. MSLN and CSPG4 dual targeting CAR-T cells with split co-stimulation and shared CD3ζ show sustained T cell activation and proliferation in vitro and in vivo.
(a) Schematic representation of retroviral vectors encoding CSPG4.BB, CSPG4.BBζ, MSLN.28ζ and MSLN.28ζ/CSPG4.BB CARs. scFv.763.74, single-chain variable fragment of the anti-CSPG4 monoclonal antibody 763.74; Amatuximab, single-chain variable fragment of the anti-MSLN monoclonal antibody amatuximab; CD8α, stalk and transmembrane region of human CD8α; CD28, intracellular domain of human CD28; 4-1BB, intracellular domain of human 4-1BB; CD3ζ, intracellular domain of human CD3ζ chain; F, Flag-tag. (b) Flow cytometry histograms showing the expression of MSLN and CSPG4 in the human mesothelioma cell line H2052. Representative of three independent experiments. (c, d) Summary of the number of residual H2052 cells (c) and T cells (d) in the multi-round co-culture experiments with H2052 tumor cells. Data are shown as individual values and the mean + SD, n = 3 independent experiments with CAR-T cells generated from 3 different donors for the CSPG4.BBζ group, n = 4 independent experiments with CAR-T cells generated from 4 different donors for the other groups; *p <0.05, **p <0.01, ***p <0.001, ****p <0.0001 by one-way ANOVA with Tukey’s multiple comparison test adjusted p value, the full list of p values can be found in the source data. (e) Schema of the H2052 intraperitoneal xenograft model in NSG mice. Eight to 10 week old female NSG mice were inoculated with 3ⅹ106 FFLuc-labelled H2052 cells by intraperitoneal injection, and treated 12 days later with 2 x 10⁶ CD19.28ζ, CSPG4.BBζ, MSLN.28ζ or MSLN.28ζ/CSPG4.BB CAR-T cells by intraperitoneal injection. (f, g) Representative tumor BLI images (f) and BLI kinetics (g) of FFLuc-H2052 tumor growth in the mesothelioma xenograft model shown in (a). (h) Kaplan-Meier survival curve of mice in (f, g)), n = 6 mice for the CD19.28ζ group, n = 8 mice for the other groups; ***p = 0.0003, ****p < 0.0001 by Log-rank test. (i) Detection of circulating CAR-T cells (CD45+CD3+) in mice 19 days after CAR-T cell treatment by flow cytometry; data are shown as individual values and the mean + SD, n = 6 mice for CD19.28ζ group, n = 8 mice for the other groups, *p <0.05 (0.0103 for CSPG4.BBζ vs. Co, 0.0159 for MSLN.28ζ vs. Co), **p = 0.0084 by one-way ANOVA with Tukey’s multiple comparison test adjusted p value.
Figure 6.
Figure 6.. Dual targeting with split co-stimulation and shared D3ζ promote TCR tonic signaling.
(a) Schema of CAR-T cell stimulation and sample preparation for RNAseq. Both GD2.28ζ and GD2.28ζ/B7-H3.BB CAR-T cells were stimulated with 1 μg/mL 1A7 Ab and 1 μg/mL B7-H3-Fc protein coated plate for 24 hours, and then transferred to a new plate without any pre-coating and cultured for 4 more days. CAR-T cells were collected for RNAseq at days 0, 1 and 5. (b) RNAseq analysis of non-stimulated GD2.28ζ and GD2.28ζ/B7-H3.BB CAR-T cells. (c-f)) Gene set enrichment analysis (GSEA) of glycolytic (c), IFN-γ signaling pathways (d), TCR upregulated (e) and downregulated genes (f) in non-stimulated CAR-T cells expressing GD2.28ζ or GD2.28ζ/B7-H3.BB. (g) qPCR validation of TCR-related genes upregulated and down regulated in GD2.28ζ vs. GD2.28ζ/B7-H3.BB CAR-T cells in the absence of antigen stimulation; n = 4 independent donors, and data are shown as individual values and the mean + SD in C, *p <0.05, **p<0.01, two-tailed p value determined by unpaired t test. (h) Basal phosphorylation of CAR-CD3ζ, Erk1/2, and Akt in GD2.28ζ and GD2.28ζ/B7-H3.BB CAR-T cells in the absence of antigen stimulation. Data are from one experiment, representative of three independent experiments. (i) Time course of CAR-CD3ζ, Erk1/2, and Akt phosphorylation in GD2.28ζ and GD2.28ζ/B7-H3.BB CAR-T cells after CAR cross-linking (1A7 Ab for GD2.CAR and B7-H3-Fc protein for B7-H3.CAR). Data are from one experiment, representative of three independent experiments.
Figure 7.
Figure 7.. Dual targeting with split co-stimulation and shared CD3ζ promote CAR-T cell proliferation, and glycolytic and oxidative metabolism.
(a-d) RNAseq analysis of GD2.28ζ and GD2.28ζ/B7-H3.BB CAR-T cells at day 1 (a) and day 5 (b) after CAR stimulation. (c,d) GSEA of the cell cycle (c) and TCR (d) signaling five days after CAR stimulation. (e) Principal component analysis of transcriptome data from GD2.28ζ and GD2.28ζ/B7-H3.BB CAR-T cells at days 0, 1 and 5. (f,g) Proliferation of GD2.28ζ and GD2.28ζ/B7-H3.BB CAR-T cells after CAR stimulation. (f) CAR-T cells were stained with CFSE and then stimulated via 1A7 Ab and B7-H3-Fc protein on day 0, the CFSE dilutions were examined by flow cytometry on days 3 and 6 after stimulation. Representative of 4 independent experiments. (g) T cell numbers were counted by flow cytometry with counting beads in a separate experiment without CFSE staining (n = 5 independent experiments with CAR-T cells generated from 5 different donors), Error bars denote SD, *p < 0.0001 determined by multiple unpaired t test with Holm-Sidak correction for multiple comparison. (h, i) Metabolic profile showing glucose (h) and O2 consumption (i) of GD2.28ζ and GD2.28ζ/B7-H3BB CAR-T cells before CAR activation (resting), and days 1 and 5 after CAR activation. Extracellular acidification rate (ECAR) and O2 consumption rate (OCR) were assayed at different time points in a Seahorse XF24 analyzer, n = 3 independent experiments, Error bars denote SD, *p <0.05, **p <0.01, ***p <0.001,****p <0.0001, two-way ANOVA with Sidak correction for multiple comparison, the full list of p values can be found in the source data. The long and short arrows indicate the time point of adding Rot/AA and 2-DG respectively (h); the black, green and purple arrows indicate the time point of adding oligomycin, FCCP, Rot/AA respectively (i).
Figure 8.
Figure 8.. Dual targeting, split signaling and one single CD3ζ endodomain prevent tumor escape due to antigen loss.
(a) Flow cytometry histogram showing the expression of GD2 and B7-H3 in the NB cell line SH-SY5Y. Representative of 3 independent experiments. (b) Quantification of the GD2 density on the cell membrane of CHLA-255, LAN-1 and SH-SY5Y cells as measured by flow cytometry. The numbers within bars indicate the calculated number of GD2 molecules on the cell membrane of each cell line. Representative of 2 independent experiments. (c) Quantification of residual NB cells labelled with GFP and co-cultured with CD19.28ζ, GD2.28ζ and GD2.28ζ/B7-H3.BB CAR-T cells at the T cell to tumor cell ratio of 1 to 5. On day 5, NB cells (GFP+) and CAR-T cells (CD3+) were enumerated by flow cytometry. Data are shown as individual values and the mean + SD, n = 10 independent co-culture with CAR-T cells generated from 10 different donors; **p = 0.0011, ****p <0.0001 by one-way ANOVA with Tukey’s multiple comparison test adjusted p value. (d,e) Summary of IFN-γ (d) and IL-2 (e) released by CAR-T cells in the culture supernatant after 24 hours of co-culture with NB cells as measured by ELISA. Data are shown as individual values and the mean + SD, n = 10 independent co-culture with CAR-T cells generated from 10 different donors; ***p = 0.0001 for CD19.28ζ vs. GD2.28ζ/B7-H3.BB and ***p = 0.0002 for GD2.28ζ vs. GD2.28ζ/B7-H3.BB in (d), ****p <0.0001 in (e) by one-way ANOVA with Tukey’s multiple comparison test adjusted p value. (f) Schema of the SH-SY5Y metastatic xenograft NB model in NSG mice inoculated intravenously via tail vein with 5 x 10⁵ of FFLuc-SH-SY5Y cells and treated 7 days later with 1 x 10⁷ CD19.28ζ, GD2.28ζ and GD2.28ζ/B7-H3.BB CAR-T cells intravenously. (g,h) Representative tumor BLI images (g) and BLI kinetics (h) of FFLuc-SH-SY5Y tumor growth in the metastatic xenograft NB models shown in (f) (n = 4 or 5 mice/group). (i) Kaplan-Meier survival curve of mice in (g,h) (n = 4 or 5 mice/group); **p = 0.0027 by Log-rank test. (j) GD2 and B7-H3 expression levels in tumor cells collected from mice treated with CD19.28ζ or GD2.28ζ CAR-T cells were analyzed by flow cytometry at the time of the euthanasia. Representative of 3 independent experiments.

Comment in

  • Splitting signals drives CARs further.
    King-Peoples TR, Posey AD Jr. King-Peoples TR, et al. Nat Cancer. 2021 Sep;2(9):873-875. doi: 10.1038/s43018-021-00257-x. Nat Cancer. 2021. PMID: 35121869 No abstract available.

References

    1. Fucà G, Reppel L, Landoni E, Savoldo B & Dotti G Enhancing Chimeric Antigen Receptor T-Cell Efficacy in Solid Tumors. Clin Cancer Res 26, 2444–2451, doi:10.1158/1078-0432.Ccr-19-1835 (2020). - DOI - PMC - PubMed
    1. June CH & Sadelain M Chimeric Antigen Receptor Therapy. N Engl J Med 379, 64–73, doi:10.1056/NEJMra1706169 (2018). - DOI - PMC - PubMed
    1. Grada Z et al. TanCAR: A Novel Bispecific Chimeric Antigen Receptor for Cancer Immunotherapy. Mol Ther Nucleic Acids 2, e105, doi:10.1038/mtna.2013.32 (2013). - DOI - PMC - PubMed
    1. Ahn S et al. Cancer Immunotherapy with T Cells Carrying Bispecific Receptors That Mimic Antibodies. Cancer Immunol Res 7, 773–783, doi:10.1158/2326-6066.Cir-18-0636 (2019). - DOI - PMC - PubMed
    1. Zah E, Lin MY, Silva-Benedict A, Jensen MC & Chen YY T Cells Expressing CD19/CD20 Bispecific Chimeric Antigen Receptors Prevent Antigen Escape by Malignant B Cells. Cancer Immunol Res 4, 498–508, doi:10.1158/2326-6066.Cir-15-0231 (2016). - DOI - PMC - PubMed

Publication types