. 2021 Sep 24;2(11):100232.
doi: 10.1016/j.jtocrr.2021.100232. eCollection 2021 Nov.

CADM1 and SPC25 Gene Mutations in Lung Cancer Patients With Idiopathic Pulmonary Fibrosis

Affiliations

CADM1 and SPC25 Gene Mutations in Lung Cancer Patients With Idiopathic Pulmonary Fibrosis

Aya Fukuizumi et al. JTO Clin Res Rep. .

Abstract

Introduction: To investigate the genomic profiles of patients with lung cancer with idiopathic pulmonary fibrosis (IPF-LC), mechanism of carcinogenesis, and potential therapeutic targets.

Methods: We analyzed 29 matched, surgically resected, cancerous and noncancerous lung tissues (19 IPF-LC and 10 non-IPF-LC) by whole-exome sequencing and bioinformatics analysis and established a medical-engineering collaboration with the Department of Engineering of the Tokyo University of Science.

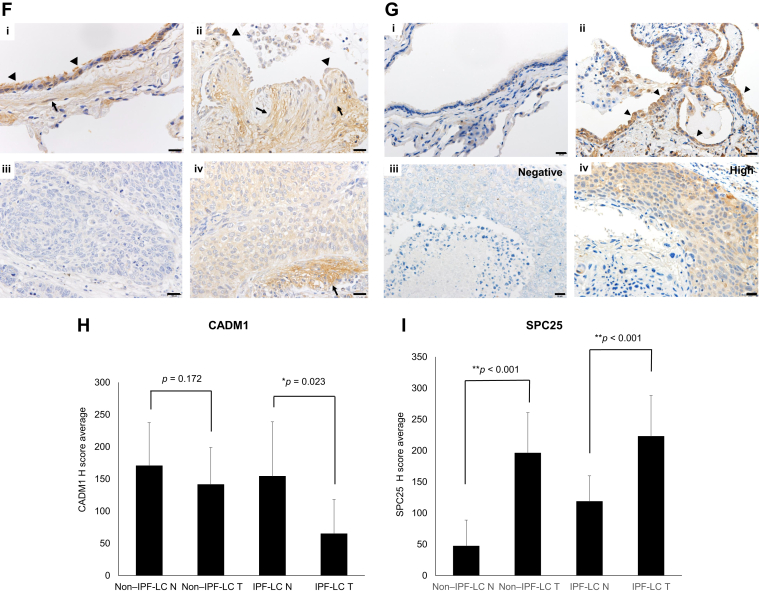
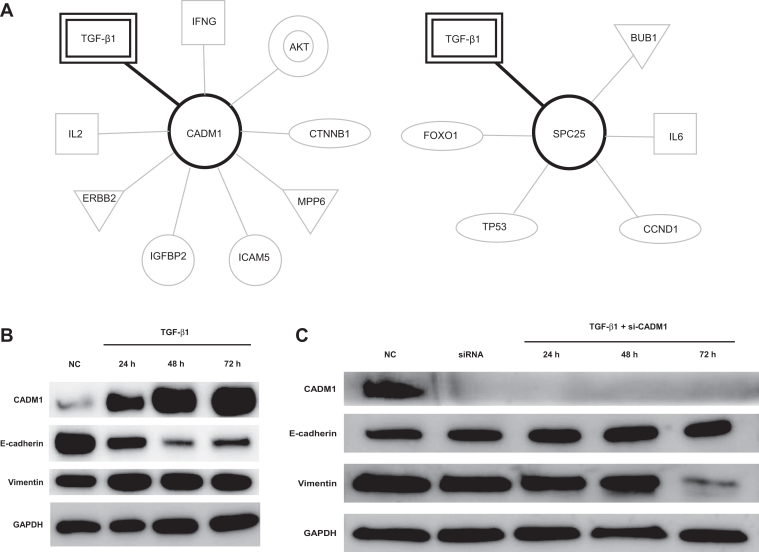
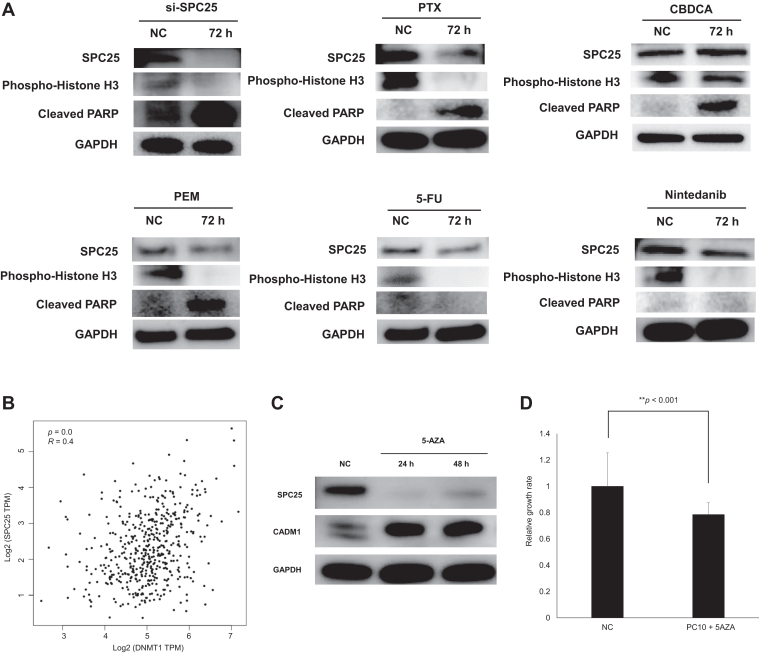
Results: In IPF-LC, CADM1 and SPC25 were mutated at a frequency of 47% (9 of 19) and 53% (10 of 19), respectively. Approximately one-third of the IPF-LC cases (7 of 19; 36%) had both mutations. Pathway analysis revealed that these two genes are involved in transforming growth factor-β1 signaling. CADM1 and SPC25 gene mutations decreased the expression of CADM1 and increased that of SPC25 revealing transforming growth factor-β1-induced epithelial-to-mesenchymal transition and cell proliferation in lung cancer cells. Furthermore, treatment with paclitaxel and DNMT1 inhibitor suppressed SPC25 expression.

Conclusions: CADM1 and SPC25 gene mutations may be novel diagnostic markers and therapeutic targets for IPF-LC.

Keywords: CADM1; Idiopathic pulmonary fibrosis; Lung cancer; SPC25; Whole-exome sequencing.


Figures

Figure 1
Figure 1
Background and outline of the study. (A) DFS in the IPF-LC and non–IPF-LC groups. Kaplan–Meier curve revealing DFS in IPF-LC and non–IPF-LC. The p values were determined using the log-rank test. (B) Outline of the study design for the identification of candidate genes in IPF-LC. (C) Algorithm of the random forest method. (D) Of the 85 gene mutations identified, 40 were specifically observed in IPF-LC. The figure reveals the distribution of the 40 gene mutations in all 29 cases. The distribution of all 85 gene mutations is found in Supplementary Figure 1B. Red: both N/T mutated; yellow: T mutated. (E) Mutation status of CADM1 and SPC25 in all 29 cases. (F) Schema of CADM1 gene mutation (c.1026_1027insACC). (G) Schema of SPC25 gene mutation (c.551-4_551-2delCTA). Random forests are an ensemble machine learning method consisting of a multitude of decision trees. Random forests classify positive and negative samples and estimate the importance of each feature in classification problems. Using random forests, recursive feature elimination was applied to the 8868 mutations. Because we focused on the presence and absence of gene alternations, we substituted negative 1 for reference and positive 1 for Het or Homo and converted our data to a binary feature. DFS, disease-free survival; HGVS, Human Genome Variation Society; IPF-LC, patients with lung cancer with idiopathic pulmonary fibrosis; mt, mutant; N, normal; No., number; qRT-PCR, quantitative reverse-transcriptase polymerase chain reaction; T, tumor; UTR, untranslated region; wt, wild-type.
Figure 1
Figure 1
Background and outline of the study. (A) DFS in the IPF-LC and non–IPF-LC groups. Kaplan–Meier curve revealing DFS in IPF-LC and non–IPF-LC. The p values were determined using the log-rank test. (B) Outline of the study design for the identification of candidate genes in IPF-LC. (C) Algorithm of the random forest method. (D) Of the 85 gene mutations identified, 40 were specifically observed in IPF-LC. The figure reveals the distribution of the 40 gene mutations in all 29 cases. The distribution of all 85 gene mutations is found in Supplementary Figure 1B. Red: both N/T mutated; yellow: T mutated. (E) Mutation status of CADM1 and SPC25 in all 29 cases. (F) Schema of CADM1 gene mutation (c.1026_1027insACC). (G) Schema of SPC25 gene mutation (c.551-4_551-2delCTA). Random forests are an ensemble machine learning method consisting of a multitude of decision trees. Random forests classify positive and negative samples and estimate the importance of each feature in classification problems. Using random forests, recursive feature elimination was applied to the 8868 mutations. Because we focused on the presence and absence of gene alternations, we substituted negative 1 for reference and positive 1 for Het or Homo and converted our data to a binary feature. DFS, disease-free survival; HGVS, Human Genome Variation Society; IPF-LC, patients with lung cancer with idiopathic pulmonary fibrosis; mt, mutant; N, normal; No., number; qRT-PCR, quantitative reverse-transcriptase polymerase chain reaction; T, tumor; UTR, untranslated region; wt, wild-type.
Figure 2
Figure 2
CADM1 and SPC25 expression in IPF-LC and non–IPF-LC. The mRNA expression of CADM1 and SPC25 was detected using RT-PCR. The changes in expression levels are represented as fold increase compared with the control. The p values were determined using Student’s t test. (A) CADM1 expression between non–IPF-LC and IPF-LC. (B) CADM1 expression between CADM1 mutants and wild-type cases. (C) SPC25 expression between non–IPF-LC and IPF-LC. (D) SPC25 expression between SPC25 mutants and wild-type cases. (E) Prognostic value of CADM1 and SPC25 derived from the Kaplan–Meier plotter. Data were derived from a total of 1925 patients with lung cancer (865 adenocarcinoma, 675 squamous cell carcinoma). The OS data were based on caArray, GSE 14814, GSE 19188, GSE 29013, GSE 30219, GSE 31210, GSE 3141, GSE 31908, GSE 37745, GSE 43580, GSE 4573, GSE 50081, GSE 8894, and TCGA. (F) Representative CADM1 protein expression in normal lung (i) and lung tissues from patients with associated UIP (ii) and NSCLC (iii, iv). Ciliated bronchiolar epithelium and smooth muscle cells had moderate intensity in normal lung (i). Regenerated epithelial cells (arrows) and fibroblasts (arrow heads) in fibroblastic foci from patients with UIP had weak-to-moderate staining (ii). Large cell neuroendocrine carcinoma had negative immunostaining (iii). Squamous cell carcinoma had moderate immunostaining, whereas interstitial cells (arrows) of the desmoplasia had intense immunostaining (iv). Scale bars represent 20 μm. (G) Representative SPC25 protein expression in normal lung (i) and lung tissues from patients with associated UIP (ii) and NSCLC (iii, iv). Metaplastic bronchiolar epithelial cells lining honeycomb lungs had increased signals (arrow heads) (ii) compared with the controls (i) and NSCLC (iv). The staining status is indicated (iii: negative; iv: high). Scale bars represent 20 μm. (H) The average H-score of CADM1 between non–IPF-LC and IPF-LC. (I) The average H-score of SPC25 between non–IPF-LC and IPF-LC. CADM1 and SPC25 expression levels were scored using the following scale: no expression, 0; low expression, 1+; and high expression, 2+ and 3+. The score was based on the fraction of positive cells (0%–100%). The total score was calculated by multiplying the intensity score and the fraction score, producing a total range of 0 to 300. GSE, Gene Expression Omnibus Series; H-score, histoscore; HR, hazard ratio; IPF-LC, patients with lung cancer with idiopathic pulmonary fibrosis; mt, mutant; N, normal; OS, overall survival; RT-PCR, reverse-transcriptase polymerase chain reaction; T, tumor; TCGA, The Cancer Genome Atlas; UIP, usual interstitial pneumonia; wt, wild-type.
Figure 2
Figure 2
CADM1 and SPC25 expression in IPF-LC and non–IPF-LC. The mRNA expression of CADM1 and SPC25 was detected using RT-PCR. The changes in expression levels are represented as fold increase compared with the control. The p values were determined using Student’s t test. (A) CADM1 expression between non–IPF-LC and IPF-LC. (B) CADM1 expression between CADM1 mutants and wild-type cases. (C) SPC25 expression between non–IPF-LC and IPF-LC. (D) SPC25 expression between SPC25 mutants and wild-type cases. (E) Prognostic value of CADM1 and SPC25 derived from the Kaplan–Meier plotter. Data were derived from a total of 1925 patients with lung cancer (865 adenocarcinoma, 675 squamous cell carcinoma). The OS data were based on caArray, GSE 14814, GSE 19188, GSE 29013, GSE 30219, GSE 31210, GSE 3141, GSE 31908, GSE 37745, GSE 43580, GSE 4573, GSE 50081, GSE 8894, and TCGA. (F) Representative CADM1 protein expression in normal lung (i) and lung tissues from patients with associated UIP (ii) and NSCLC (iii, iv). Ciliated bronchiolar epithelium and smooth muscle cells had moderate intensity in normal lung (i). Regenerated epithelial cells (arrows) and fibroblasts (arrow heads) in fibroblastic foci from patients with UIP had weak-to-moderate staining (ii). Large cell neuroendocrine carcinoma had negative immunostaining (iii). Squamous cell carcinoma had moderate immunostaining, whereas interstitial cells (arrows) of the desmoplasia had intense immunostaining (iv). Scale bars represent 20 μm. (G) Representative SPC25 protein expression in normal lung (i) and lung tissues from patients with associated UIP (ii) and NSCLC (iii, iv). Metaplastic bronchiolar epithelial cells lining honeycomb lungs had increased signals (arrow heads) (ii) compared with the controls (i) and NSCLC (iv). The staining status is indicated (iii: negative; iv: high). Scale bars represent 20 μm. (H) The average H-score of CADM1 between non–IPF-LC and IPF-LC. (I) The average H-score of SPC25 between non–IPF-LC and IPF-LC. CADM1 and SPC25 expression levels were scored using the following scale: no expression, 0; low expression, 1+; and high expression, 2+ and 3+. The score was based on the fraction of positive cells (0%–100%). The total score was calculated by multiplying the intensity score and the fraction score, producing a total range of 0 to 300. GSE, Gene Expression Omnibus Series; H-score, histoscore; HR, hazard ratio; IPF-LC, patients with lung cancer with idiopathic pulmonary fibrosis; mt, mutant; N, normal; OS, overall survival; RT-PCR, reverse-transcriptase polymerase chain reaction; T, tumor; TCGA, The Cancer Genome Atlas; UIP, usual interstitial pneumonia; wt, wild-type.
Figure 3
Figure 3
CADM1 and SPC25 involved in TGF-β1 signaling. (A) CADM1 and SPC25 IPA pathway. Pathway analysis revealed that both CADM1 and SPC25 are involved in TGF-β1 signaling. (B) Exposure to TGF-β1 induced CADM1 expression and EMT. A549 cells were incubated with TGF-β1 (5 ng/mL) for different time periods. Exposure to TGF-β1 induced CADM1 expression. The expression of epithelial marker E-cadherin was down-regulated by TGF-β1 stimulation in a time-dependent manner. The expression of mesenchymal marker VIM was up-regulated. (C) CADM1 inhibition suppressed the TGF-β1–induced EMT. Pooled synthetic siRNA duplexes targeting CADM1 were transfected into A549 cells (25 nM). At 24 h after transfection, the cells were stimulated with TGF-β1 (5 ng/mL) in serum-free Opti-MEM for a further 72 h before harvest. CADM1 inhibition suppressed TGF-β1–induced EMT. (D) CADM1 inhibition activated cell proliferation. A549 cells were transfected with siRNA duplexes targeting CADM1 (25 nM). CADM1 inhibition activated cell proliferation. (E) Exposure to TGF-β1 induced SPC25 expression. A549 cells were incubated with TGF-β1 (5 ng/mL) for different time periods. Exposure to TGF-β induced SPC25 expression. (F) SPC25 inhibition suppressed the TGF-β1–induced EMT and proliferation. Pooled synthetic siRNA duplexes targeting SPC25 were transfected into A549 cells (25 nM). At 24 h after transfection, the cells were stimulated with TGF-β1 (5 ng/mL) in serum-free Opti-MEM for a further 72 h before harvest. (G) At 72 h after transfection with si-SPC25, CCK-8 solution (10 μL) was added to each well to evaluate cell proliferation using the MTT assay. Inhibition of SPC25 suppressed cell proliferation. CCK-8, Cell Counting Kit—8; EMT, epithelial-to-mesenchymal transition; GAPDH, glyceraldehyde-3-phosphate dehydrogenase; h, hour; IFNG, interferon gamma; IL2, interleukin 2; IL6, interleukin 6; IPA, ingenuity pathway analysis; IPF-LC, patients with lung cancer patients with idiopathic pulmonary fibrosis; MEM, minimal essential medium; NC, negative control; p-AKT, phosphorylated-AKT; p-ERK, phosphorylated-ERK; si-CADM1, small interfering-CADM1; siRNA, small interfering RNA; si-SPC25, small interfering-SPC25.
Figure 3
Figure 3
CADM1 and SPC25 involved in TGF-β1 signaling. (A) CADM1 and SPC25 IPA pathway. Pathway analysis revealed that both CADM1 and SPC25 are involved in TGF-β1 signaling. (B) Exposure to TGF-β1 induced CADM1 expression and EMT. A549 cells were incubated with TGF-β1 (5 ng/mL) for different time periods. Exposure to TGF-β1 induced CADM1 expression. The expression of epithelial marker E-cadherin was down-regulated by TGF-β1 stimulation in a time-dependent manner. The expression of mesenchymal marker VIM was up-regulated. (C) CADM1 inhibition suppressed the TGF-β1–induced EMT. Pooled synthetic siRNA duplexes targeting CADM1 were transfected into A549 cells (25 nM). At 24 h after transfection, the cells were stimulated with TGF-β1 (5 ng/mL) in serum-free Opti-MEM for a further 72 h before harvest. CADM1 inhibition suppressed TGF-β1–induced EMT. (D) CADM1 inhibition activated cell proliferation. A549 cells were transfected with siRNA duplexes targeting CADM1 (25 nM). CADM1 inhibition activated cell proliferation. (E) Exposure to TGF-β1 induced SPC25 expression. A549 cells were incubated with TGF-β1 (5 ng/mL) for different time periods. Exposure to TGF-β induced SPC25 expression. (F) SPC25 inhibition suppressed the TGF-β1–induced EMT and proliferation. Pooled synthetic siRNA duplexes targeting SPC25 were transfected into A549 cells (25 nM). At 24 h after transfection, the cells were stimulated with TGF-β1 (5 ng/mL) in serum-free Opti-MEM for a further 72 h before harvest. (G) At 72 h after transfection with si-SPC25, CCK-8 solution (10 μL) was added to each well to evaluate cell proliferation using the MTT assay. Inhibition of SPC25 suppressed cell proliferation. CCK-8, Cell Counting Kit—8; EMT, epithelial-to-mesenchymal transition; GAPDH, glyceraldehyde-3-phosphate dehydrogenase; h, hour; IFNG, interferon gamma; IL2, interleukin 2; IL6, interleukin 6; IPA, ingenuity pathway analysis; IPF-LC, patients with lung cancer patients with idiopathic pulmonary fibrosis; MEM, minimal essential medium; NC, negative control; p-AKT, phosphorylated-AKT; p-ERK, phosphorylated-ERK; si-CADM1, small interfering-CADM1; siRNA, small interfering RNA; si-SPC25, small interfering-SPC25.
Figure 4
Figure 4
Effects of therapeutic agents on SPC25 in IPF-LC. (A) Effects of therapeutic agents on SPC25 in IPF-LC. A549 cells were transfected with pooled synthetic siRNA duplexes targeting SPC25 (25 nM). A549 cells were treated with 10 μM PTX, CBDCA, PEM, 5-FU, or nintedanib. Treatment with PTX, PEM, 5-FU, and nintedanib significantly down-regulated the expression of SPC25; however, this effect was not observed after treatment with CBDCA. (B) Correlation between SPC25 and DNMT1. GEPIA2 database analysis revealed that the expression levels of SPC25 and DNMT1 were positively correlated in NSCLC. (C) 5-AZA suppressed the expression of SPC25 and increased that of CADM1. PC-10 cells were treated with 5-AZA (10 μM). Treatment of PC-10 cells with 5-AZA down-regulated the expression of SPC25 and reactivated CADM1. (D) Treatment with 5-AZA suppressed the proliferation of PC-10 cells. 5-AZA, 5-azacytidine; 5-FU, 5-fluorouracil; CBDCA, carboplatin; GAPDH, glyceraldehyde-3-phosphate dehydrogenase; GEPIA2, Gene Expression Profiling Interactive Analysis 2; h, hour; IPF-LC, patients with lung cancer with idiopathic pulmonary fibrosis; NC, negative control; PEM, pemetrexed; PTX, paclitaxel; siRNA, small-interfering RNA; si-SPC25, small interfering-SPC25; TPM, transcript count per million.

References

    1. Ozawa Y., Suda T., Naito T. Cumulative incidence of and predictive factors for lung cancer in IPF. Respirology. 2009;14:723–728. - PubMed
    1. Tomassetti S., Gurioli C., Ryu J.H. The impact of lung cancer on survival of idiopathic pulmonary fibrosis. Chest. 2015;147:157–164. - PubMed
    1. Fukuizumi A., Minegishi Y., Omori M. Weekly paclitaxel in combination with carboplatin for advanced non-small-cell lung cancer complicated by idiopathic interstitial pneumonias: a single-arm phase II study. Int J Clin Oncol. 2019;24:1543–1548. - PubMed
    1. Minegishi Y., Kuribayashi H., Kitamura K. The feasibility study of carboplatin plus etoposide for advanced small cell lung cancer with idiopathic interstitial pneumonias. J Thorac Oncol. 2011;6:801–807. - PubMed
    1. Minegishi Y., Gemma A., Homma S. Acute exacerbation of idiopathic interstitial pneumonias related to chemotherapy for lung cancer: nationwide surveillance in Japan. ERJ Open Res. 2020;6:00184–2019. - PMC - PubMed

LinkOut - more resources