

First and second COVID-19 waves in Brazil: A cross-sectional study of patients' characteristics related to hospitalization and in-hospital mortality
- PMID: 34746913
- PMCID: PMC8557995
- DOI: 10.1016/j.lana.2021.100107
First and second COVID-19 waves in Brazil: A cross-sectional study of patients' characteristics related to hospitalization and in-hospital mortality
Abstract
Background: Background The second wave of the COVID-19 pandemic was more aggressive in Brazil compared to other countries around the globe. Considering the Brazilian peculiarities, we analyze the in-hospital mortality concerning socio-epidemiological characteristics of patients and the health system of all states during the first and second waves of COVID-19.
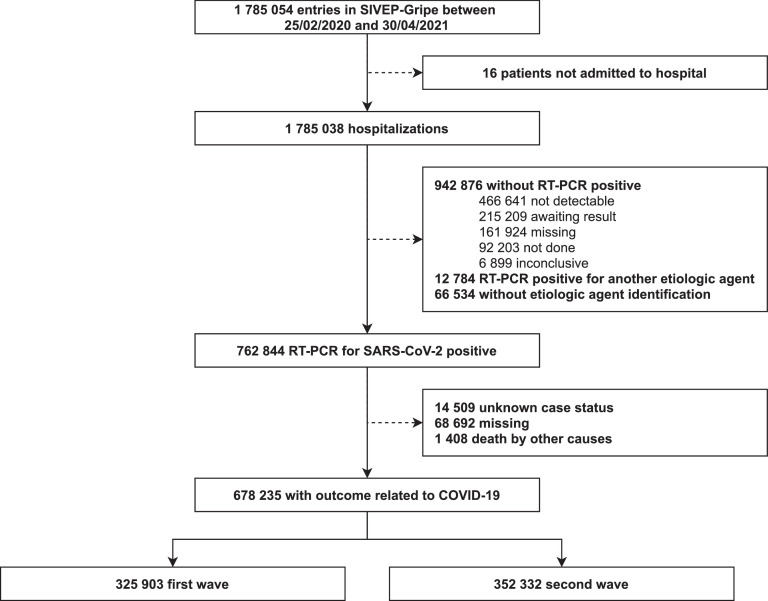
Methods: We performed a cross-sectional study of hospitalized patients with positive RT-PCR for SARS-CoV-2 in Brazil. Data was obtained from the Influenza Epidemiological Surveillance Information System (SIVEP-Gripe) and comprised the period from February 25, 2020, to April 30, 2021, separated in two waves on November 5, 2020. We performed a descriptive study of patients analyzing socio-demographic characteristics, symptoms, comorbidities, and risk factors stratified by age. In addition, we analyzed in-hospital and intensive care unit (ICU) mortality in both waves and how it varies in each Brazilian state.
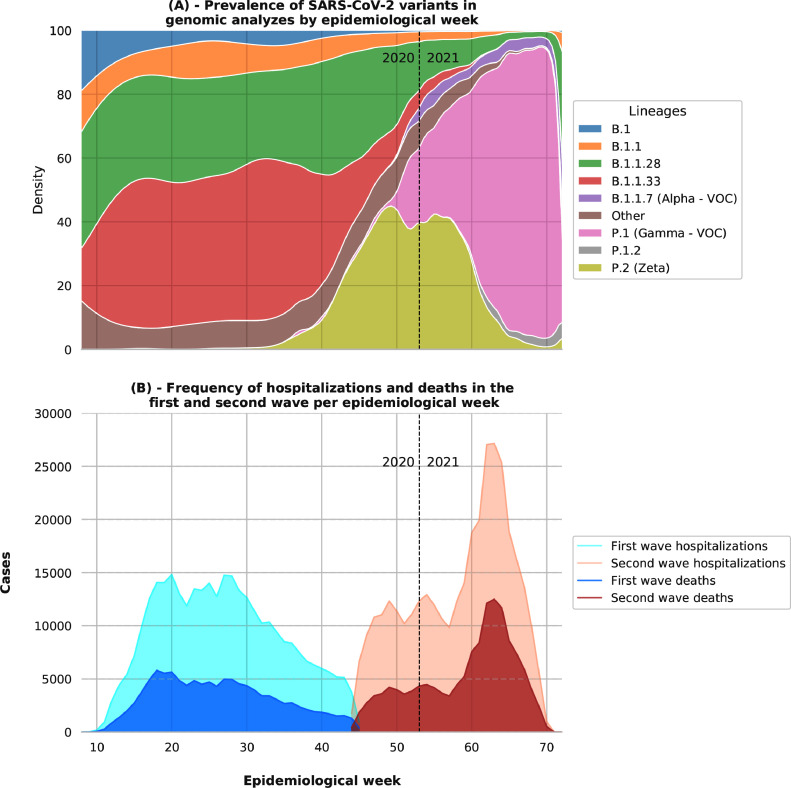
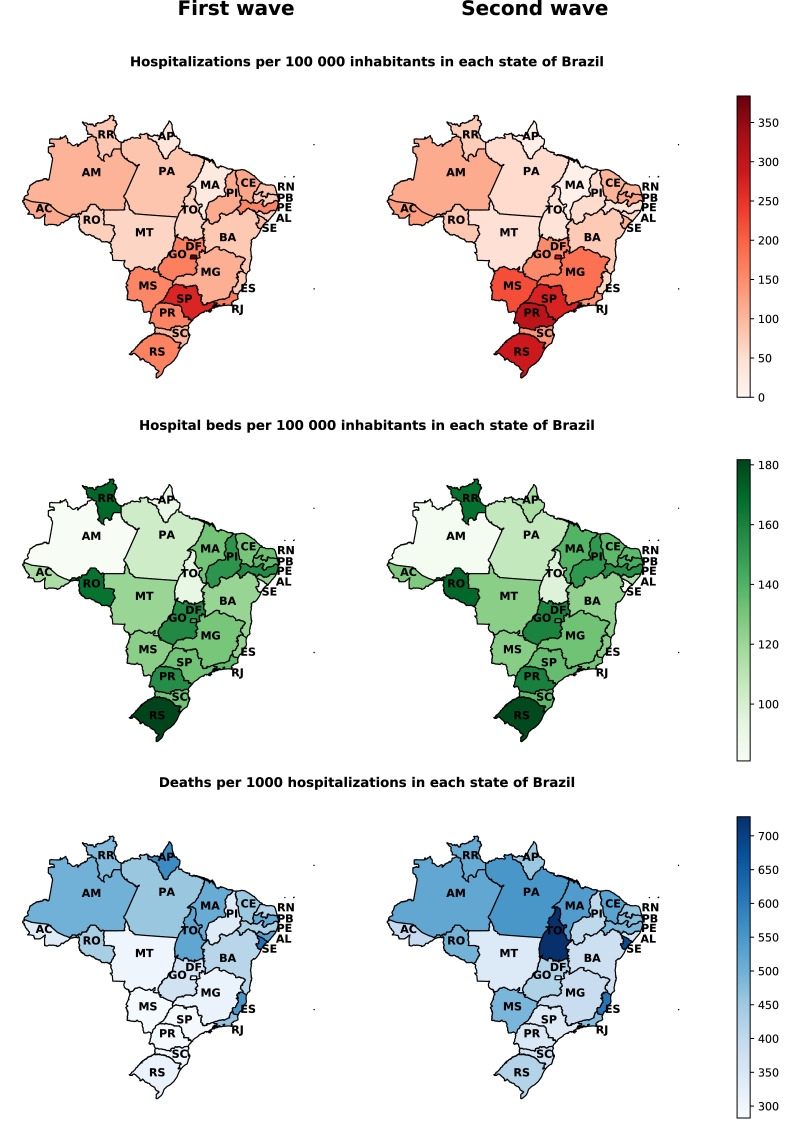
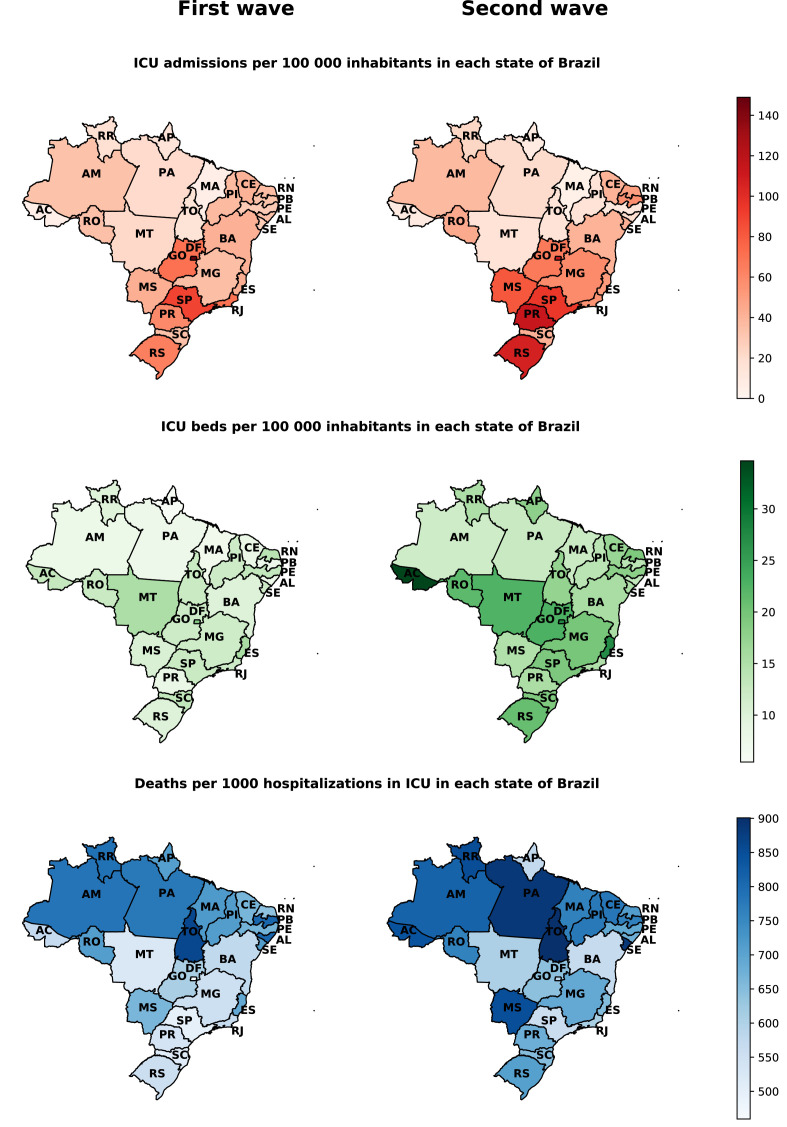
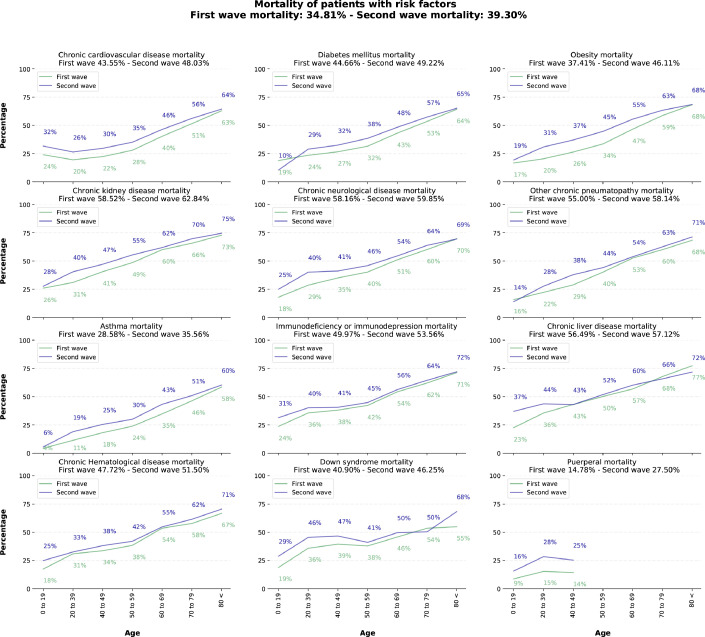
Findings: Between February 25, 2020 and April 30, 2021, 678 235 patients were admitted with a positive RT-PCR for SARS-CoV-2, with 325 903 and 352 332 patients for the first and second wave, respectively. The mean age of patients was 59 65 (IQR 48 0 - 72 0). In total, 379 817 (56 00%) patients had a risk factor or comorbidity. In-hospital mortality increased from 34 81% in the first to 39 30% in the second wave. In the second wave, there were more ICU admissions, use of non-invasive and invasive ventilation, and increased mortality for younger age groups. The southern and southeastern regions of Brazil had the highest hospitalization rates per 100 000 inhabitants. However, the in-hospital mortality rate was higher in the northern and northeastern states of the country. Racial differences were observed in clinical outcomes, with White being the most prevalent hospitalized population, but with Blacks/Browns (Pardos) having higher mortality rates. Younger age groups had more considerable differences in mortality as compared to groups with and without comorbidities in both waves.
Interpretation: We observed a more considerable burden on the Brazilian hospital system throughout the second wave. Furthermore, the north and northeast of Brazil, which present lower Human Development Indexes, concentrated the worst in-hospital mortality rates. The highest mortality rates are also shown among vulnerable social groups. Finally, we believe that the results can help to understand the behavior of the COVID-19 pandemic in Brazil, helping to define public policies, allocate resources, and improve strategies for vaccination of priority groups.
Funding: Coordinating Agency for Advanced Training of Graduate Personnel (CAPES) (C.F. 001), and National Council for Scientific and Technological Development (CNPq) (No. 309537/2020-7).
Keywords: COVID-19; Healthcare; In-hospital mortality; Pandemic response; SARS-CoV-2.
© 2021 The Author(s).
Figures
References
-
- Lipsitch M., Swerdlow D.L., Finelli L. Defining the epidemiology of COVID-19-studies needed. New England Journal of Medicine. 2020;382(13):1194–1196. - PubMed
-
- Taylor L. COVID-19: is Manaus the final nail in the coffin for natural herd immunity? BMJ. 2021;372 - PubMed
-
- DATASUS, Ministry of Health. SRAG 2021 - Severe acute respiratory syndrome database - including data from COVID-19. 2021. https://opendatasus.saude.gov.br/dataset/bd-srag-2021(accessed on April 30, 2021).
LinkOut - more resources
Full Text Sources
Miscellaneous
