. 2021 Dec 2;49(21):12119-12135.
doi: 10.1093/nar/gkab1015.

The human telomeric proteome during telomere replication

Affiliations

The human telomeric proteome during telomere replication

Chih-Yi Gabriela Lin et al. Nucleic Acids Res. .

Abstract

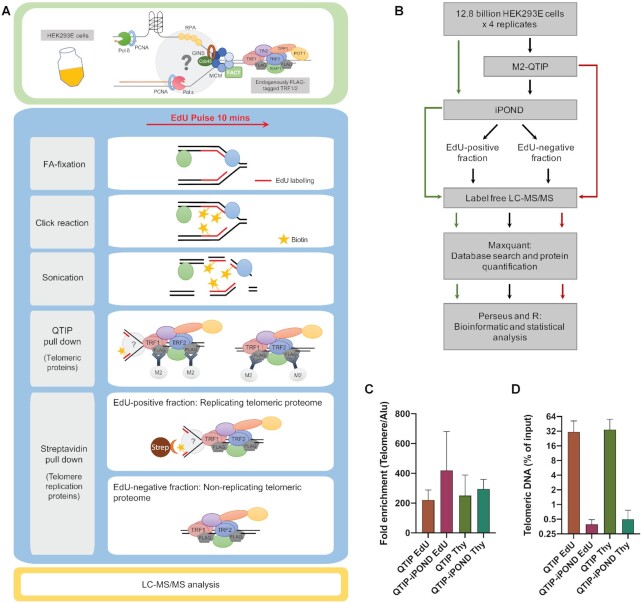
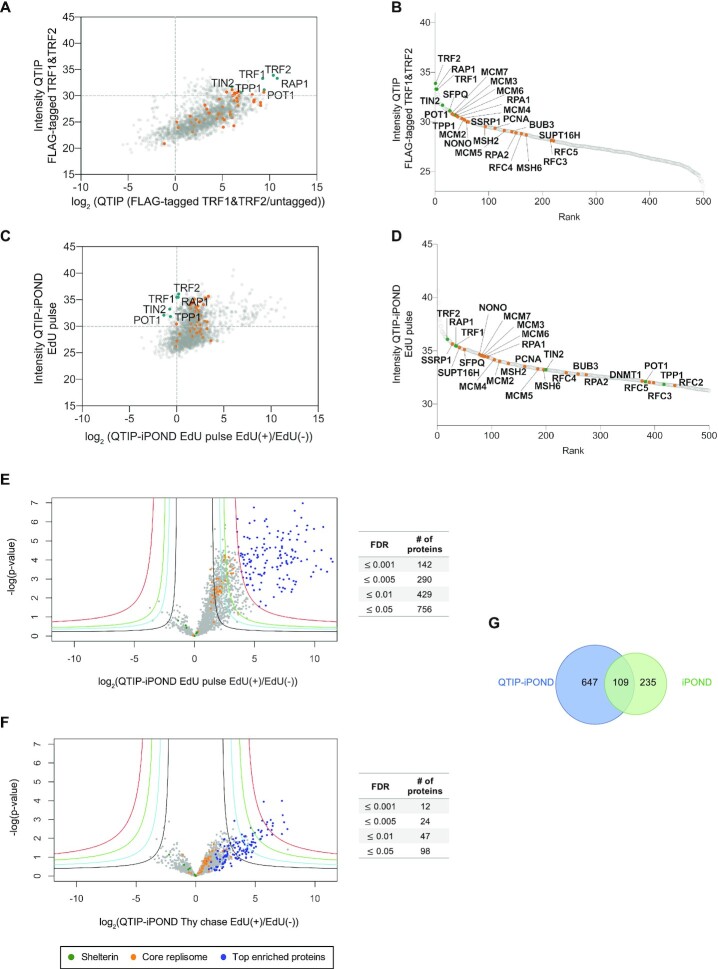
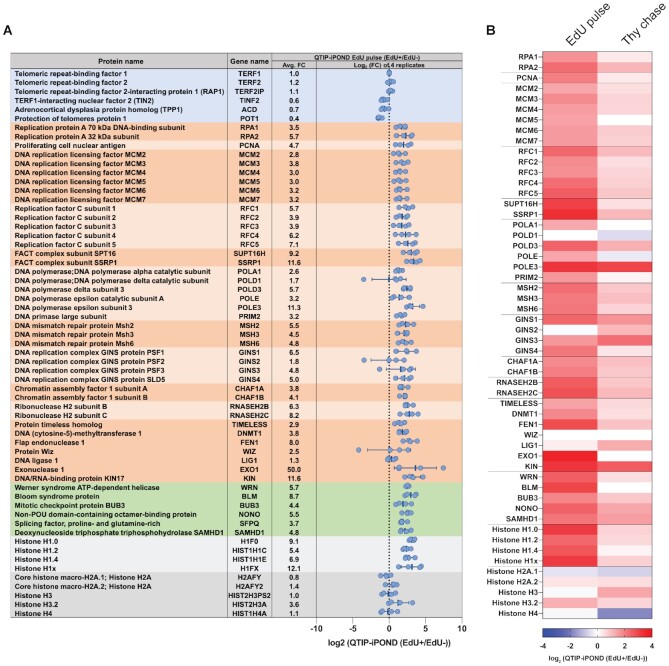
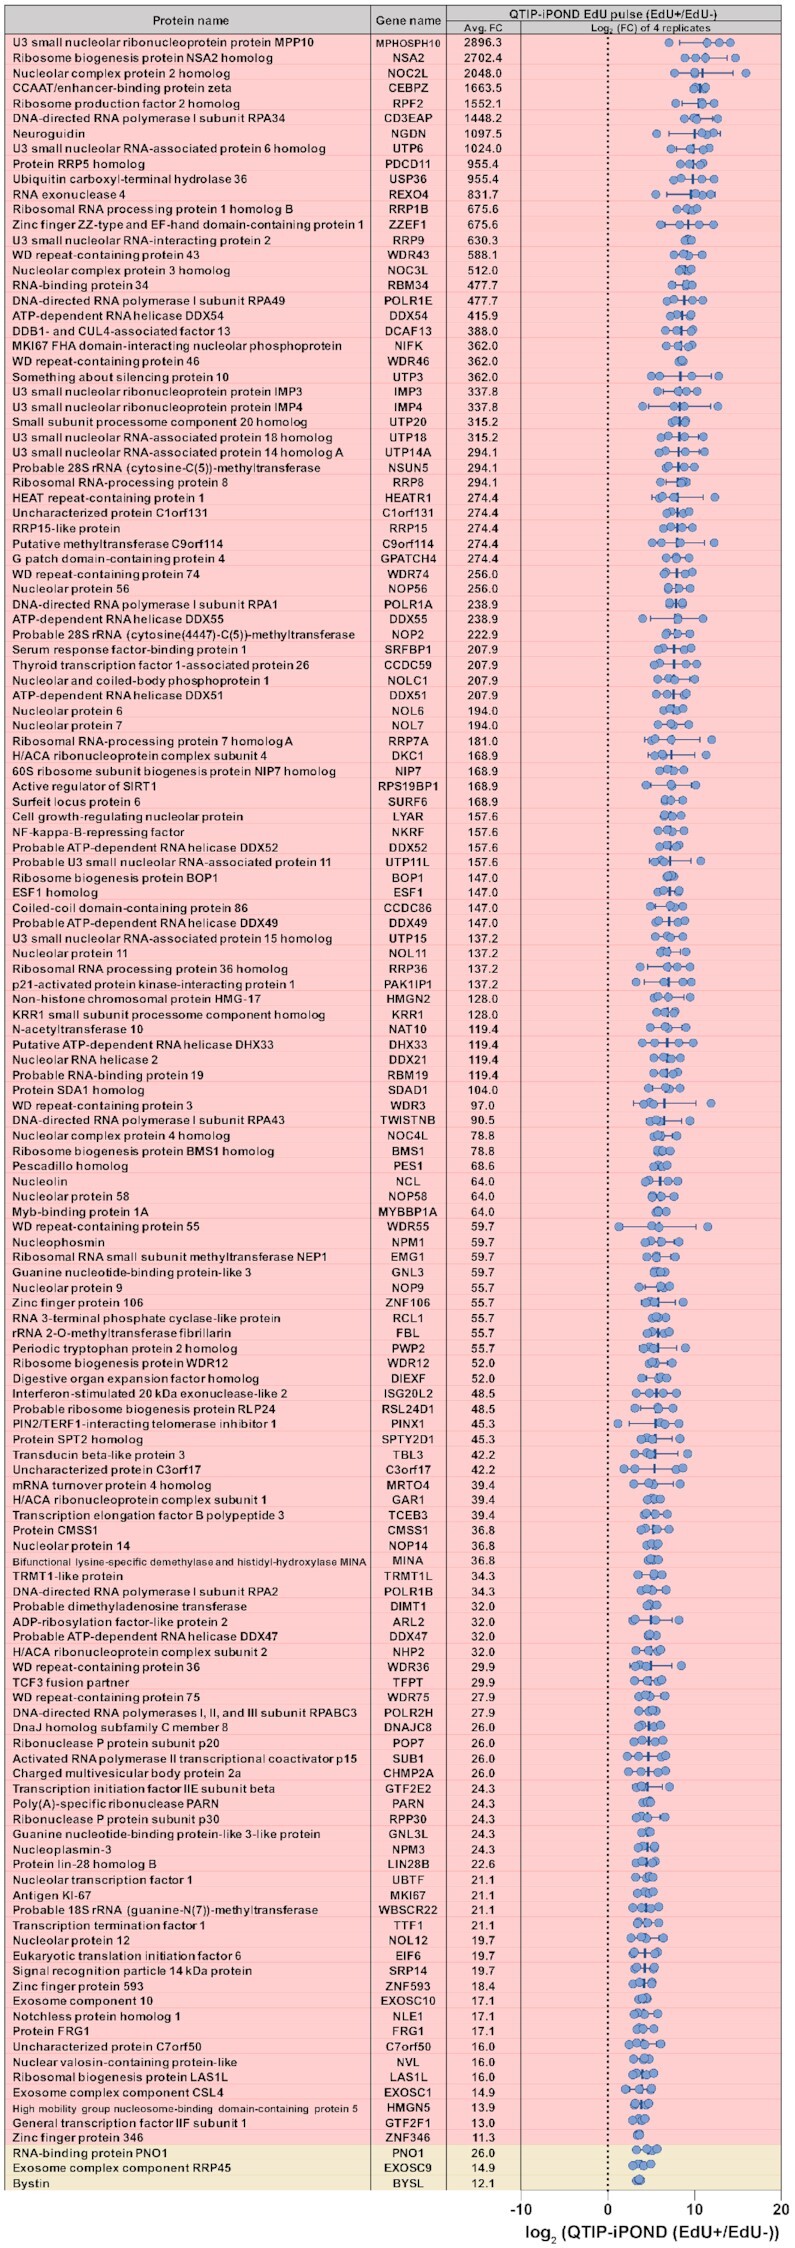
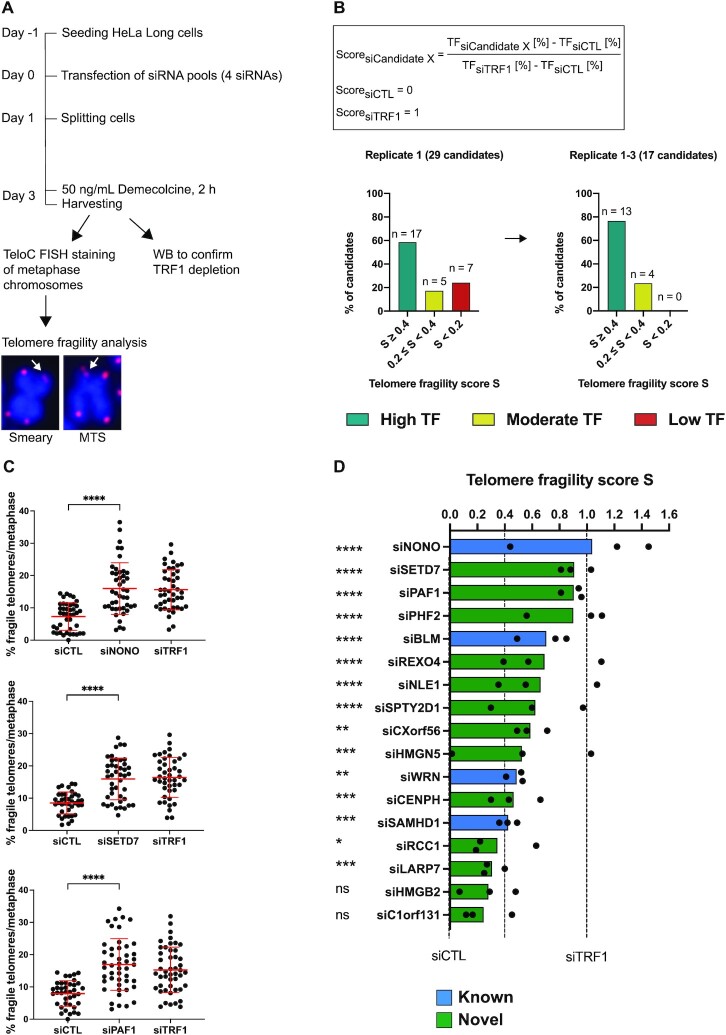
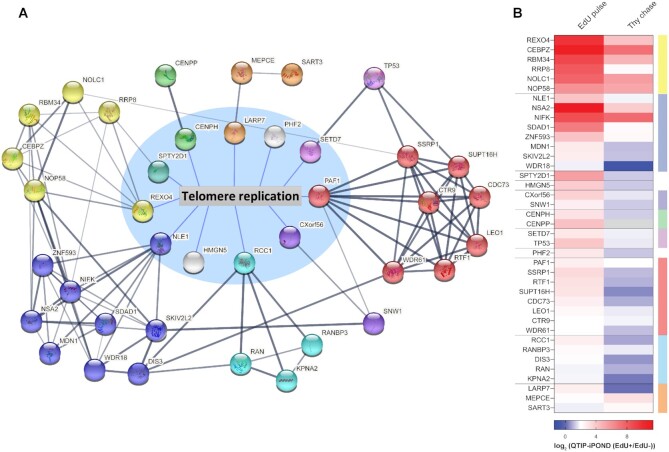
Telomere shortening can cause detrimental diseases and contribute to aging. It occurs due to the end replication problem in cells lacking telomerase. Furthermore, recent studies revealed that telomere shortening can be attributed to difficulties of the semi-conservative DNA replication machinery to replicate the bulk of telomeric DNA repeats. To investigate telomere replication in a comprehensive manner, we develop QTIP-iPOND - Quantitative Telomeric chromatin Isolation Protocol followed by isolation of Proteins On Nascent DNA - which enables purification of proteins that associate with telomeres specifically during replication. In addition to the core replisome, we identify a large number of proteins that specifically associate with telomere replication forks. Depletion of several of these proteins induces telomere fragility validating their importance for telomere replication. We also find that at telomere replication forks the single strand telomere binding protein POT1 is depleted, whereas histone H1 is enriched. Our work reveals the dynamic changes of the telomeric proteome during replication, providing a valuable resource of telomere replication proteins. To our knowledge, this is the first study that examines the replisome at a specific region of the genome.


Figures

Figure 1.
Figure 1.
Experimental scheme of QTIP-iPOND. (A) Upper panel: In the HEK293E cells, TRF1 and TRF2 were endogenously tagged with FLAG-tags. Lower panel: To identify proteins near telomere replication forks, we combined QTIP with iPOND. Upon purification of telomeric chromatin with QTIP, the replicating telomeric proteome was separated from the non-replicating telomeric proteome using streptavidin beads. FA: formaldehyde; Strep: streptavidin. (B) Flow chart of the QTIP-iPOND experiment. 12.8 billion cells were used for each replicate, which was analyzed by QTIP-iPOND (9.6 billion cells for EdU pulse and Thy chase), iPOND (1.6 billion cells for EdU pulse and Thy chase) and QTIP (1.6 billion cells for FLAG-tagged TRF1/2 HEK293E and non-tagged WT HEK293E). (C) Telomeric DNA recovery. The data was obtained by dot blot of three biological replicates. (D) Fold enrichment of telomeric DNA over Alu element. The data was obtained by dot blot of three biological replicates. Data are represented as mean + standard deviation.
Figure 2.
Figure 2.
Protein distribution upon QTIP-iPOND. (A) Comparison of enrichment of core replication proteins to shelterin components by QTIP. (B) Rank of 500 top enriched proteins in QTIP EdU pulse samples. (C) Enrichment of core replication proteins with respect to shelterin components upon QTIP-iPOND in EdU pulse EdU(+) samples. (D) Rank of 500 top enriched proteins in QTIP-iPOND EdU pulse EdU(+) samples. Intensity: label-free quantification (LFQ) intensity. (E) Comparison of QTIP-iPOND enriched proteins in EdU(+) versus EdU(−) samples in the EdU pulse experiment. (F) Comparison of QTIP-iPOND enriched proteins in EdU(+) versus EdU(−) samples in the Thy chase experiment. Red curves: FDR = 0.001; green curves: FDR = 0.005; cyan curves: FDR = 0.01; black curves: FDR = 0.05; s0 = 3. (A–F) Orange dots represent core replication proteins; dark green dots represent shelterin components; blue dots represent the 142 top enriched proteins with FDR ≤ 0.001 in QTIP-iPOND EdU pulse samples. (G) Comparison of QTIP-iPOND (756 proteins) and iPOND (344 proteins) EdU pulse enriched proteins.
Figure 3.
Figure 3.
List of selected proteins identified in the QTIP-iPOND experiments. (A) Proteins in the blue background are shelterin components; proteins in the dark/light orange background are core replication proteins; proteins in the green background are telomere replication proteins; proteins in the dark/light grey background are histones. Each blue dot indicates the log2(EdU(+)/EdU(−)) in one replicate. Avg. FC: the average fold change of EdU(+)/EdU(−). Data are represented as mean ± standard deviation. (B) Heatmap of replication proteins and histones shown in (A) indicating the log2(EdU(+)/EdU(−)) in the QTIP-iPOND EdU pulse and Thy chase.
Figure 4.
Figure 4.
List of the 142 proteins that were top-enriched by QTIP-iPOND (EdU pulse EdU(+) samples). The list indicates the 142 proteins for which the FDR is below 0.001. Each blue dot indicates the log2(EdU(+)/EdU(−)) ratio of one replicate. Proteins in the red background are specifically enriched in telomere replication; proteins in the light-yellow background were enriched by both, QTIP-iPOND and iPOND (EdU pulse). Avg. FC: the average fold change of EdU(+)/EdU(−). Data are represented as mean ± standard deviation.
Figure 5.
Figure 5.
Candidate validation through telomere fragility analysis. (A) Experimental outline of siRNA screen for telomere fragility using HeLa-Long cells (with an average telomere length of 33 kb). MTS: multiple telomeric signals. Pixel size of FISH images was reduced 4-fold for illustration. (B) Telomere fragility score calculation and score for tested candidates. The percentage of fragile telomeres per metaphase was determined for each depleted protein candidate and compared to TRF1-depleted cells (siTRF1) and control transfected cells that had been transfected with a non-targeting siRNA (siCTL). A score of 1 corresponds to the amount of telomere fragility detected in TRF1-depleted cells and a score of 0 to the amount of telomere fragility detected in the negative control (siCTL). TF: telomere fragility. (C) Representative data of 3 biological replicates of siRNA screen for the top three hits. Percentage of fragile telomeres per metaphase is shown. Red bars represent the mean and standard deviation. (D) Telomere fragility score for three biological replicates with 39–51 metaphases analyzed per condition in total. Blue and green indicate factors that have known or novel functions in counteracting telomere fragility, respectively. (C, D) Statistical analysis was done by unpaired t-test with Welch's correction to compare the percentage of fragile telomeres per metaphase of siCandidate X to siCTL. * <0.05, ** <0.01, *** <0.001, **** <0.0001.
Figure 6.
Figure 6.
Interactome of telomere replication proteins. (A) Network of proteins that is composed of groups of validated candidates. Proteins inside the circle with a blue background are here validated telomere replication proteins. Proteins outside the blue circle are the most confident hits provided by STRING enriched in QTIP-iPOND EdU pulse EdU(+). Nodes with the same color indicate proteins in the same group. (B) Heatmap of proteins in the network upon QTIP-iPOND EdU pulse and Thy chase. Color code on the right corresponds to the color of nodes in (A). Note that the white baseline is at 2.

References

    1. de Lange T. Shelterin-mediated telomere protection. Annu. Rev. Genet. 2018; 52:223–247. - PubMed
    1. Bartocci C., Diedrich J.K., Ouzounov I., Li J., Piunti A., Pasini D., Yates J.R., Lazzerini Denchi E.. Isolation of chromatin from dysfunctional telomeres reveals an important role for ring1b in NHEJ-mediated chromosome fusions. Cell Rep. 2014; 7:1320–1332. - PMC - PubMed
    1. Déjardin J., Kingston R.E.. Purification of proteins associated with specific genomic loci. Cell. 2009; 136:175–186. - PMC - PubMed
    1. Grolimund L., Aeby E., Hamelin R., Armand F., Chiappe D., Moniatte M., Lingner J.. A quantitative telomeric chromatin isolation protocol identifies different telomeric states. Nat. Commun. 2013; 4:2848. - PubMed
    1. Fagagna F. d’Adda di, Reaper P.M., Clay-Farrace L., Fiegler H., Carr P., von Zglinicki T., Saretzki G., Carter N.P., Jackson S.P.. A DNA damage checkpoint response in telomere-initiated senescence. Nature. 2003; 426:194–198. - PubMed

Publication types