. 2021 Nov 18;125(45):12401-12412.
doi: 10.1021/acs.jpcb.1c05820. Epub 2021 Nov 8.

Resolving Dynamics in the Ensemble: Finding Paths through Intermediate States and Disordered Protein Structures

Affiliations

Resolving Dynamics in the Ensemble: Finding Paths through Intermediate States and Disordered Protein Structures

Adam K Nijhawan et al. J Phys Chem B. .

Abstract

Proteins have been found to inhabit a diverse set of three-dimensional structures. The dynamics that govern protein interconversion between structures happen over a wide range of time scales─picoseconds to seconds. Our understanding of protein functions and dynamics is largely reliant upon our ability to elucidate physically populated structures. From an experimental structural characterization perspective, we are often limited to measuring the ensemble-averaged structure both in the steady-state and time-resolved regimes. Generating kinetic models and understanding protein structure-function relationships require atomistic knowledge of the populated states in the ensemble. In this Perspective, we present ensemble refinement methodologies that integrate time-resolved experimental signals with molecular dynamics models. We first discuss integration of experimental structural restraints to molecular models in disordered protein systems that adhere to the principle of maximum entropy for creating a complete set of ensemble structures. We then propose strategies to find kinetic pathways between the refined structures, using time-resolved inputs to guide molecular dynamics trajectories and the use of inference to generate tailored stimuli to prepare a desired ensemble of protein states.


Conflict of interest statement

The authors declare no competing financial interest.

Figures

Figure 1.
Figure 1.
Time scales for protein dynamics grouped by technique.–,,,– Relevant protein time scales are plotted vs the number of residues for the system of interest for studies done using MD (purple), TRXSS (green), IR (blue), and trp-fluorescence (orange). MD studies are primarily located around smaller proteins and shorter time scales. The shaded gray region between 10 and 120 residues indicates the region primarily consisting of IDPs.
Figure 2.
Figure 2.
A flowchart for the SAXS-guided MD following an environmental perturbation. TRXSS difference curves can be used as an experimental input to biased-MD simulations toward sampling experimentally relevant conformations. The scattering profile of the MD structure is calculated on-the-fly, and a harmonic constraint is used to drive the structure toward the experimental input.
Figure 3.
Figure 3.
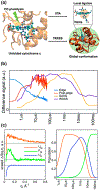
Experimentally tracking photolyzed ligation of heme protein. (a) Scheme of the cytochrome c heme active site. XTA tracks the local heme structural dynamics, and TRXSS tracks the global conformational changes. (b) Difference signal kinetics from XTA (edge and post-edge) overlaid with those from TRXSS (SAXS and WAXS). The post-edge and WAXS signatures correspond to the same process, bridging the spatial and temporal extents of the experiment. (c) Species-associated difference (SAD) on the left and their corresponding relative measured population on the right for the two intermediates, UM and UH, and the final unfolded state, FM. Reproduced from ref with permission from the Royal Society of Chemistry.
Figure 4.
Figure 4.
(a, b) Overlay of trajectories sampled during (a) unbiased and (b) four-replica refinement MD simulations. (c, d) Distribution of radii of gyration sampled during MD simulations. The divergence in structures is quantified by Kullback–Leibler (KL) (red) and Jensen–Shannon (JSD) (orange) divergences. Adapted with permission from ref . Copyright 2019 American Chemical Society.
Figure 5.
Figure 5.
Insulin dimer MSM analysis. (a) Overview of native and twisted insulin dimer conformations. (b) Network plot color-coded by non-hydrogen RMSD with respect to the crystal structure. (c) Network plot for the identified states native (N), twisted (T), and intermediates (18, 99, 80, 45, 16) with darker lines indicating a higher transition probability based on the transition matrix. (d, e) Calculated kinetics for the exchange between native and twisted states, initially starting from the twisted state. Adapted with permission from ref . Copyright 2021 American Chemical Society.

References

    1. Liu Y; Wang X; Liu B A Comprehensive Review and Comparison of Existing Computational Methods for Intrinsically Disordered Protein and Region Prediction. Briefings Bioinf. 2019, 20, 330–346. - PubMed
    1. DeForte S; Uversky VN Order, Disorder, and Everything in Between. Molecules 2016, 21, 1090. - PMC - PubMed
    1. Michaelis M; Hildebrand N; Meißner RH; Wurzler N; Li Z; Hirst JD; Micsonai A; Kardos J; Delle Piane M; Colombi Ciacchi L Impact of the Conformational Variability of Oligopeptides on the Computational Prediction of Their Cd Spectra. J. Phys. Chem. B 2019, 123, 6694–6704. - PubMed
    1. Hsu DJ; Leshchev D; Kosheleva I; Kohlstedt KL; Chen LX Unfolding Bovine A-Lactalbumin with T-jump: Characterizing Disordered Intermediates Via Time-Resolved X-Ray Solution Scattering and Molecular Dynamics Simulations. J. Chem. Phys 2021, 154, 105101. - PMC - PubMed
    1. Davis CM; Reddish MJ; Dyer RB Dual Time-Resolved Temperature-Jump Fluorescence and Infrared Spectroscopy for the Study of Fast Protein Dynamics. Spectrochim. Acta, Part A 2017, 178, 185–191. - PMC - PubMed

Publication types