. 2022 Jan 18;66(1):e0148921.
doi: 10.1128/AAC.01489-21. Epub 2021 Nov 8.

Telmisartan Restricts Chikungunya Virus Infection In Vitro and In Vivo through the AT1/PPAR-γ/MAPKs Pathways

Affiliations

Telmisartan Restricts Chikungunya Virus Infection In Vitro and In Vivo through the AT1/PPAR-γ/MAPKs Pathways

Saikat De et al. Antimicrob Agents Chemother. .

Abstract

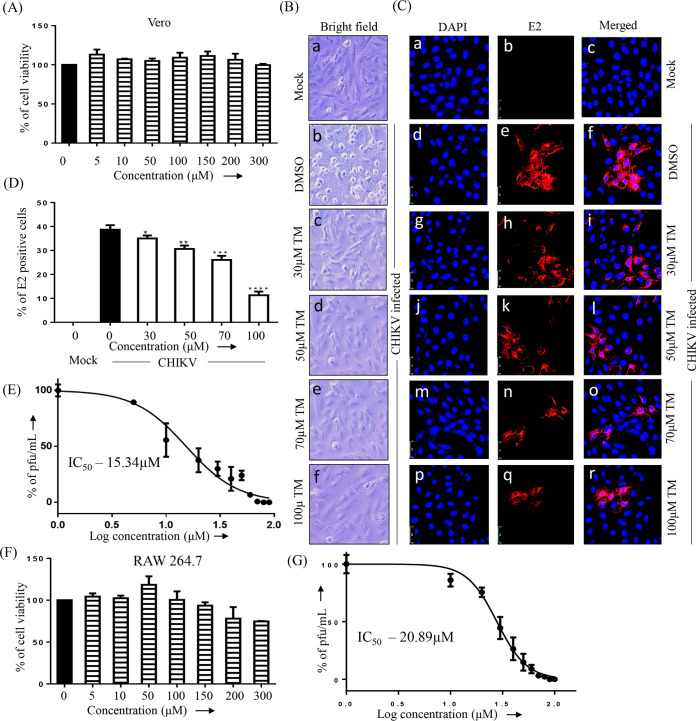
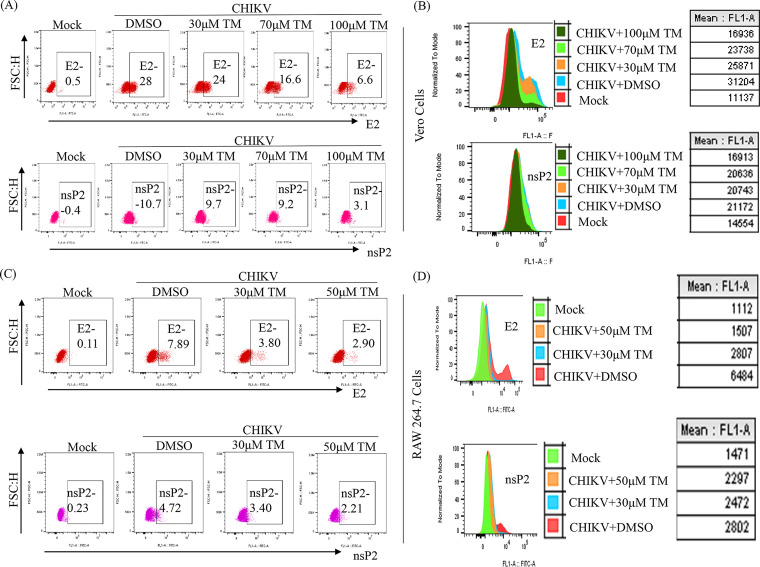
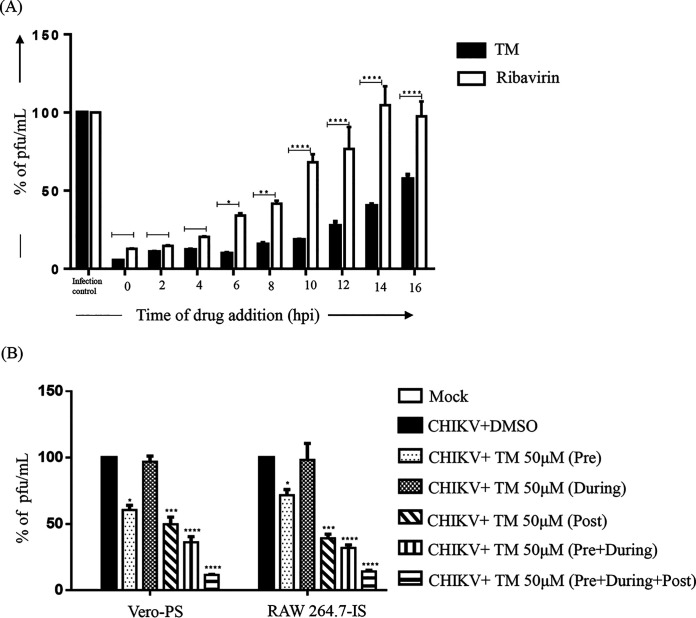
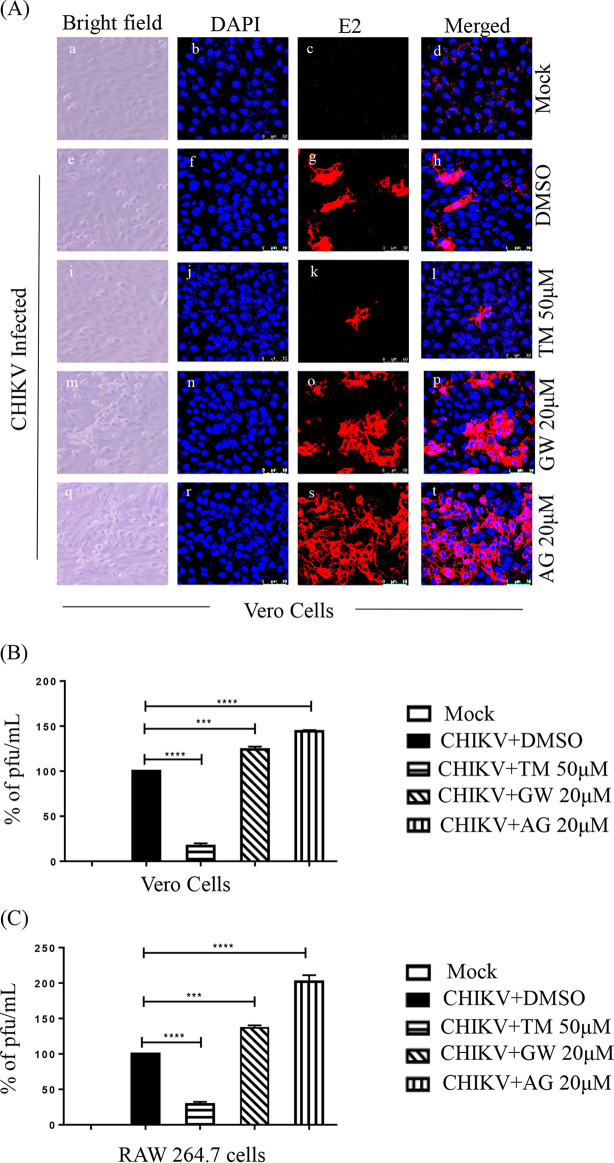
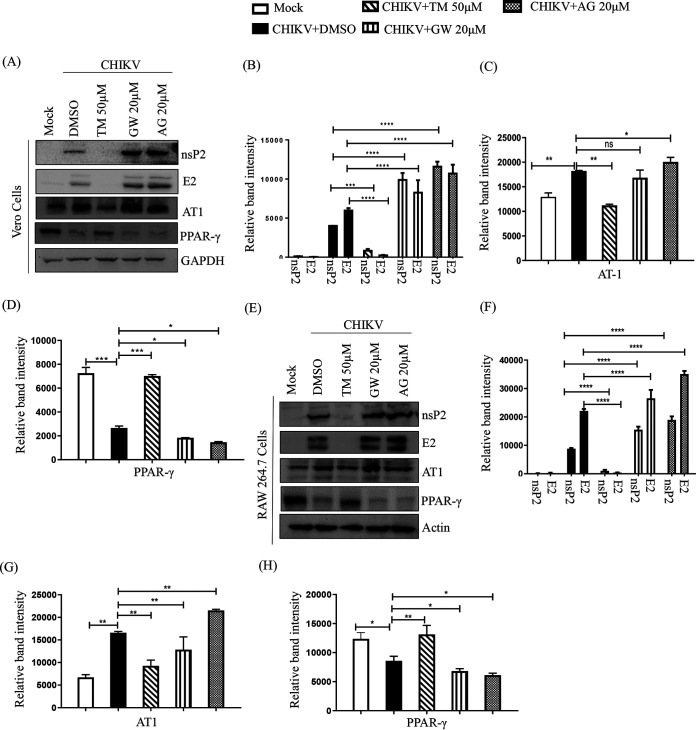
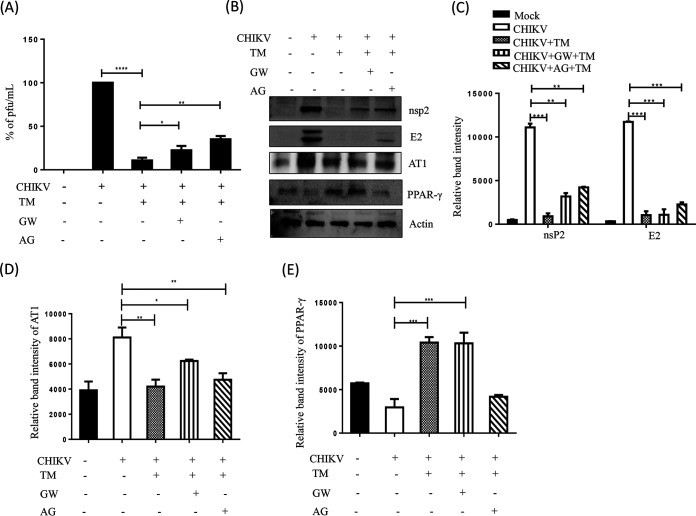
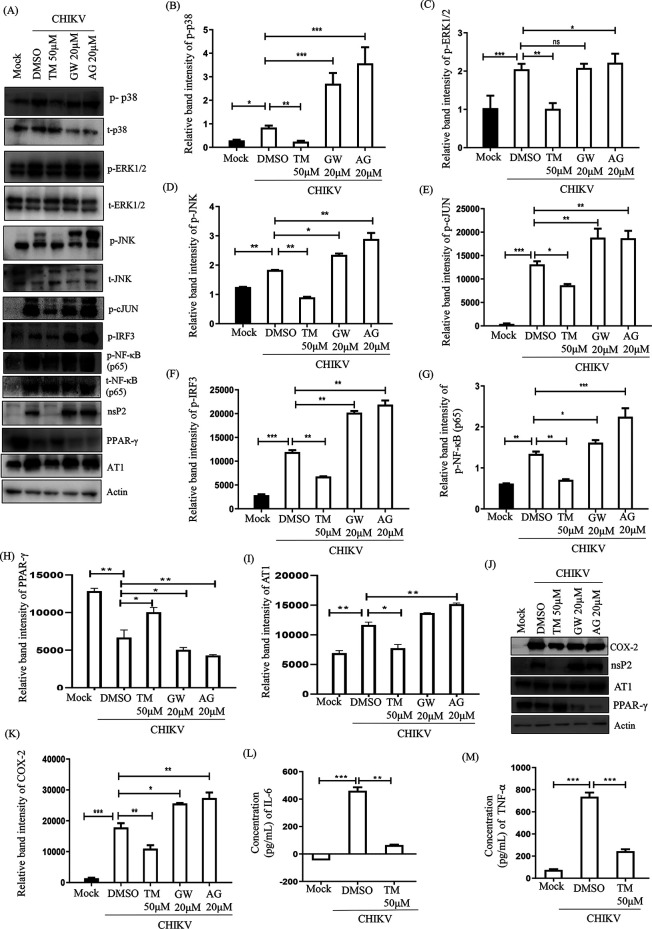
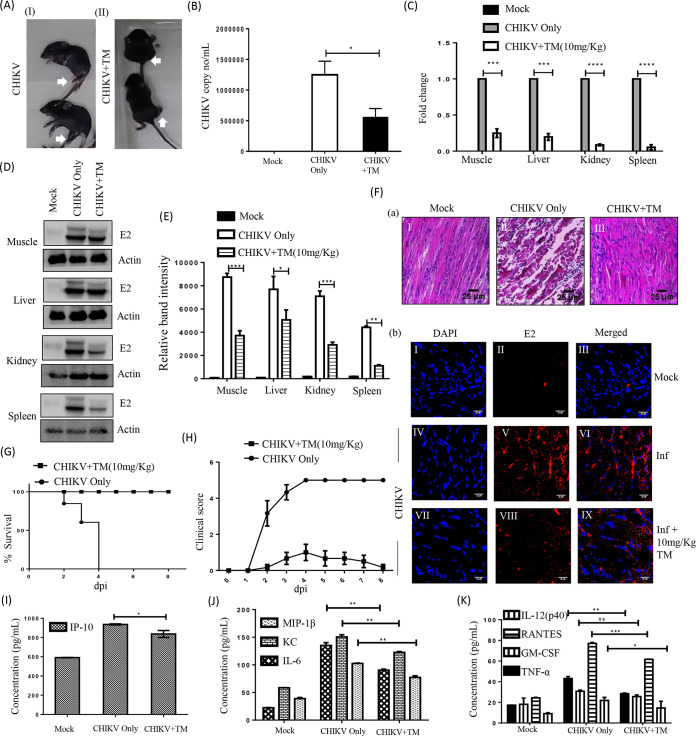
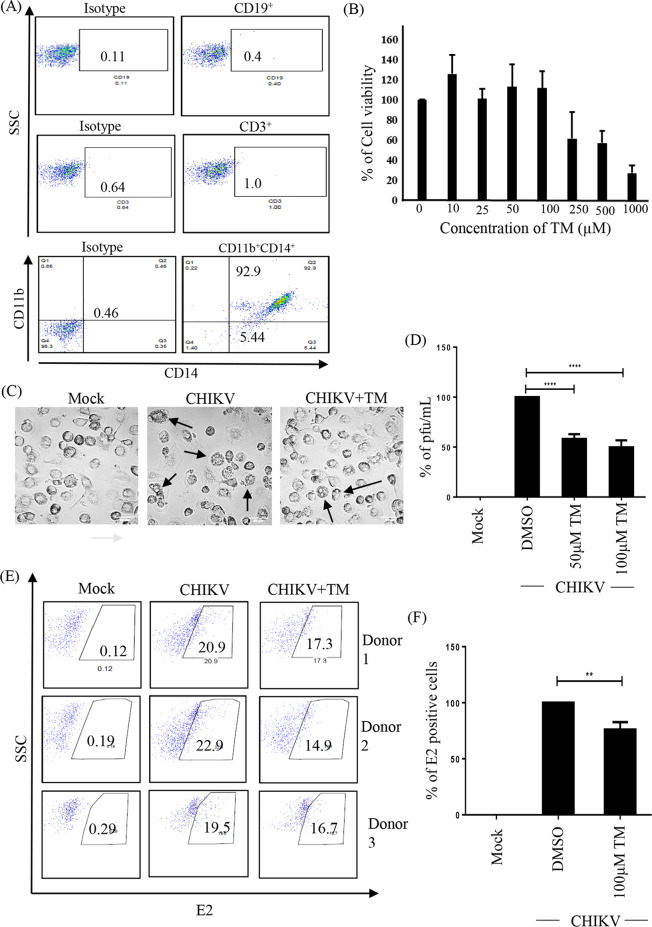
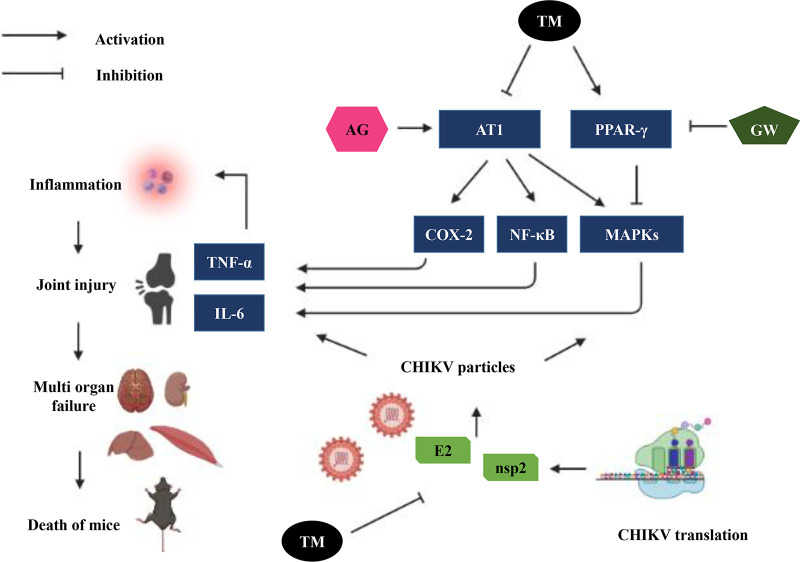
Chikungunya virus (CHIKV) has reemerged as a global public health threat. The inflammatory pathways of the renin-angiotensin system (RAS) and peroxisome proliferator-activated receptor-gamma (PPAR-γ) are usually involved in viral infections. Thus, telmisartan (TM), which is known to block the angiotensin 1 (AT1) receptor and activate PPAR-γ, was investigated for activity against CHIKV. The anti-CHIKV effect of TM was investigated in vitro (Vero cells, RAW 264.7 cells, and human peripheral blood mononuclear cells [hPBMCs]) and in vivo (C57BL/6 mice). TM was found to abrogate CHIKV infection efficiently (50% inhibitory concentration (IC50) of 15.34 to 20.89 μM in the Vero cells and RAW 264.7 cells, respectively). Viral RNA and proteins were reduced remarkably. Additionally, TM interfered in the early and late stages of the CHIKV life cycle with efficacy during pretreatment and posttreatment. Moreover, the agonist of the AT1 receptor and an antagonist of PPAR-γ increased CHIKV infection, suggesting that the antiviral potential of TM occurs through modulating host factors. In addition, reduced activation of all major mitogen-activated protein kinases (MAPKs), NF-κB (p65), and cytokines by TM occurred through the inflammatory axis and supported the fact that the anti-CHIKV efficacy of TM is partly mediated through the AT1/PPAR-γ/MAPKs pathways. Interestingly, at a human equivalent dose, TM abrogated CHIKV infection and inflammation significantly, leading to reduced clinical scores and complete survival of C57BL/6 mice. Additionally, TM reduced infection in hPBMC-derived monocyte-macrophage populations in vitro. Hence, TM was found to reduce CHIKV infection by targeting both viral and host factors. Considering its safety and in vivo efficacy, it can be a suitable candidate in the future for repurposing against CHIKV.

Keywords: AT1; Chikungunya virus; PPAR-γ; drug repurposing; telmisartan.


Conflict of interest statement

The authors declare no conflict of interest.

Figures

FIG 1
FIG 1
Telmisartan inhibits CHIKV infection efficiently. (A) Bar diagram showing the viability of Vero cells in the presence of different concentrations of TM. (B) Vero cells plated onto the coverslips were infected with CHIKV-PS and TM was added at different concentrations (30 μM, 50 μM, 70 μM, or 100 μM). CPE was observed under a microscope at 18 h pi for the uninfected and infected Vero cells after drug treatment, and pictures were taken with 20× magnification in a bright field microscope. (C) After 18 h pi, the cells were fixed and stained with an E2 antibody followed by a secondary antibody, anti-mouse Alexa Fluor 594 (red). Nuclei were counterstained with DAPI (blue). (D) Bar diagram representing the percent positive E2 cell counts from the confocal images. (E) Vero cells were infected with CHIKV-PS and TM was added at different concentrations (10 μM, 20 μM, 30 μM, 40 μM, 50 μM, 60 μM, 70 μM, 80 μM, 90 μM, or 100 μM). The supernatants were collected at 18 h pi, and virus titers were determined by plaque assay. The IC50 of TM in CHIKV-PS infected Vero cells is noted. The x-axis depicts the logarithmic value of the different concentrations of TM, and the y-axis depicts the percentage of PFU/ml. (F) Bar diagram showing the viability of RAW 264.7 cells in the presence of different concentrations of TM. (G) RAW 264.7 cells were infected with CHIKV-IS and TM was added at different concentrations (10 μM, 20 μM, 30 μM, 40 μM, 50 μM, 60 μM, 70 μM, 80 μM, 90 μM, or 100 μM). The supernatants were collected at 8 h pi, and virus titers were determined by plaque assay. The IC50 of TM in CHIKV-IS infected RAW 264.7 cells. The x-axis and y-axis are the same as in (E). Data represented as mean ± SE (n = 3; P ≤ 0.05 was considered statistically significant).
FIG 2
FIG 2
Reduction of CHIKV protein after TM treatment. Vero cells and RAW 264.7 cells were infected with CHIKV and treated with different concentrations of TM as mentioned in Fig. 1. Vero cells were harvested at 18 h pi, and RAW 264.7 cells were harvested at 8 h pi. After that, both cells were stained with CHIKV nsP2 and E2 antibodies and analyzed by flow cytometry. (A and C) Dot plot analysis showing percent cells positive for E2 and nsP2 against FSC-H (forward scatter height) for Vero and RAW 264.7 cells, respectively. (B and D) Histogram and table showing mean fluorescent intensities (MFI) of E2 and nsP2 proteins. Data represented as mean ± SE (n = 3; P ≤ 0.05 was considered statistically significant).
FIG 3
FIG 3
TM interferes in the early and late stages of the CHIKV life cycle, and pretreatment and posttreatment of TM significantly reduce CHIKV infection. (A) Vero cells were infected by CHIKV-PS at a MOI of 0.1 and 100 μM TM was added to each sample every 2 h up to 16 h pi. Ribavirin (10 μM) was used as a control. The bar diagram represents the percentage of virus for all the samples from the supernatants that were collected at 18 h pi. (B) Vero and RAW 264.7 cells were treated with TM (50 μM) separately before (3 h before infection), during (1.5 h during infection), and postinfection (for 18 h in case of Vero cells and 8 h in case of RAW264.7 cells). The drug was present before and during infection for the pretreatment condition. The drug was present before, during, and after infection for before + during + after infection condition. Supernatants collected at 18 h pi for Vero and 8 h pi for RAW 264.7 cells were analyzed by plaque assay. The bar diagram shows the percentage of the virus particle. Data presented as mean ± SE (n = 3; P ≤ 0.05 was considered statistically significant).
FIG 4
FIG 4
AT1 and PPAR-γ can modulate CHIKV infection. (A) Vero cells plated onto the coverslips were treated with TM (50 μM), GW (20 μM), or AG (20 μM) individually before the infection for 3 h, infected with CHIKV-PS at a MOI of 0.1, and treated again with TM (50 μM), GW (20 μM), or AG (20 μM) individually. At 18 h pi, the cells were fixed and probed with E2 antibody followed by staining with secondary antibody, anti-mouse Alexa Fluor 594 (red). Nuclei were counterstained with DAPI (blue). (B) Bar diagrams depicting the percentage of viral titers in the collected supernatant. (C) RAW 264.7 cells were treated with TM (50 μM), GW (20 μM), and AG (20 μM), infected with CHIKV-IS at a MOI of 5, and again treated with TM (50 μM), GW (20 μM), and AG (20 μM). Bar diagrams indicate the percentage of viral titer in the cell supernatant.
FIG 5
FIG 5
Inhibition of CHIKV by TM is mediated through AT1 and PPAR-γ. Vero and RAW 264.7 cells were treated with TM (50 μM), GW (20 μM), and AG (20 μM) for 3 h before infection. The Vero cells were infected by CHIKV-PS (MOI of 0.1) and RAW 264.7 cells were infected by CHIKV-IS (MOI of 5). After 1.5 h incubation with the virus, cells were washed and again treated with TM (50 μM), GW (20 μM), and AG (20 μM). Cells were harvested at 18 h pi and 8 h pi for Vero cells and RAW264.7 cells, respectively. (A and E) Western blot showing the levels of different proteins (nsP2, E2, AT1, and PPAR-γ) in the infected cells. GAPDH and Actin were used as loading controls for Vero and RAW 264.7 cells, respectively. Bar diagram indicating the relative band intensities of viral (nsp2 and E2) and host (AT1 and PPAR-γ) protein levels in Vero (B to D) and RAW 264.7 cells (F to H). Data presented as mean ± SE. (n = 3; P ≤ 0.05 was considered statistically significant).
FIG 6
FIG 6
TM abrogates AT1 agonist (AG) and PPAR-γ antagonist (GW) mediated enhanced CHIKV infection. RAW 264.7 cells were cotreated with TM (50 μM), GW (20 μM), and AG (20 μM) before and after CHIKV-IS infection at a MOI of 5. (A) Bar diagram indicating the percentage of viral titer in the cell supernatant. (B) Western blot showing the levels of different proteins (nsP2, E2, AT1, and PPAR-γ) in the infected cells. Actin was used as a loading control. Bar diagram indicating the relative band intensities of viral (nsp2 and E2) and host protein levels (AT1 and PPAR-γ) (C to E). Data presented as mean ± SE. (n = 3, P ≤ 0.05 was considered statistically significant).
FIG 7
FIG 7
TM reduces the CHIKV-induced inflammatory response through the MAPK pathway, NF-κB, and COX-2. RAW 264.7 cells were infected with CHIKV-IS, treated with TM (50 μM), GW (20 μM), and AG (20 μM) then harvested at 8 h pi. (A) Western blot showing the nsP2, PPAR-γ, and AT1 proteins levels along with phosphorylation status of p38, ERK, JNK, cJUN, IRF3, and NF-κB in RAW 264.7 cell lysates. Actin was used as a loading control. (B to I) Bar diagrams indicating relative band intensities of p-p38, p-ERK, p-JNK, p-cJUN, p-IRF3 p-NF-κB, PPAR-γ, and AT1 (J) Western blot showing the level of COX-2 protein. (K) Bar diagrams depicting relative band intensities of COX-2 protein. (L and M) Bar diagram showing the levels of secreted cytokines (TNF-α and IL-6) of CHIKV-infected and TM-treated macrophages in the supernatants quantified using sandwich ELISA of CHIKV-infected and TM-treated macrophages. Data represented mean ± SE (n = 3; P ≤ 0.05 was considered statistically significant).
FIG 8
FIG 8
Efficient inhibition of CHIKV infection in mice. C57BL/6 mice were infected subcutaneously with 107 PFU of CHIKV-PS and treated with 10 mg/kg of TM at 12 h intervals up to 4 or 5 d pi. Mice were sacrificed at 5 d pi, and serum and different tissues were collected for further downstream experiments. An equal volume of sera was taken to isolate viral RNA. cDNA was synthesized from an equal volume of viral RNA, and the E1 gene was amplified by qRT-PCR. CHIKV RNA copy number was obtained from a standard curve of Ct value. (A) Image of CHIKV-infected and drug-treated mice. (B) Bar diagram showing CHIKV RNA copy number/ml in virus-infected and drug-treated mice serum. (C) Whole RNA was isolated from the CHIKV-infected and drug-treated samples, and the CHIKV E1 gene was amplified by qRT-PCR. Bar diagram showing the fold change of viral RNA in samples from infected or drug-treated animals. (D) Western blot showing the viral E2 protein in different tissue samples. Actin was used as a loading control. (E) Bar diagram showing the relative band intensities of E2 in samples of different tissues from infected or drug-treated animals. (F) Image panels showing the H&E-stained muscles (a). Image panels showing the CHIKV E2-stained muscles (b). (G) Survival curve showing the efficacy of TM against CHIKV-infected C57BL/6 mice (n = 6/group). (H) Plot showing the disease symptoms during CHIKV infection, which were monitored from 1 d pi to 8 d pi. (I to K) Bar diagrams indicating the concentrations (pg/ml) of different cytokines (IP-10, MIP1-β, KC, IL-6, IL-12(p40), RANTES, GM-CSF, TNF-α) in mock, infected, and drug-treated mice serum. All bar diagrams were obtained through the Graphpad Prism software (n = 3 or n = 6). Data presented as mean ± SE. P ≤ 0.05 was considered statistically significant.
FIG 9
FIG 9
TM reduces CHIKV infection in hPBMC-derived monocyte-macrophage populations in vitro. (A) Dot plot showing the percentages of B cells (CD19), T cells (CD3), and CD14+CD11b+ monocyte-macrophage cells from adherent hPBMCs by flow cytometry. (B) Bar diagram representing the cytotoxicity of TM in hPBMC-derived adherent cell populations by MTT assay. (C) Image showing CHIKV-induced CPE in hPBMC-derived adherent cells. (D) Bar diagram depicting percentage of the viral particle formation obtained by plaque assay. (E) Dot plot showing the percentage of viral E2-positive hPBMC-derived monocyte-macrophage population in mock, CHIKV-infected, and TM-treated CHIKV infection from three healthy donors’ hPBMCs obtained using flow cytometry. (F) Bar diagram showing the percentage of positive cells for CHIKV E2 protein, as derived by flow cytometry assay. Data shown are represented as mean ± SE of three independent experiments. *, P < 0.05.
FIG 10
FIG 10
Schematic representation of proposed working model demonstrating the involvement of AT1, PPAR-γ, and MAPKs after TM treatment during CHIKV infection. Activation of AT1 and blocking of PPAR-γ induced higher phosphorylation of MAPKs with an increase in the expression of COX-2 and NF-κB that led to an increase in the level of inflammatory mediators (TNF-α and IL-6). Infection by CHIKV induced these axes to cause inflammation, tissue injury, and cell death. Both AG and GW increased CHIKV infection and inflammation. TM blocked AT1 and activated PPAR-γ to reduce CHIKV infection and inflammation.

References

    1. Powers AM. 2015. Risks to the Americas associated with the continued expansion of chikungunya virus. J Gen Virol 96:1–5. 10.1099/vir.0.070136-0. - DOI - PMC - PubMed
    1. Rougeron V, Sam IC, Caron M, Nkoghe D, Leroy E, Roques P. 2015. Chikungunya, a paradigm of neglected tropical disease that emerged to be a new health global risk. J Clin Virol 64:144–152. 10.1016/j.jcv.2014.08.032. - DOI - PubMed
    1. Lima Neto AS, Sousa GS, Nascimento OJ, Castro MC. 2019. Chikungunya-attributable deaths: a neglected outcome of a neglected disease. PLoS Negl Trop Dis 13:e0007575. 10.1371/journal.pntd.0007575. - DOI - PMC - PubMed
    1. Morrison TE. 2014. Reemergence of chikungunya virus. J Virol 88:11644–11647. 10.1128/JVI.01432-14. - DOI - PMC - PubMed
    1. Weaver SC, Lecuit M. 2015. Chikungunya virus and the global spread of a mosquito-borne disease. N Engl J Med 372:1231–1239. 10.1056/NEJMra1406035. - DOI - PubMed

Publication types