. 2022 Feb;69(2):534-542.
doi: 10.1109/TUFFC.2021.3125670. Epub 2022 Jan 27.

Experimental Demonstration of Trans-Skull Volumetric Passive Acoustic Mapping With the Heterogeneous Angular Spectrum Approach

Experimental Demonstration of Trans-Skull Volumetric Passive Acoustic Mapping With the Heterogeneous Angular Spectrum Approach

Scott Schoen et al. IEEE Trans Ultrason Ferroelectr Freq Control. 2022 Feb.

Abstract

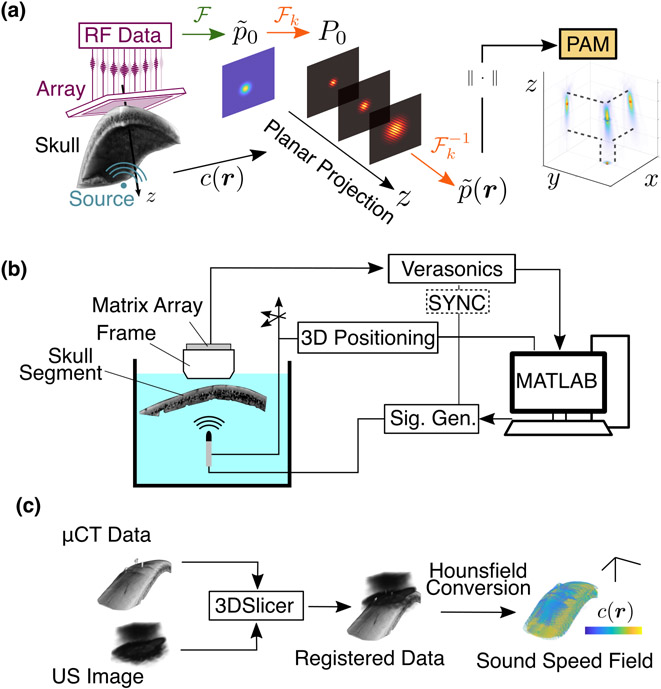
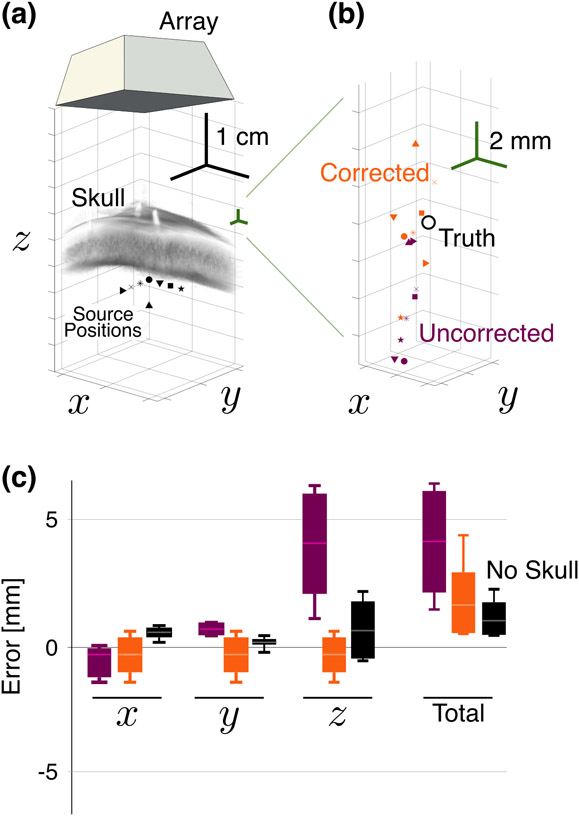
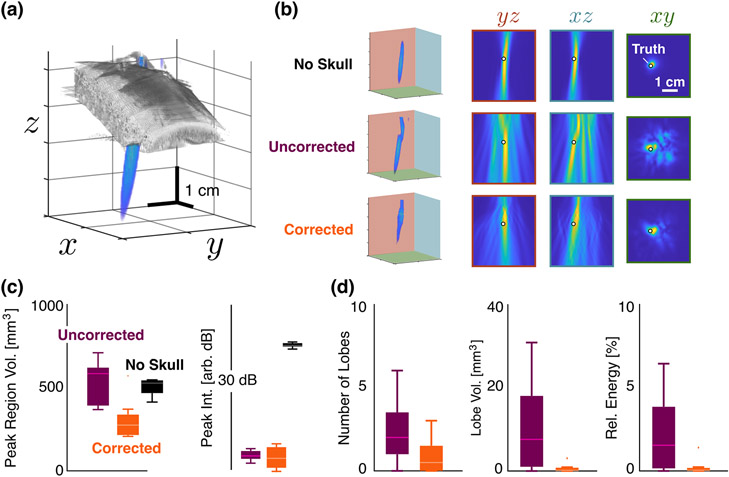
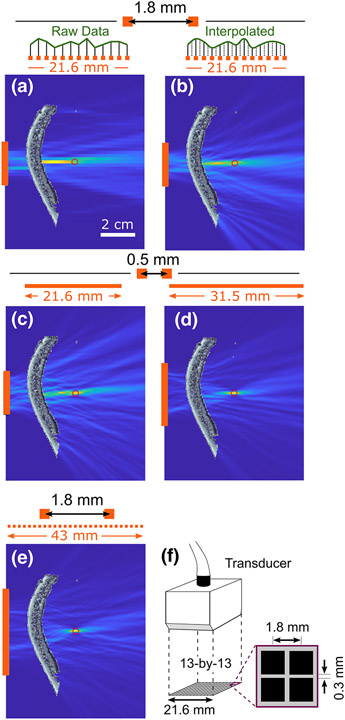
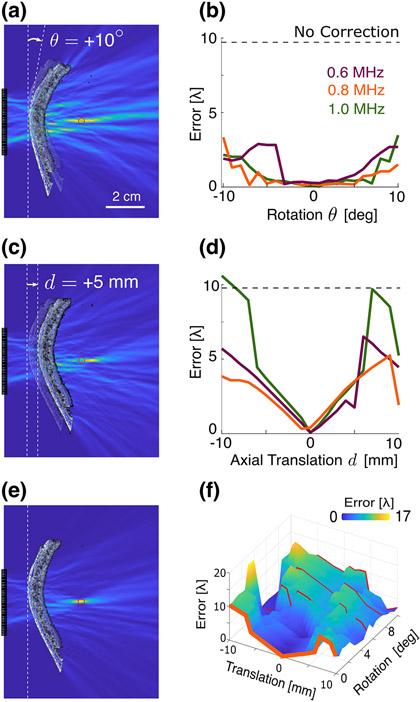
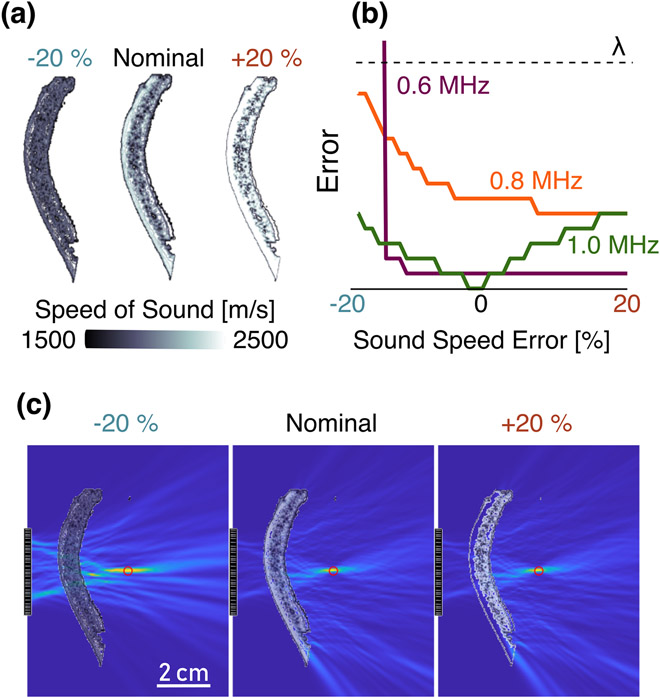
Real-time, 3-D, passive acoustic mapping (PAM) of microbubble dynamics during transcranial focused ultrasound (FUS) is essential for optimal treatment outcomes. The angular spectrum approach (ASA) potentially offers a very efficient method to perform PAM, as it can reconstruct specific frequency bands pertinent to microbubble dynamics and may be extended to correct aberrations caused by the skull. Here, we experimentally assess the abilities of heterogeneous ASA (HASA) to perform trans-skull PAM. Our experimental investigations demonstrate that the 3-D PAMs of a known 1-MHz source, constructed with HASA through an ex vivo human skull segment, reduced both the localization error (from 4.7 ± 2.3 to 2.3 ± 1.6 mm) and the number, size, and energy of spurious lobes caused by aberration, with the modest additional computational expense. While further improvements in the localization errors are expected with arrays with denser elements and larger aperture, our analysis revealed that experimental constraints associated with the array pitch and aperture (here, 1.8 mm and 2.5 cm, respectively) can be ameliorated by interpolation and peak finding techniques. Beyond the array characteristics, our analysis also indicated that errors in the registration (translation and rotation of ±5 mm and ±5°, respectively) of the skull segment to the array can lead to peak localization errors of the order of a few wavelengths. Interestingly, errors in the spatially dependent speed of sound in the skull (±20%) caused only subwavelength errors in the reconstructions, suggesting that registration is the most important determinant of point source localization accuracy. Collectively, our findings show that HASA can address source localization problems through the skull efficiently and accurately under realistic conditions, thereby creating unique opportunities for imaging and controlling the microbubble dynamics in the brain.


Figures

Fig. 1.
Fig. 1.
(a) PAM formation with aberration correction: RF signals are recorded from a source behind a skull. The data are beamformed in the spatial frequency domain using corrections from the known sound speed field c(r) with Eq. (5). (b) Experimental setup: Emissions from a known source are collected with a matrix array through a degassed human skull segment. (c) Sound speed registration: Using an acoustic image from the array and the micro-CT data, fiducial registration is used to obtain the transformation matrix. A semi-empirical model was used to convert the CT intensities to material properties.
Fig. 2.
Fig. 2.
(a) Known source positions relative to the array and skull segment. (b) Recovered source posiutions relative to the truth position (white circle) for the corrected (orange) and uncorrected (purple) points. Shapes correspond to the positions in (a). (c) Error relative to truth over all positions in (a), with and without the correction, as well as the no-skull case. Boxes represent the middle 50th percentile for each, while the whiskers represent the maximum and minimum values. The notch indicates the median for each case.
Fig. 3.
Fig. 3.
Comparison of PAM Quality. (a) Experimental reconstructed PAM relative to the position and size of the skull. (b) Reconstructed maps for positions (0, 5, 30) mm with no skull (top row), with the skull (i.e., uncorrected, middle row), and with the skull and correction (bottom row). The columns show the projections of the maps onto the indicated axes relative to the true position of the source (white circle). The 1 cm scale bar is constant for all PAMs. (c) Mean peak region volume and PAM intensities at the peak averaged over all positions for the no-skull (black), uncorrected (purple), and corrected (orange) cases. Scale bar in xy plane of top row is constant for all images. (d) Mean number, volume, and total energy within the side lobes averaged over all cases. No side lobes were present in the no skull case.
Fig. 4.
Fig. 4.
Effect of aperture and pitch on corrected reconstruction accuracy for a source at (x,z)=(0mm,40mm). (a) Reconstruction at a native resolution of the experimental array (13 elements, Δx=1.8mm). (b) Reconstruction with data recorded at native resolution of the array (13 elements, Δx=1.8mm), but interpolated 4×. (c) Reconstruction with a smaller pitch of Δx=0.5mm, but with same aperture length (21.6 mm) as the experimental array. (d) Reconstruction with Δx=0.5mm, and 64 total elements. (d) Reconstruction with smaller pitch of Δx=0.5mm, but with the same aperture length (21.6 mm) as the experimental array. (d) Reconstruction with experimental pitch Δx=1.8mm, but twice as many elements (26 in total). (f) Schematic of custom 2D array used in the experiments. Scale bar in (a) is applicable to subplots (a)–(e).
Fig. 5.
Fig. 5.
(a) 1 MHz source reconstruction with a 10° rotation error in the reconstruction. (b) Localization error as a function of the rotational registration error θ for the indicated frequencies, compared with the uncorrected ASA-PAM result (dashed line). (c) 1 MHz source reconstruction with a 5 mm translation error in the reconstruction. (d) Localization error as a function of the translational registration error, compared with the uncorrected ASA-PAM result (dashed line). (e) Trans-skull PAM reconstruction at 1 MHz with no registration error. (f) Localization error compared to the average wavelength λ=ω2πcavg as a function of the translational and rotational registration errors. Scale bar in (a) is applicable to subplots (a), (c), (e).
Fig. 6.
Fig. 6.
(a) Sound speed profile of the skull segment used for the experiment and used in the simulations, derived from micro-CT scans. The sound speed values in the skull were then scaled by values from 0.8 to 1.2 (±20 %) from the nominal case. (b) Effect of sound speed error on PAM source localization error magnitude for the indicated frequencies, compared to the mean wavelength at 1 MHz. (c) HASA-PAMs formed at 1 MHz for the nominal and extreme case sound speeds. The 2 cm scale bar is constant for all PAMs.

References

    1. Meng Y, Hynynen K, and Lipsman N, “Applications of focused ultrasound in the brain: from thermoablation to drug delivery,” Nature Reviews Neurology, vol. 17, no. 1, pp. 7–22, Jan. 2021. - PubMed
    1. Aryal M, Arvanitis CD, Alexander PM, and McDannold N, “Ultrasound-mediated blood–brain barrier disruption for targeted drug delivery in the central nervous system,” Advanced Drug Delivery Reviews, vol. 72, pp. 94–109, Jun. 2014. - PMC - PubMed
    1. Jones RM and Hynynen K, “Advances in acoustic monitoring and control of focused ultrasound-mediated increases in blood-brain barrier permeability,” The British Journal of Radiology, vol. 92, no. 1096, p. 20180601, Feb. 2019. - PMC - PubMed
    1. Hu Z, Xu L, Chien C-Y, Yang Y, Gong Y, Ye D et al., “Three-dimensional Transcranial Microbubble Cavitation Localization by Four Sensors,” IEEE Transactions on Ultrasonics, Ferroelectrics, and Frequency Control, pp. 1–1, 2021. - PMC - PubMed
    1. Salgaonkar VA, Datta S, Holland CK, and Mast TD, “Passive cavitation imaging with ultrasound arrays,” The Journal of the Acoustical Society of America, vol. 126, no. 6, pp. 3071–3083, Dec. 2009. - PMC - PubMed

Publication types