. 2021 Nov 8;17(11):e1009550.
doi: 10.1371/journal.pcbi.1009550. eCollection 2021 Nov.

GPRuler: Metabolic gene-protein-reaction rules automatic reconstruction

Affiliations

GPRuler: Metabolic gene-protein-reaction rules automatic reconstruction

Marzia Di Filippo et al. PLoS Comput Biol. .

Abstract

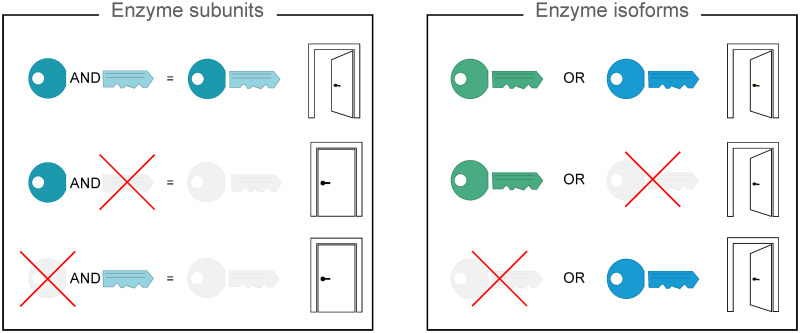
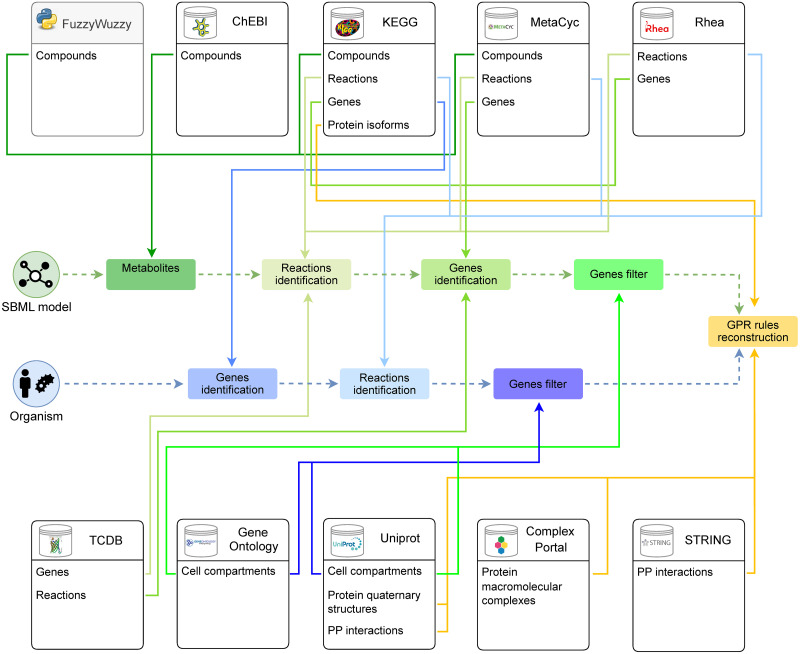
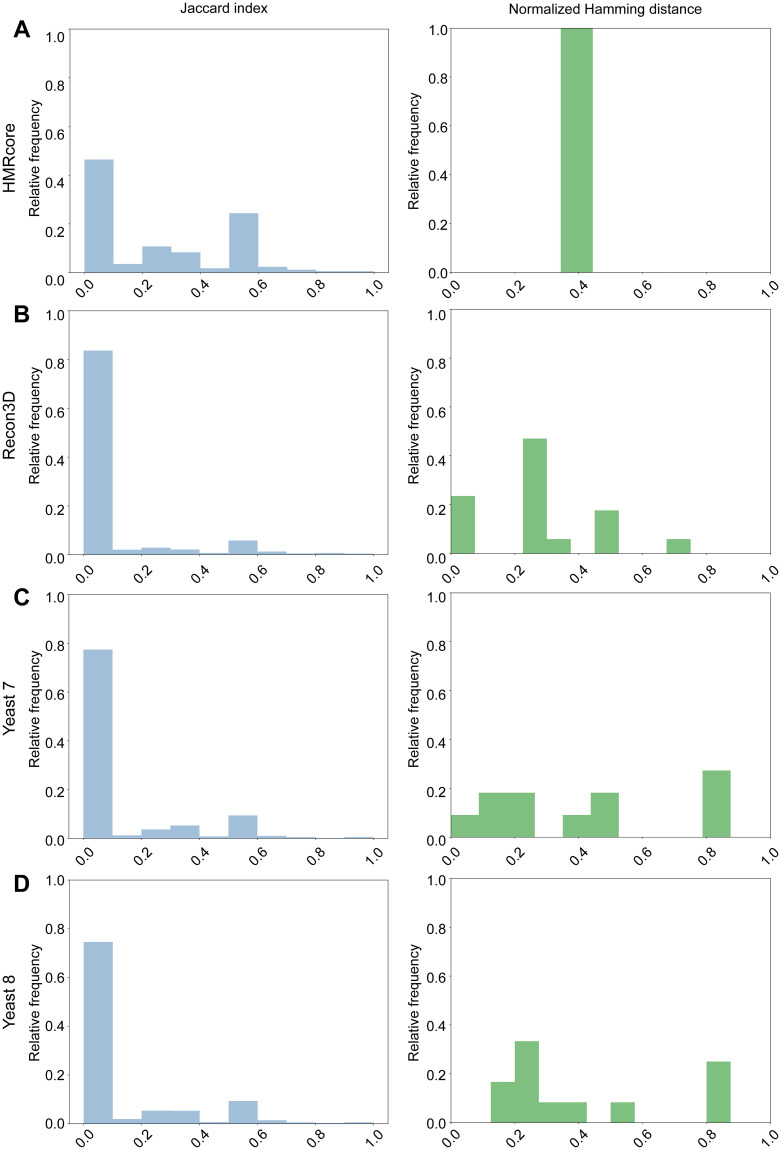
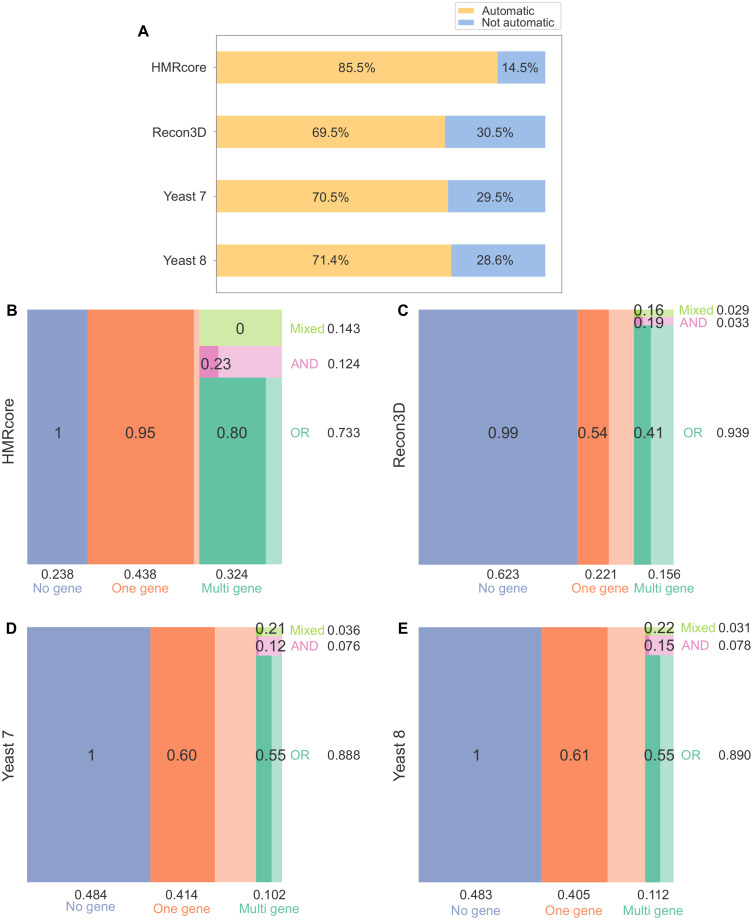
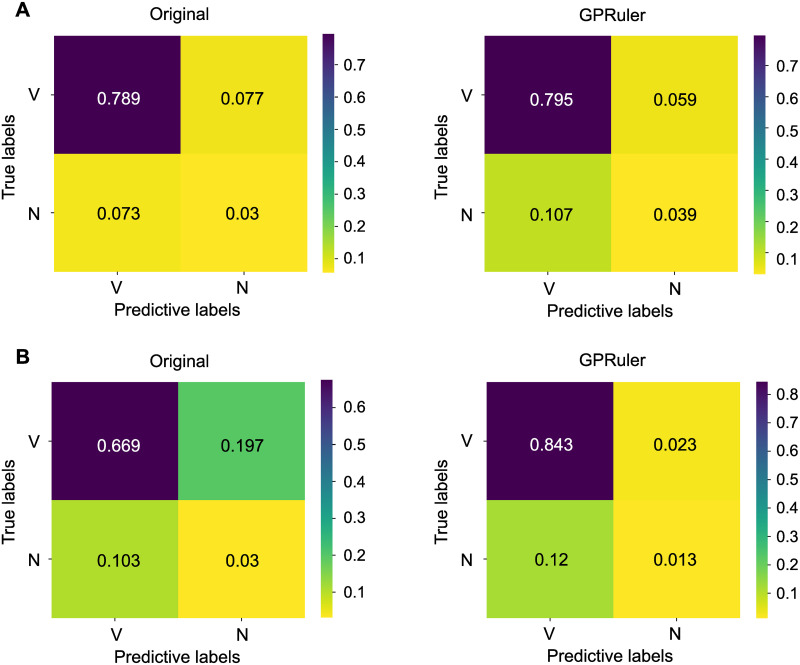
Metabolic network models are increasingly being used in health care and industry. As a consequence, many tools have been released to automate their reconstruction process de novo. In order to enable gene deletion simulations and integration of gene expression data, these networks must include gene-protein-reaction (GPR) rules, which describe with a Boolean logic relationships between the gene products (e.g., enzyme isoforms or subunits) associated with the catalysis of a given reaction. Nevertheless, the reconstruction of GPRs still remains a largely manual and time consuming process. Aiming at fully automating the reconstruction process of GPRs for any organism, we propose the open-source python-based framework GPRuler. By mining text and data from 9 different biological databases, GPRuler can reconstruct GPRs starting either from just the name of the target organism or from an existing metabolic model. The performance of the developed tool is evaluated at small-scale level for a manually curated metabolic model, and at genome-scale level for three metabolic models related to Homo sapiens and Saccharomyces cerevisiae organisms. By exploiting these models as benchmarks, the proposed tool shown its ability to reproduce the original GPR rules with a high level of accuracy. In all the tested scenarios, after a manual investigation of the mismatches between the rules proposed by GPRuler and the original ones, the proposed approach revealed to be in many cases more accurate than the original models. By complementing existing tools for metabolic network reconstruction with the possibility to reconstruct GPRs quickly and with a few resources, GPRuler paves the way to the study of context-specific metabolic networks, representing the active portion of the complete network in given conditions, for organisms of industrial or biomedical interest that have not been characterized metabolically yet.


Conflict of interest statement

The authors have declared that no competing interests exist.

Figures

Fig 1
Fig 1. Logic of GPR rules.
A metaphorical representation is exploited to explain the meaning of the AND and OR operators used in the reconstruction of GPR rules. In the box on the left named “Enzyme subunits”, the AND operator joins genes encoding for different subunits of the same enzyme. Metaphorically, the head and tail of the key represent the subunits of the same enzyme. Both parts of the key are required to open the door, and the lack of one of the two parts precludes the opening of the door. Biologically speaking, when both the subunits forming the enzyme are available, the enzyme can catalyse the reaction where it is involved. In the box on the right named “Enzyme isoforms”, the OR operator joins genes encoding for different isoforms of the same enzyme. In this case, two distinct keys representing the enzyme isoforms can alternatively open the door. Differently from the previous situation, just one of the two isoforms is sufficient to catalyse the reaction. Combining AND and OR operators, more complex scenario can be describe where both isoforms and subunits are involved.
Fig 2
Fig 2. Literature analysis dealing with GPR reconstruction.
In the circular plot, nodes correspond to the examined publications (red nodes), the adopted strategies (blue nodes) and data sources (green nodes). The nodes are ordered chronologically within the red category and alphabetically in the other two ones. Directed edges connect a given node to the to the exploited sources. If the source is not mentioned, the node remains isolated. Rectangles identify through their size the citation status of the corresponding node. References associated to each label are reported in the S1 File.
Fig 3
Fig 3. A detailed graphical representation of GPRuler tool.
The central part of the figure illustrates the two alternative paths that can be followed to reconstruct the GPR rules according to the two possible inputs of GPRuler: the SBML model (green) and the organism name (blue). The green and the blue rectangles connected to each other by dashed arrows show the steps to follow in each path to achieve the core pipeline (orange rectangle), which returns as ultimate outcome the GPR rules. The ten boxes on the top and bottom of the figure represent the exploited data sources used by GPRuler, including both biological databases (white boxes) and the FuzzyWuzzy Python package (gray box), listing which information is retrieved from each of them. Each coloured arrow links each step of the pipeline to the used source and, in particular, to the type of data for which that particular source is queried.
Fig 4
Fig 4. Evaluation of GPRuler performance in the obtained mismatches when compared with ground truth GPRs.
The blue histograms on the left of each panel show the relative frequencies distribution of Jaccard indexes computed for the retrieved negative matches in all the four ground truth models. Specifically: HMRcore in Panel A; Recon3D in Panel B; Yeast 7 in Panel C; Yeast 8 in Panel D. We reported in the green histograms on the right of each panel the normalized Hamming distance between the two truth matrices of negative matches having Jaccard index of 1.
Fig 5
Fig 5. Assessment of GPRuler performance in reconstructing GPRs of ground truth models.
Panel A shows a summary of GPRuler performance highlighting the percentage of the automatically reconstructed rules in each ground truth models (labelled as “Automatic” and coloured in dark yellow) against those that cannot be correctly reconstructed unless a subsequent curation by the user (labelled as“Not automatic” and coloured in light blue). The mosaic plots below show in B) HMRcore, C) Recon3D, D) Yeast 7 and E) Yeast 8 model the frequency of “Automatic” GPR rules as proportional to the size of internal rectangles. The rectangle portions having low transparency corresponds to the “Not automatic” rules. GPRs are classified according to the type of relationships established among genes involved in reaction catalysis as “No gene”, “One gene” and “Multi gene”. In the “Multi gene” class, the three subclasses “OR”, “AND” and “Mixed” are also represented. On the horizontal side of each mosaic plot, the proportion of “No gene”, “One gene” and “Multi gene” Automatic GPR rules in each model is reported. On the vertical side of each mosaic plot, the same information is reported for the three classes “OR”, “AND” and “Mixed” over the percentage of Automatic Multi gene rules.
Fig 6
Fig 6. Evaluation of GPRuler performance by a comparison with in silico deletions of Yeast 8 genes.
Panel A shows on the left the confusion matrix resulting from the simulation of all the genes of the original model (labelled as “Original”), and on the right the confusion matrix created from the Yeast 8 GPRs reconstructed by GPRuler (labelled as “GPRuler”). Panel B shows the confusion matrix in the “Original” (on the left) and “GPRuler” (on the right) model when only genes involved in Yeast 8 reactions classified as “Corrected by GPRuler” are considered. The two labels V and N correspond, respectively, to the “Viable” and “Not viable” phenotype. Each cell of the confusion matrix is coloured according to the relative frequency of the corresponding case, which is shown in the middle of the cell, following the color scale reported on the right of each plot.

References

    1. O’Brien EJ, Monk JM, Palsson BO. Using genome-scale models to predict biological capabilities. Cell. 2015; 161(5):971–987. doi: 10.1016/j.cell.2015.05.019 - DOI - PMC - PubMed
    1. Keller MA, Piedrafita G, Ralser M. The widespread role of non-enzymatic reactions in cellular metabolism. Current opinion in biotechnology. 2015; 34:153–161. doi: 10.1016/j.copbio.2014.12.020 - DOI - PMC - PubMed
    1. Gunning PW. Protein isoforms and isozymes. eLS. 2005
    1. Kanehisa M, Sato Y, Kawashima M, Furumichi M, Tanabe M. KEGG as a reference resource for gene and protein annotation. Nucleic Acids Research. 2016; 44(D1):D457–62. doi: 10.1093/nar/gkv1070 - DOI - PMC - PubMed
    1. UniProt Consortium. UniProt: a worldwide hub of protein knowledge. Nucleic acids research. 2019; 47(D1):D506–D515. doi: 10.1093/nar/gky1049 - DOI - PMC - PubMed

Publication types

MeSH terms

Substances