. 2021 Nov 8;16(11):e0259004.
doi: 10.1371/journal.pone.0259004. eCollection 2021.

Global biogeography of living brachiopods: Bioregionalization patterns and possible controls

Affiliations

Global biogeography of living brachiopods: Bioregionalization patterns and possible controls

Facheng Ye et al. PLoS One. .

Abstract

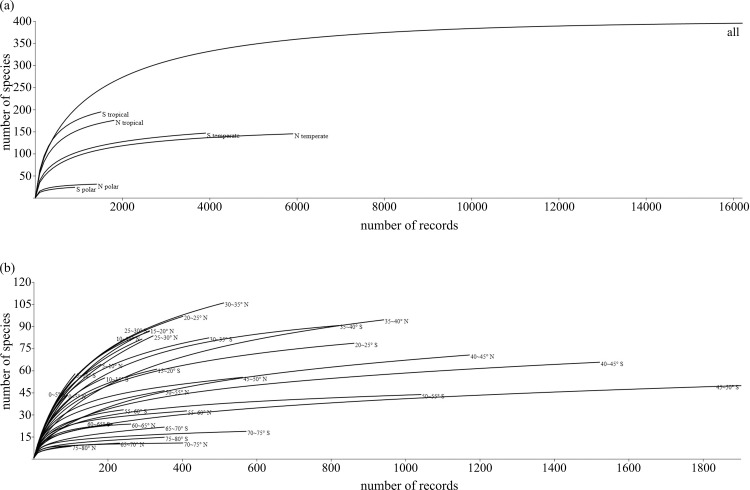
The global distribution patterns of 14918 geo-referenced occurrences from 394 living brachiopod species were mapped in 5° grid cells, which enabled the visualization and delineation of distinct bioregions and biodiversity hotspots. Further investigation using cluster and network analyses allowed us to propose the first systematically and quantitatively recognized global bioregionalization framework for living brachiopods, consisting of five bioregions and thirteen bioprovinces. No single environmental or ecological variable is accountable for the newly proposed global bioregionalization patterns of living brachiopods. Instead, the combined effects of large-scale ocean gyres, climatic zonation as well as some geohistorical factors (e.g., formation of land bridges and geological recent closure of ancient seaways) are considered as the main drivers at the global scale. At the regional scale, however, the faunal composition, diversity and biogeographical differentiation appear to be mainly controlled by seawater temperature variation, regional ocean currents and coastal upwelling systems.


Conflict of interest statement

The authors have declared that no competing interests exist.

Figures

Fig 1
Fig 1. Sample rarefaction curves based on the data from our literature-derived database (software program PAST 4.01).
(a), All: all data, N polar: data from 90° ~ 60° N, N temperate: data from 60° ~ 30° N, N tropical: data from 30° N ~ 0°, S polar: data from 90° ~ 60° S, S temperate: data from 60° ~ 30° S, S tropical: data from 30° S ~ 0°. (b), rarefaction curves for the data from each five-degree latitudinal bin.
Fig 2
Fig 2. 5° grid cell map of species richness distribution of living brachiopods.
Different shades of red colour represent the gradient of species richness as shown in the legend boxes. Source: global basic map was downloaded from ArcWorld Supplement via ESRI and [52]), then adapted for visualization here by using open source Geographic Information System QGIS (http://qgis.osgeo.org).
Fig 3
Fig 3. 5° grid cell map of genus richness distribution of living brachiopods.
Different shades of green colour represent the gradient of genera richness as shown in the legend boxes. Source: same as in Fig 2.
Fig 4
Fig 4. Contour map of living brachiopod species richness based on 5° grid cells.
Coastal upwelling regions are adjusted from [53] and NOAA (https://www.noaa.gov/). Source: same as in Fig 2.
Fig 5
Fig 5. Cluster analysis result and mapping.
(a) dendrogram of cluster analysis showing the seven major groups (A, B, C, D, E, F, G), the numbers in brackets are the number of 5° grid cells included in each cluster; (b) global distribution of the seven major groupings recognized in (a) and their constituent clusters. The variety of colours corresponds between the two subfigures and represent the seven different group (A through G); the labelled number on each 5° grid cell corresponds to the cluster number in (a). Asterisk denotes clusters whose group memberships are equivocal due to possible under-sampling or other reasons and require careful consideration; these are usually clusters that contain widely scattered grid cells of relatively small sizes. Source: same as in Fig 2.
Fig 6
Fig 6. Output of network analysis depicting the degree of major groupings and connectivity among the 20 clusters and the brachiopod species.
The variety of node colours and labelled numbers are the same as in Fig 5; the diameter of the nodes represents the number of species in each cluster (nodes with cluster number and colours) and number of clusters in which each species occurs (grey nodes) respectively.
Fig 7
Fig 7. World map showing the global biogeographical regions and provinces proposed in the present study.
Global ocean currents are adopted from NOAA (https://www.noaa.gov/), climatic zones are adjusted from Briggs [55, 56]. Source: same as in Fig 2.

References

    1. Shen SZ, Shi GR. Wuchiapingian (early Lopingian, Permian) global brachiopod palaeobiogeography: a quantitative approach. Palaeogeogr Palaeoclimatol Palaeoecol. 2000; 162(3–4):299–318. doi: 10.1016/S0031-0182(00)00133-4 - DOI
    1. Powell MG. Geographic range and genus longevity of late Paleozoic brachiopods. Paleobiology. 2007; 33: 530–546.
    1. Shen SS, Xie JF, Zhang H, Shi GR. Roadian–Wordian (Guadalupian, Middle Permian) global palaeobiogeography of brachiopods, Glob Planet Change. 2009; 65:166–181. doi: 10.1016/j.gloplacha.2008.10.017 - DOI
    1. Shi GR, Waterhouse JB, McLoughlin S. The Lopingian of Australasia: a review of biostratigraphy, correlations, palaeogeography and palaeobiogeography. Geol J. 2010; 45:230–263. doi: 10.1002/gj.1213 - DOI
    1. Harper DAT, Rasmussen CMØ, Liljeroth M, Blodgett RB, Candela Y, Jin J, et al.. Biodiversity, biogeography and phylogeography of Ordovician rhynchonelliform brachiopods. Geol Soc Lond Mem. 2013; 38:127–144. doi: 10.1144/M38.11 - DOI

Publication types