. 2021 Nov 8;16(11):e0259558.
doi: 10.1371/journal.pone.0259558. eCollection 2021.

NKX2-1 re-expression induces cell death through apoptosis and necrosis in dedifferentiated thyroid carcinoma cells

Affiliations

NKX2-1 re-expression induces cell death through apoptosis and necrosis in dedifferentiated thyroid carcinoma cells

Yuko Ito et al. PLoS One. .

Abstract

NK2 homeobox 1 (NKX2-1) is a thyroid transcription factor essential for proper thyroid formation and maintaining its physiological function. In thyroid cancer, NKX2-1 expression decreases in parallel with declined differentiation. However, the molecular pathways and mechanisms connecting NKX2-1 to thyroid cancer phenotypes are largely unknown. This study aimed to examine the effects of NKX2-1 re-expression on dedifferentiated thyroid cancer cell death and explore the underlying mechanisms. A human papillary thyroid carcinoma cell line lacking NKX2-1 expression was infected with an adenoviral vector containing Nkx2-1. Cell viability decreased after Nkx2-1 transduction and apoptosis and necrosis were detected. Arginase 2 (ARG2), regulator of G protein signaling 4 (RGS4), and RGS5 mRNA expression was greatly increased in Nkx2-1-transducted cells. After suppressing these genes by siRNA, cell death, apoptosis, and necrosis decreased in RGS4 knockdown cells. These findings demonstrated that cell death was induced via apoptosis and necrosis by NKX2-1 re-expression and involves RGS4.


Conflict of interest statement

H.S. has received grant support from Roche Diagnostics K.K. This does not alter our adherence to PLOS ONE policies on sharing data and materials.

Figures

Fig 1
Fig 1. Cell viability after AdNKX2-1 and AdLacZ infection.
(A) Time-dependent changes after 1000 MOI adenoviral vectors infection in BHP18-21v cells (n = 9). (B) MOI-dependent changes 120 h after adenoviral vector infection (n = 4–9). The ratios of surviving infected cells to non-infected cells at the same timepoint after infection are shown. Error bars indicate SEM. *p<0.05 and **p<0.01, significant differences between AdNKX2-1 and AdLacZ. (C) Western blots showing NKX2-1 expression 72 h after infection with 300 MOI AdLacZ or AdNKX2-1 (upper panel). Loading control, GAPDH expression (bottom panel). L, AdLacZ; N, AdNKX2-1.
Fig 2
Fig 2. Apoptosis and necrosis detection in BHP18-21v cells after adenoviral vector infection.
(A) Acridine orange- and ethidium bromide-stained cells. The green, orange, and magenta arrows represent early apoptotic (acridine orange-stained condensed chromatin), late apoptotic (ethidium bromide-stained condensed chromatin), and necrotic (ethidium bromide-stained normal chromatin) cells, respectively. (B) Hoechst 33342-stained cells. The green and magenta arrows represent an apoptotic cell with a condensed nucleus and a necrotic cell with a ballooning nucleus, respectively. (C) Real-time assay using annexin V (n = 3). The luminescence and fluorescence signals indicate apoptosis and necrosis, respectively. Error bars indicate SEM. *p<0.05 and **p<0.01, significant differences between AdNKX2-1 and AdLacZ. (D) Caspase 3/7 activity-dependent fluorescence intensity 72 h after infection (n = 6). Error bars indicate SEM. **p<0.01, significant differences between AdNKX2-1 and AdLacZ.
Fig 3
Fig 3. The percentages of genes with largely changed expression after AdNKX2-1 infection.
The percentage of genes whose ratio of expression in the AdNKX2-1-infected cells to that in the AdLacZ-infected cells was (A) twice or higher and (B) 0.5-fold or lower in GeneChip analyses 6, 12, and 24 h after 100 MOI adenoviral vector infection. A total of 54,613 transcripts were analyzed. Data with statistically insignificant changes were excluded from the analysis.
Fig 4
Fig 4. ARG2, RGS4, and RGS5 expression in BHP18-21v cells analyzed using real-time PCR and western blotting.
(A) MOI-dependent changes in gene expressions quantified by real-time PCR 72 h after adenoviral vector infection (n = 6). Ratios of gene expressions in infected cells to those in non-infected cells 72 h after infection are shown. (B) Time-dependent changes in gene expressions quantified by real-time PCR after 300 MOI adenoviral vector infection (n = 6). Ratios of gene expressions in infected cells to those in pre-infected cells (0 h) are shown. Error bars indicate SEM. *p<0.05 and **p<0.01, significant differences between AdNKX2-1 and AdLacZ. (C) Western blot showing ARG2 and RGS4 expression 72 h after 300 MOI AdLacZ or AdNKX2-1 infection (upper panel). Loading control, GAPDH expression (bottom panel).
Fig 5
Fig 5. ARG2 and RGS4 expression in siRNA-transfected cells after AdNKX2-1 infection.
(A) Western blots showing NKX2-1 and GAPDH expression 72 h after infecting BHP18-21v cells with and without siRNA transfection with 300 MOI AdLacZ or AdNKX2-1. ’Mock’ represents the Opti-MEM® Medium and LipofectamineTM RNAiMAX exposed, but not siRNA transfected cells. (B) ARG2 and RGS4 mRNA expressions in siARG2- and siRGS4-transfected cells, respectively, are shown in percent of control (n = 4). siNegative-transfected cells were used as the control. All the siRNAs, #1, #2, and #3, targeting ARG2 and RGS4 efficiently downregulated each of the gene expressions. Error bars indicate SEM. **p<0.01, significant differences between siNegative and siARG2 or siRGS4. (C) Western blot showing ARG2 and RGS4 expression 72 h after 300 MOI AdNKX2-1 infection. The ratios (%) of protein expression in the siRGS4#1–#3-transfected cells compared with that in siNegative-transfected cells are shown.
Fig 6
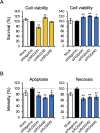
Fig 6. The effects of siARG2 or siRGS4 on AdNKX2-1-induced cell death, apoptosis, and necrosis.
The number of surviving cells and apoptosis and necrosis signal intensities in siRNA-transfected cells are shown as a percentage of the control. siNegative-transfected cells were used as controls. ’Mock’ represents the Opti-MEM® Medium and LipofectamineTM RNAiMAX exposed, but not siRNA transfected cells. Error bars indicate SEM. *p<0.05, **p<0.01, significant differences between siNegative and siARG2 or siRGS4. (A) Viability of siARG2- or siRGS4-transfected cells 72 h after 300 MOI AdNKX2-1 infection (n = 9). (B) Apoptosis and necrosis in siRGS4-transfected cells 72 and 96 h, respectively, after 300 MOI AdNKX2-1 infection (n = 9).

References

    1. Fernandez LP, Lopez-Marquez A, Santisteban P. Thyroid transcription factors in development, differentiation and disease. Nat Rev Endocrinol. 2015;11(1):29–42. doi: 10.1038/nrendo.2014.186 - DOI - PubMed
    1. Kimura S. Thyroid-specific transcription factors and their roles in thyroid cancer. J Thyroid Res. 2011;2011:710213. doi: 10.4061/2011/710213 - DOI - PMC - PubMed
    1. Barletta JA, Perner S, Iafrate AJ, Yeap BY, Weir BA, Johnson LA, et al.. Clinical significance of TTF-1 protein expression and TTF-1 gene amplification in lung adenocarcinoma. J Cell Mol Med. 2009;13(8B):1977–1986. doi: 10.1111/j.1582-4934.2008.00594.x - DOI - PMC - PubMed
    1. Myong NH. Thyroid transcription factor-1 (TTF-1) expression in human lung carcinomas: its prognostic implication and relationship with wxpressions of p53 and Ki-67 proteins. J Korean Med Sci. 2003;18(4):494–500. doi: 10.3346/jkms.2003.18.4.494 - DOI - PMC - PubMed
    1. Kusakabe T, Kawaguchi A, Hoshi N, Kawaguchi R, Hoshi S, Kimura S. Thyroid-specific enhancer-binding protein/NKX2.1 is required for the maintenance of ordered architecture and function of the differentiated thyroid. Mol Endocrinol. 2006;20(8):1796–1809. doi: 10.1210/me.2005-0327 - DOI - PMC - PubMed

MeSH terms