. 2021 Nov 8;16(11):e0259743.
doi: 10.1371/journal.pone.0259743. eCollection 2021.

Functional analysis of N-acetylglucosaminyltransferase-I knockdown in 2D and 3D neuroblastoma cell cultures

Affiliations

Functional analysis of N-acetylglucosaminyltransferase-I knockdown in 2D and 3D neuroblastoma cell cultures

M Kristen Hall et al. PLoS One. .

Abstract

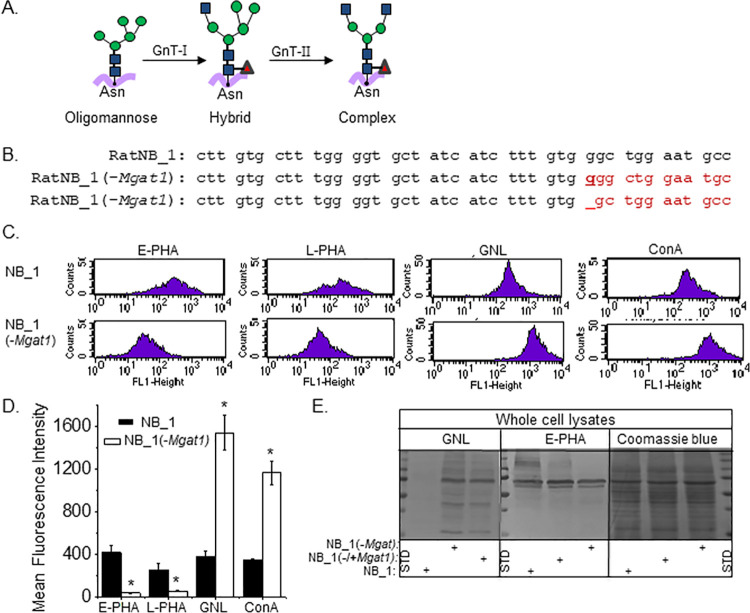
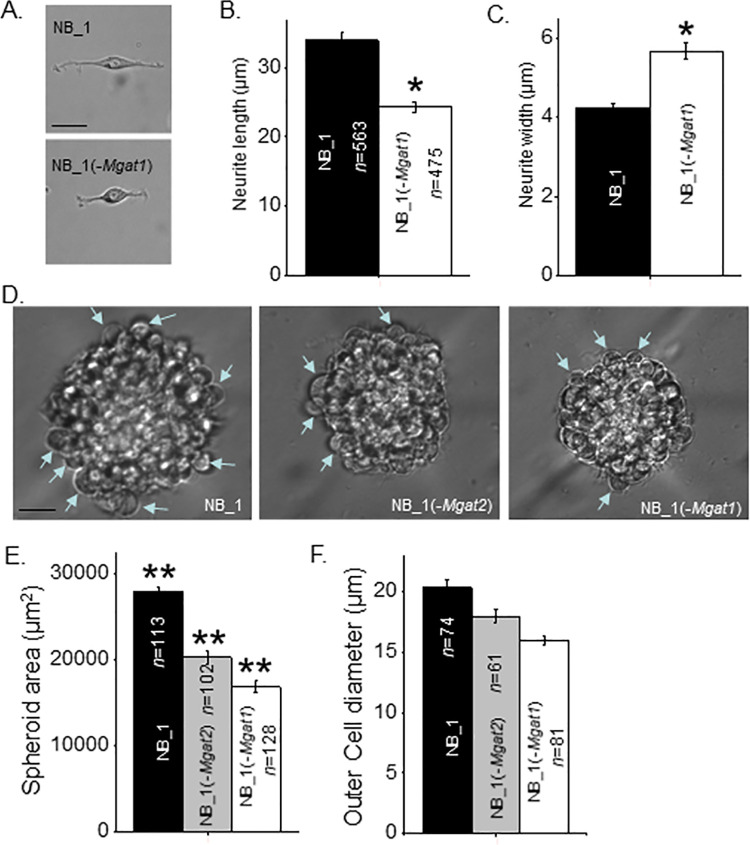
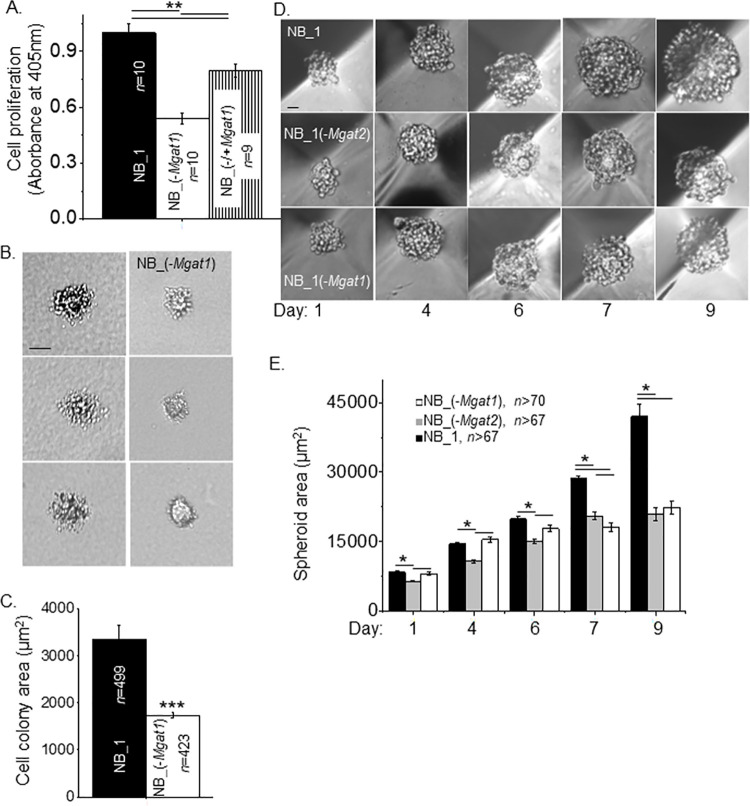
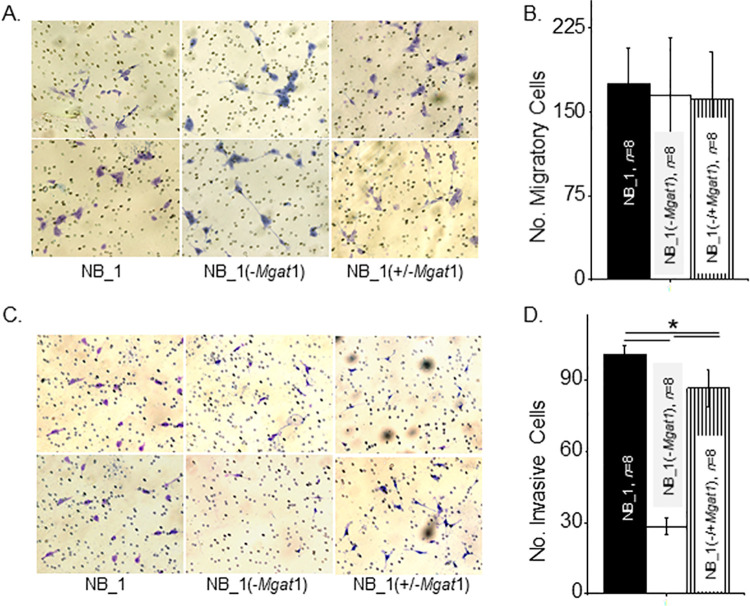
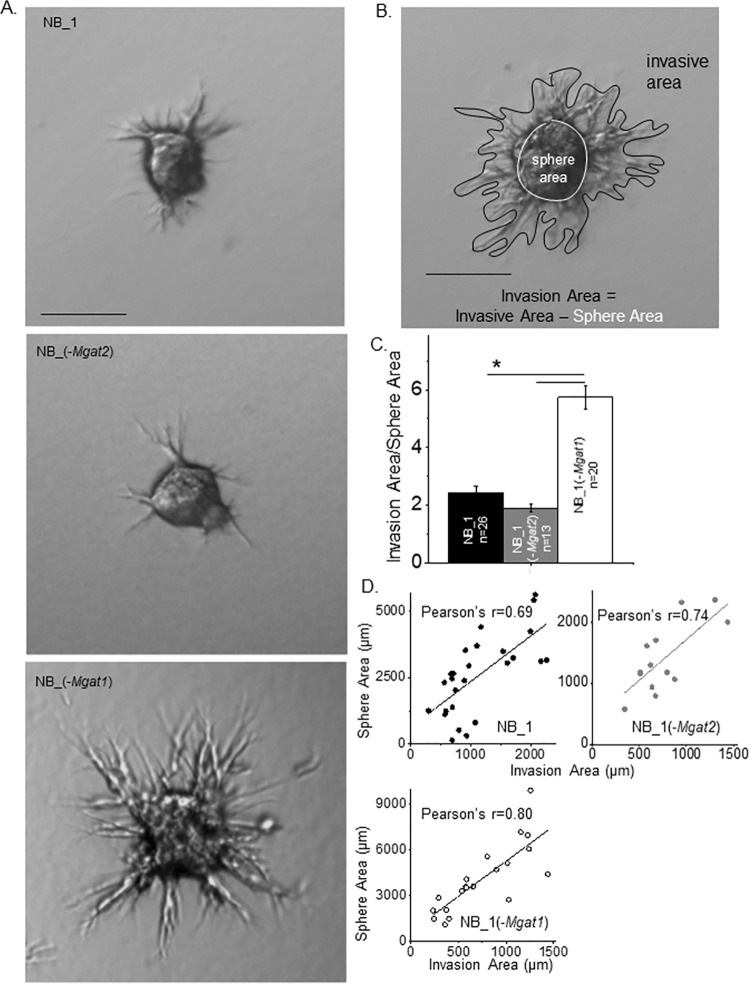
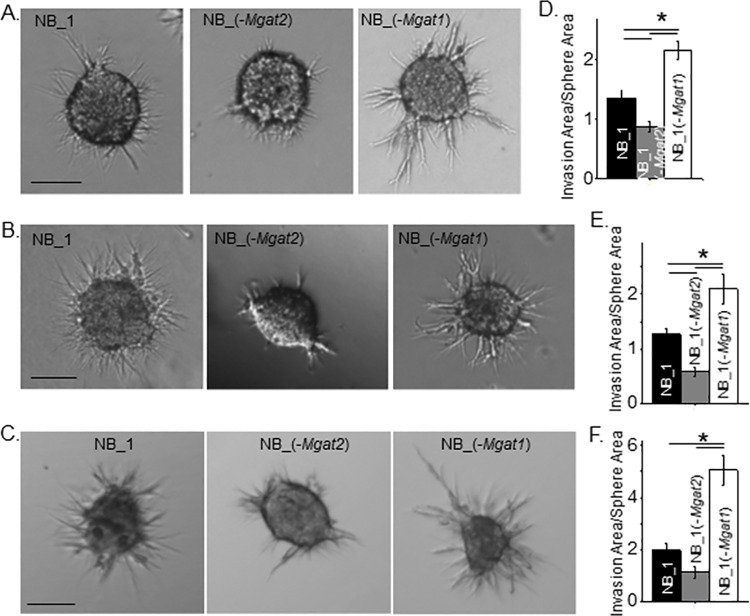
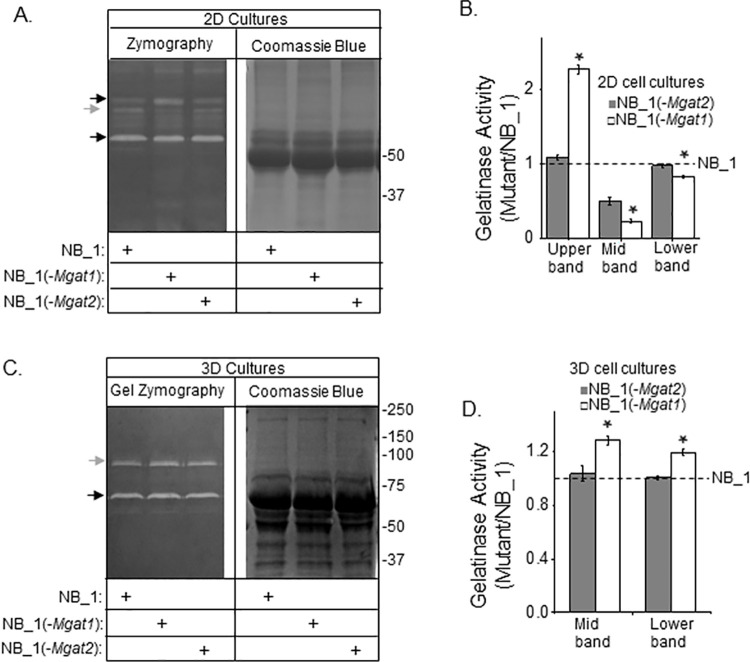
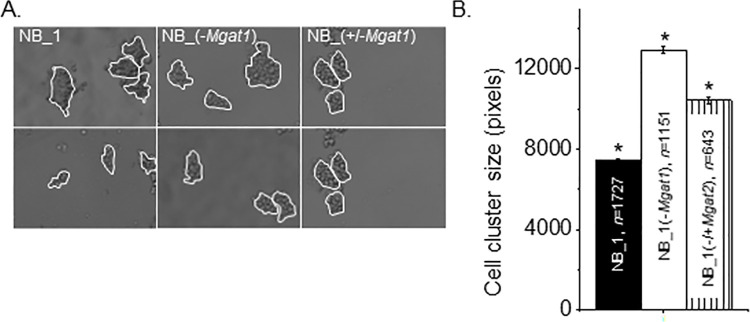
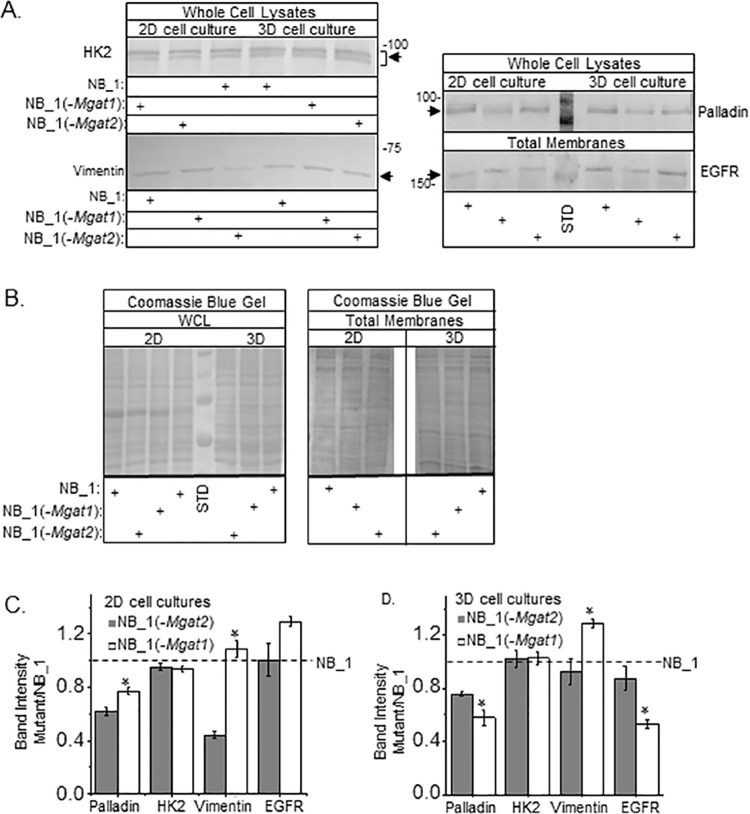
Tumor development can be promoted/suppressed by certain N-glycans attached to proteins at the cell surface. Here we examined aberrant neuronal properties in 2D and 3D rat neuroblastoma (NB) cell cultures with different N-glycan populations. Lectin binding studies revealed that the engineered N-glycosylation mutant cell line, NB_1(-Mgat1), expressed solely oligomannose N-glycans, and verified that the parental cell line, NB_1, and a previous engineered N-glycosylation mutant, NB_1(-Mgat2), expressed significant levels of higher order N-glycans, complex and hybrid N-glycans, respectively. NB_1 grew faster than mutant cell lines in monolayer and spheroid cell cultures. A 2-fold difference in growth between NB_1 and mutants occurred much sooner in 2D cultures relative to that observed in 3D cultures. Neurites and spheroid cell sizes were reduced in mutant NB cells of 2D and 3D cultures, respectively. Cell invasiveness was highest in 2D cultures of NB_1 cells compared to that of NB_1(-Mgat1). In contrast, NB_1 spheroid cells were much less invasive relative to NB_1(-Mgat1) spheroid cells while they were more invasive than NB_1(-Mgat2). Gelatinase activities supported the ranking of cell invasiveness in various cell lines. Both palladin and HK2 were more abundant in 3D than 2D cultures. Levels of palladin, vimentin and EGFR were modified in a different manner under 2D and 3D cultures. Thus, our results support variations in the N-glycosylation pathway and in cell culturing to more resemble in vivo tumor environments can impact the aberrant cellular properties, particularly cell invasiveness, of NB.


Conflict of interest statement

The authors have declared that no competing interest exist.

Figures

Fig 1
Fig 1. Characterization of a neuroblastoma cell line with knockout of GnT-I.
(A) The simplest N-glycan is oligomannose which gives rise to more mature N-glycans, hybrid and complex. GnT-I converts oligomannose to hybrid, and subsequently GnT-II converts hybrid to complex. (B) The coding sequence of rat Mgat1 from 25 to 66 was compared to that isolated from a newly created NB_1(-Mgat1) cell line. Two frameshift mutations were identified, including an inserted g nucleotide and a deletion of a g nucleotide as indicated in bold red font and dash line, respectively. Further the next in-frame start codon does not occur until residue 251 (C) Typical flow cytometry plots of NB_1 (top panels), and NB_1(-Mgat1) (bottom panels) cell lines interacting with fluorescently labelled lectins. (D) Mean fluorescence intensity of E-PHA (n = 5), L-PHA (n = 5), GNL (n = 5) and ConA (n≥2) bound to NB_1 and NB_1 (-Mgat1) cells. Graph denotes mean ± SEM and were compared by student’s t-test (*p < 0.01). (E) Lectin blots and a coomassie blue stained gel of proteins from whole cell lysates of NB_1 and NB_1(-Mgat1) cell lines. Vertical dotted and solid lines denote gel lane dividers and a different gel, respectively. Molecular weight standards (STD) in kDa: 250; 150; 100; 75; 50; and 37 from top to bottom.
Fig 2
Fig 2. Morphology of NB cells and NB spheroids are dependent on the type of N-glycan.
(A) Representative images of NB_1 and NB_(-Mgat1) cells from 2D cell cultures. Length (B) and width (C) of neurites from cells grown in 2D cell cultures. (D) Typical images of 7 days old spheroids obtained at 40x magnification. Blue arrowhead depicts measured cells at outer edge of sphere. (E) Quantification of spheroid size determined from images obtained at 10x magnification. (F) Diameter of cells at outer edge of sphere were quantified. Scale bars are 25 μm. Data are presented as the mean±SEM and were compared by one-way ANOVA followed by Holm-Bonferroni adjustment (*p < 0.02, **p<0.001). n denotes the number of neurites, cell diameters or spheroids measured, respectively.
Fig 3
Fig 3. Diminution of N-glycan diversity alters NB cell growth and spheroid formation.
(A) Cell proliferation of NB_1 and NB_(-Mgat1) cell lines from 2D cell cultures, and the rescued cell line, NB_(-/+Mgat1). (B) Images of growing cell colonies obtained from anchorage independent cell growth of NB_1 and NB_(-Mgat1) cell lines. (C) Quantification of the size of cell colonies after 13 days of growth. (D) Representative images of spheroid formation in NB cell lines at various time points were obtained at 10x magnification. (E) Quantification of spheroid growth from 1 to 9 days in culture. Pearson’s correlation coefficient of the spheroid area as a function of days for NB_1, NB_1(-Mgat2) and NB_(-Mgat1) were 0.99, 0.99, and 0.94, respectively. Growth rates were (in area/days): 10,130, NB_1; 6,625, NB_1(-Mgat2); and 6,036, NB_1(-Mgat1). Scale bars are 25 μm. Data are presented as the mean±SEM and were compared by one-way ANOVA followed by Bonholm adjustment for more than 2 groups and student t-test for 2 groups, (*p < 0.05, **p<0.005, ***p<1 x10⁻⁶). n signifies number of wells (A), cell clusters (C), and spheroids (E).
Fig 4
Fig 4. Substitution of complex with oligomannose types of N-glycans on cell migration and invasion of sparse cells.
(A) Represented images of migratory parental and glycosylation mutant NB cells from the bottom of the membrane insert contained in transwell chambers after 20 h incubation, as indicated. (B) Quantification of the number of migratory cells that crossed the membrane insert per well. (C) Selected micrographs of invading parental and glycosylation mutant NB cells from Matrigel invasion chambers following a 20 h incubation period. (D) Average number of invasive cells per well. Bright purple migratory and invasive cells and pores in membrane are visible. Data are presented as the mean±SEM and were compared by one-way ANOVA using Holm-Bonferroni test (*p < 0.005). n denotes number of wells examined.
Fig 5
Fig 5. Disruption in the N-glycosylation pathway modifies 3D cell invasion.
(A) Images of representative cell invasiveness from 1-day old spheroids of parental and N-glycosylation mutant cell lines cultured for 24 h in Matrigel matrix. (B) Micrograph of invading spheroid cells indicating measured sphere and invasive areas. Scale bars represent 25 μm. (C) The ratio of the invasion area to the sphere area were determined and plotted for NB_1 (n = 22), NB_1(-Mgat2) (n = 15) and NB_1(-Mgat1) (n = 18) cell lines. (D) Pearson’s correlation coefficients from plots of sphere area versus invasion area for each cell line. Data are presented as the mean±SEM and were compared by one-way ANOVA using Holm-Bonferroni test (*p < 0.05). n denotes number of spheroids measured.
Fig 6
Fig 6. NB cell invasion is independent of spheroid cell size and dependent on incubation period of spheroid cells.
Characteristic images of invading spheroid cells from those cultured for 4 (A) and 6 (B) days of NB_1 (n = 45 and 43), NB_1(-Mgat2) (n = 49 and 26) and NB_1(-Mgat1) (n = 59 and 48) cell lines and incubated in Matrigel matrix for 16 h duration, and spheroid cells cultured for 6 days (C) and incubated in Matrigel matrix for 24 h duration of NB_1 (n = 21), NB_1(-Mgat2) (n = 23) and NB_1(-Mgat1) (n = 20) cell lines. Scale bar denotes 25 μm. Quantification of cell invasiveness of the various cell lines in which spheroids were cultured for 4 (D) and 6 (E and F) days and incubated in Matrigel matrix for 16 (D and E) and 24 (F) hours. Data are shown as the mean±SEM and were compared by one-way ANOVA using Holm-Bonferroni post-hoc test (*p < 0.05). n denotes number of invading spheroids. Pearson’s correlation coefficient determined from sphere area versus invasion area were the following: NB_1, 0.69; NB_1(-Mgat2), 0.65; NB_1(-Mgat1), 0.75 from 4 day old spheroid allowed to invade for 16 h. Pearson’s correlation coefficients for the following: NB_1, 0.57; NB_1(-Mgat2), 0.62; NB_1(-Mgat1), 0.51, and NB_1, 0.68; NB_1(-Mgat2), 0.51; NB_1(-Mgat1), 0.79 from 6 day old spheroid allowed to invade for 16 h and 24 h, respectively.
Fig 7
Fig 7. Gelatinase activity of 2D and 3D NB cell cultures.
Gel zymography of conditioned serum-free medium samples from confluent plates (A) and spheroids cells (C) of NB_1, NB_1(-Mgat1) and NB_1(-Mgat2) cell lines (left panels). The amount loaded per well for 2D and 3D samples were 12 μg and 3 μg per well, respectively. Coomassie blue stained gels (right panels) of conditioned samples (10 μg) were loaded per well. Black arrows adjacent to gels denote upper and lower bands while grey arrow signifies middle (Mid) band. Numbers adjacent to gels denote molecular markers. Bands from glycosylation mutant samples were normalized to those NB_1 for 2D (B) and 3D (D) cell cultures. Data are shown as the mean±SEM and were compared by one-way ANOVA using Holm-Bonferroni post-hoc test (*p < 0.05). n = 3 for upper, middle and lower bands from the various samples.
Fig 8
Fig 8. Modification of expression levels of Mgat1 impact cell-cell adhesion.
(A) Selected DIC images obtained from NB_1 (left panels), NB_1(-Mgat1) (middle panels), and NB_1(-/+MGAT1) (right panels) cell lines. Cell aggregates of more than 5 cells, as encircled in white, were analyzed. (B) The average area of cell aggregates from 3 cell dissociation experiments for each cell line. *P<0.01. Mean differences were compared using One-way ANOVA followed by Holmes-Bonferroni’s test was used to compare differences in mean values. A value of P<0.00000001 was considered significant (*). n signifies number of cell clusters.
Fig 9
Fig 9. Palladin, vimentin and EGFR levels were altered by changes in the N-glycosylation pathway.
(A) Western blots of HK2, palladin, and vimentin in whole cell lysates (WCL), and EGFR in total membranes (TM) from 2D and 3D cell cultures. Number adjacent to blot represents molecular weight marker in kDa. Arrows point to immunobands of interest. Protein levels loaded per well for detection of vimentin, EGFR and HK2 in both 2D and 3D samples were 20 μg per well while those for palladin were 20 μg and 10 μg for 2D and 3D samples, respectively. Blot of palladin has molecular weight markers of 75 and 100 kDa in the center lane while that of EGFR has the 150 kDa marker. Standards were not removed to show 2D and 3D samples were run on same gel and blots developed in a similar manner. (B) Coomassie blue stained gels of whole cell lysates and total membranes from 2D (20 μg) and 3D (20 μg) cell cultures. Molecular weight standards (STD) in kDa: 250; 150; 100; and 75 from top to bottom. Immunobands from NB_1(-Mgat2) and NB_1(-Mgat1) cell lines were normalized to those from the NB_1 cell line from 2D (C) and 3D (D) cultures. Data are represented as the mean±SEM and were compared by student’s T-test (*p < 0.05). n values were 3 where n represents a band.

References

    1. Ho WL, Hsu WM, Huang MC, Kadomatsu K, Nakagawara A. Protein glycosylation in cancers and its potential therapeutic applications in neuroblastoma. Journal of hematology & oncology. 2016;9(1):100. Epub 2016/11/01. doi: 10.1186/s13045-016-0334-6 ; PubMed Central PMCID: PMC5041531. - DOI - PMC - PubMed
    1. Fuster MM, Esko JD. The sweet and sour of cancer: glycans as novel therapeutic targets. Nat Rev Cancer. 2005;5(7):526–42. Epub 2005/08/03. doi: 10.1038/nrc1649 . - DOI - PubMed
    1. Kamijo T, Nakagawara A. Molecular and genetic bases of neuroblastoma. International journal of clinical oncology. 2012;17(3):190–5. Epub 2012/05/17. doi: 10.1007/s10147-012-0415-7 - DOI - PubMed
    1. Stanley P, Taniguchi N, Aebi M. N-Glycans. In: Varki A, Cummings R, Esko J, Freeze H, Stanley P, Bertozzi C, et al.., editors. Essentials of Glycobiology. 2nd ed. Cold Spring Harbor: Cold Spring Harbor Laboratory Press; 2009. p. Chapter 9. - PubMed
    1. Kumar HR, Zhong X, Rescorla FJ, Hickey RJ, Malkas LH, Sandoval JA. Proteomic approaches in neuroblastoma: a complementary clinical platform for the future. Expert Rev Proteomics. 2009;6(4):387–94. Epub 2009/08/18. doi: 10.1586/epr.09.58 . - DOI - PubMed

Substances