. 2022 Aug 24;75(1):e329-e337.
doi: 10.1093/cid/ciab945.

Symptoms and Severe Acute Respiratory Syndrome Coronavirus 2 (SARS-CoV-2) Positivity in the General Population in the United Kingdom

Collaborators, Affiliations

Symptoms and Severe Acute Respiratory Syndrome Coronavirus 2 (SARS-CoV-2) Positivity in the General Population in the United Kingdom

Karina Doris Vihta et al. Clin Infect Dis. .

Abstract

Background: "Classic" symptoms (cough, fever, loss of taste/smell) prompt severe acute respiratory syndrome coronavirus 2 (SARS-CoV-2) polymerase chain reaction (PCR) testing in the United Kingdom. Studies have assessed the ability of different symptoms to identify infection, but few have compared symptoms over time (reflecting variants) and by vaccination status.

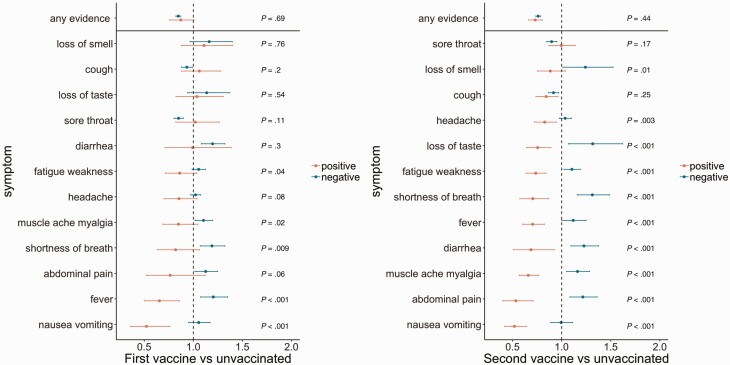
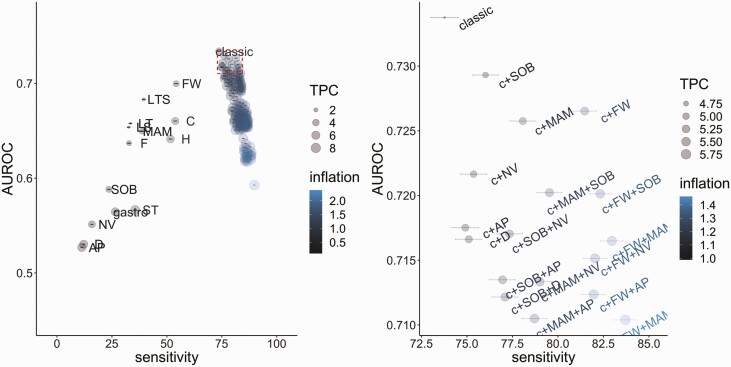
Methods: Using the COVID-19 Infection Survey, sampling households across the United Kingdom, we compared symptoms in PCR-positives vs PCR-negatives, evaluating sensitivity of combinations of 12 symptoms (percentage symptomatic PCR-positives reporting specific symptoms) and tests per case (TPC) (PCR-positives or PCR-negatives reporting specific symptoms/ PCR-positives reporting specific symptoms).

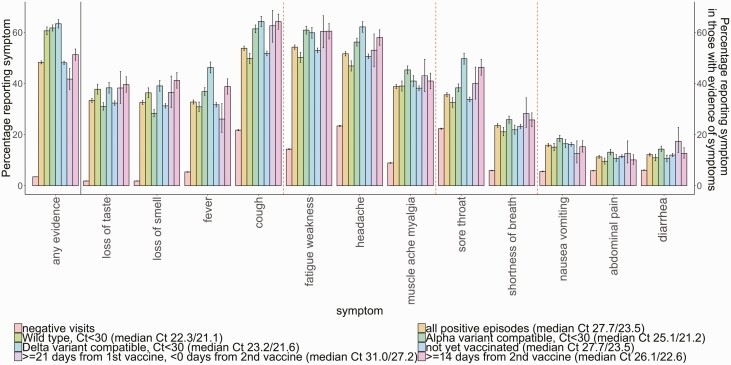
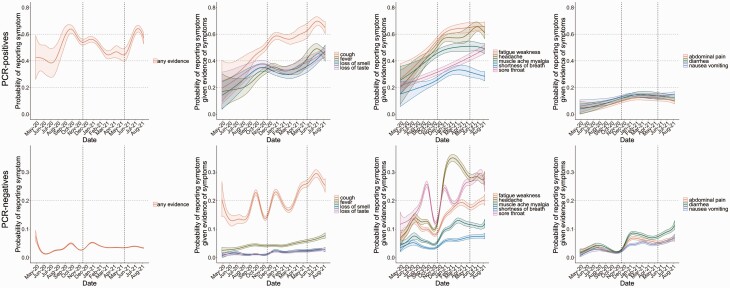
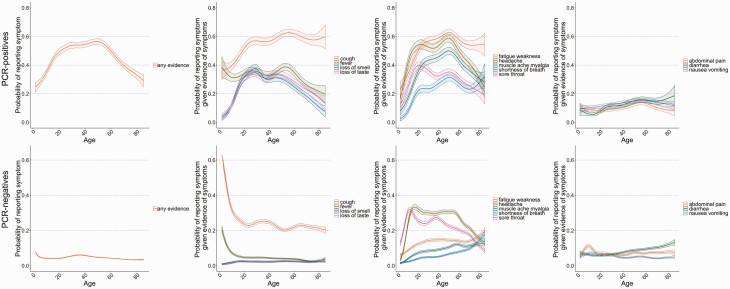
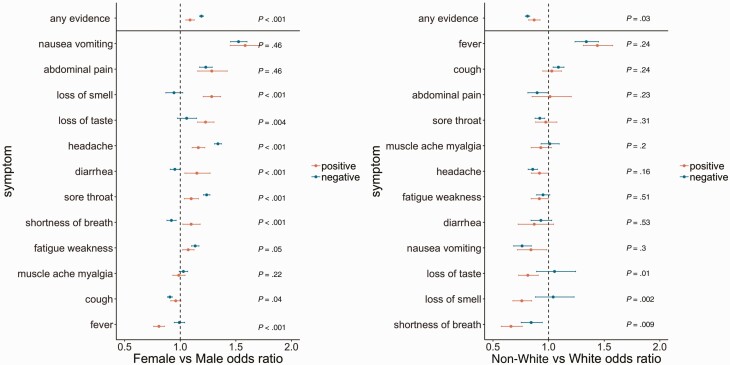
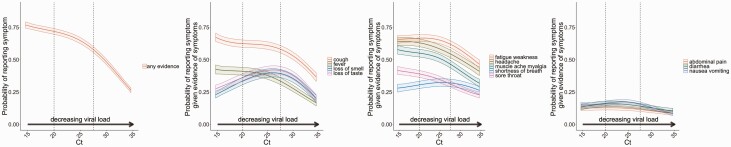
Results: Between April 2020 and August 2021, 27 869 SARS-CoV-2 PCR-positive episodes occurred in 27 692 participants (median 42 years), of whom 13 427 (48%) self-reported symptoms ("symptomatic PCR-positives"). The comparator comprised 3 806 692 test-negative visits (457 215 participants); 130 612 (3%) self-reported symptoms ("symptomatic PCR-negatives"). Symptom reporting in PCR-positives varied by age, sex, and ethnicity, and over time, reflecting changes in prevalence of viral variants, incidental changes (eg, seasonal pathogens (with sore throat increasing in PCR-positives and PCR-negatives from April 2021), schools reopening) and vaccination rollout. After May 2021 when Delta emerged, headache and fever substantially increased in PCR-positives, but not PCR-negatives. Sensitivity of symptom-based detection increased from 74% using "classic" symptoms, to 81% adding fatigue/weakness, and 90% including all 8 additional symptoms. However, this increased TPC from 4.6 to 5.3 to 8.7.

Conclusions: Expanded symptom combinations may provide modest benefits for sensitivity of PCR-based case detection, but this will vary between settings and over time, and increases tests/case. Large-scale changes to targeted PCR-testing approaches require careful evaluation given substantial resource and infrastructure implications.

Keywords: SARS-CoV-2; community; symptoms; testing.


Figures

Figure 1.
Figure 1.
Percentage of individuals with and without SARS-CoV-2 infection self-reporting symptoms, presented as a proportion of all those reporting symptoms. Wild-type defined as S-gene positive before 17 November 2020; Alpha-compatible defined as S-gene negative from 17 November 2020 through 17 May 2021, Delta-compatible defined as S-gene positive from 17 May 2021. Post-vaccination positives split into not yet vaccinated, those 21 days after 1st vaccination and before 2nd vaccination, and 14 days or more after 2nd vaccination. Denominators will vary; for example, the absolute number of PCR-positives is much smaller 14 days or more post 2nd vaccination than unvaccinated. The 2 median values are median Ct in all and symptomatic PCR-positives in each group. See Figure 6 for associations between Ct and symptoms. Red dashed lines indicate symptom clusters based on hierarchical clustering (Supplementary Figure 3). See Figures 2–6 for adjusted analyses as unadjusted summaries do not control for confounding. Abbreviations: Ct, cycle threshold; PCR, polymerase chain reaction; SARS-CoV-2, severe acute respiratory syndrome coronavirus 2.
Figure 2.
Figure 2.
By calendar time, probability of reporting any evidence of symptoms (1st column), and specific classic symptoms (2nd column), systemic and respiratory symptoms (3rd column) and gastrointestinal symptoms (4th column) in those with evidence of symptoms, in SARS-CoV-2 PCR-positives (top row) and PCR-negatives (bottom row). Models adjusted for age, sex, ethnicity (presented at the reference category age 45, male, White). Top and bottom rows have different scales for the y-axis. Dashed lines at 17 November 2020 and 17 May 2021 indicate the emergence of Alpha and Delta, respectively, see Supplementary Figure 1. Abbreviations: PCR, polymerase chain reaction; SARS-CoV-2, severe acute respiratory syndrome coronavirus 2.
Figure 3.
Figure 3.
By age, probability of reporting any evidence of symptoms (1st column), specific classic symptoms (2nd column), systemic and respiratory symptoms (3rd column), and gastrointestinal symptoms (4th column) in those with evidence of symptoms, in positives (top row) and PCR-negatives (bottom row). Models adjusted for calendar date, sex, ethnicity (reference category 1 January 2021, male, White). Top and bottom rows have different scales for the y-axis. Abbreviation: PCR, polymerase chain reaction.
Figure 4.
Figure 4.
Odds ratios (95% CI) by sex and ethnicity of reporting any evidence of symptoms, as well as each of 12 specific symptoms in those with evidence of symptoms, comparing SARS-CoV-2 PCR-positives (red) and PCR-negatives (turquoise). Data are shown by sex (female vs male, left), and ethnicity (non-White vs White, right). P-values are heterogeneity tests between the effects of sex and ethnicity on reporting symptoms in PCR-positives vs PCR-negatives. or Models adjusted for calendar date (Figure 2), age (Figure 3), sex, and ethnicity. Where 95% CI cross 1, there is no evidence that sex/ethnicity affects the odds of reporting that symptom given evidence of symptoms in PCR-positives/PCR-negatives. Where there is evidence of heterogeneity, there is a different effect of sex/ethnicity on reporting the symptom in PCR-positives vs PCR-negatives. Abbreviations: CI, confidence interval; PCR, polymerase chain reaction.
Figure 5.
Figure 5.
Odds ratios (95% CI) by vaccination status of reporting any evidence of symptoms, as well as each of 12 specific symptoms in those with evidence of symptoms, comparing SARS-CoV-2 PCR-positives (red) and PCR-negatives (turquoise). Data are shown by vaccination status (≥21 days from 1st vaccine and before 2nd vaccine vs pre-vaccination, left, and ≥14 days from 2nd vs pre-vaccination, right). p-values are heterogeneity tests between the effects of vaccination on reporting symptoms in PCR-positives vs PCR-negatives. Note: models adjusted for calendar date (Figure 2), age (Figure 3), sex (Figure 4) and ethnicity (Figure 5). Where 95% CI cross 1, there is no evidence that vaccination status affects the odds of reporting that symptom given evidence of symptoms in PCR-positives/PCR-negatives. Where there is evidence of heterogeneity, there is a different effect of vaccination status on reporting the symptom in PCR-positives vs PCR-negatives. Abbreviations: CI, confidence interval; PCR, polymerase chain reaction; SARS-CoV-2, severe acute respiratory syndrome coronavirus 2.
Figure 6.
Figure 6.
By Ct values, probability of self-reported symptoms in individuals with PCR-confirmed SARS-CoV-2 infection. First column: any symptoms; 2nd, 3rd, 4th columns: each of the 12 specific symptoms in those who reported any symptom(s). Models adjusted for calendar date (Figure 2), age (Figure 3), sex, and ethnicity (Figure 4) (reference category 1 January 2021, 45, male, White). See Supplementary Figure 4 for models also adjusting for S-gene positivity pattern with similar results. Abbreviations: Ct, cycle threshold; PCR, polymerase chain reaction; SARS-CoV-2, severe acute respiratory syndrome coronavirus 2.
Figure 7.
Figure 7.
Performance of individual symptoms, as well as the classic 4 symptoms (cough, fever, loss of taste/smell), classic plus all possible combinations of 1/2/3/4 symptoms, and any of the 12 named symptoms, in predicting SARS-CoV-2 positivity in those with evidence of symptoms in terms of sensitivity and overall accuracy (AUROC). For exact values, see Supplementary Table 8. Right-hand panel is an expanded version of the top right corner of the left panel (red box, AUROC >90th quantile, sensitivity >sensitivity of combination of classic 4 symptoms). Inflation (relative numbers reporting these symptoms compared to classic symptoms) and TPC are also included in the visualization. TPC = 1/positive predictive value. By definition, as the number of symptoms increases, sensitivity also increases. Abbreviations: AP, abdominal pain; c, classic; C, cough; D, diarrhea; F, fever; FW, weakness/tiredness; H, headache; LS, loss of smell; LT, loss of taste; LTS, loss of taste or smell; AM, muscle ache/myalgia; NV, nausea/vomiting; SARS-CoV-2, severe acute respiratory syndrome coronavirus 2; SOB, shortness of breath; ST, sore throat; TPC, tests per case.

Similar articles

Cited by

References

    1. Walker AS, Pritchard E, House T, et al. Ct threshold values, a proxy for viral load in community SARS-CoV-2 cases, demonstrate wide variation across populations and over time. Elife 2021; 10:1–18. - PMC - PubMed
    1. Lee LYW, Rozmanowski S, Pang M, et al. Severe acute respiratory syndrome coronavirus 2 (SARS-CoV-2) infectivity by viral load, s gene variants and demographic factors, and the utility of lateral flow devices to prevent transmission. Clin Infect Dis 2021:1–9. Available at: https://academic.oup.com/cid/advance-article/doi/10.1093/cid/ciab421/627... - DOI - PMC - PubMed
    1. Syangtan G, Bista S, Dawadi P, et al. Asymptomatic SARS-CoV-2 carriers: a systematic review and meta-analysis. Front Public Heal 2021; 8:1–10. - PMC - PubMed
    1. Sah P, Fitzpatrick MC, Zimmer CF, Abdollahi E, Juden-kelly L.. Asymptomatic SARS-CoV-2 infection: a systematic review and meta-analysis. Proc Natl Acad Sci USA 2021; 118:1–12. - PMC - PubMed
    1. Pritchard E, Matthews PC, Stoesser N, et al. Impact of vaccination on new SARS-CoV-2 infections in the United Kingdom. Nat Med 2021. doi: 10.1038/s41591-021-01410-w. - DOI - PMC - PubMed

Publication types