

doi: 10.1016/j.jinf.2021.11.001.
Epub 2021 Nov 6.
Divergent humoral responses in mild to moderate SARS-CoV-2 infection over time - indication of persistence of the virus?
Affiliations
- PMID: 34748825
- PMCID: PMC8570801
- DOI: 10.1016/j.jinf.2021.11.001
Item in Clipboard
Divergent humoral responses in mild to moderate SARS-CoV-2 infection over time - indication of persistence of the virus?
J Infect.
2022 Mar.
Abstract
Keywords: Antibodies; COVID-19; IgA; SARS-CoV-2; Serology.
Conflict of interest statement
Declaration of Competing Interest The authors declare that they have no competing interests.
Figures
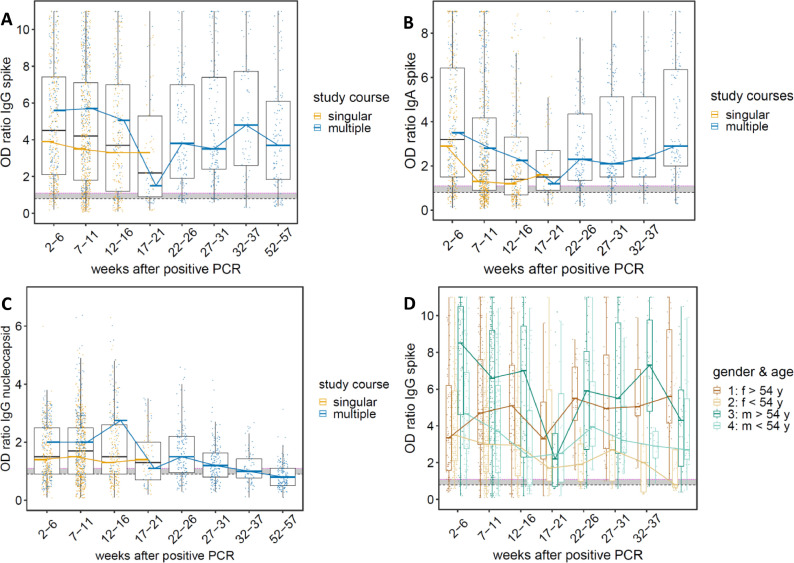
Overall dynamic changes in anti-SARS-CoV-2 antibody levels (IgG and IgA) over time. Results were grouped according to the time after positive PCR diagnosis: 2–6 weeks (n = 408, 21.3%), 7–11 weeks (n = 690, 36.0%), 12–16 weeks (n = 257, 13.4%), 17–21 weeks (n = 73, 3.8%), 22–26 weeks (n = 143, 7.5%), 27–31 weeks (n = 156, 8.1%), 32–37 weeks (n = 72, 3.8%) and 52–57 weeks (n = 119, 6.2%). Horizontal bold lines indicate median values; boxes indicate quartiles 1 and 3; whiskers indicate 1.5 * IQR confidence intervals; dotted magenta line indicate optical density (OD) ratio at 1.1 (positive cut-off); dotted black line indicate OD ratio at 0.8 for anti-S antibodies, 0.9 for anti-N IgG (values below are considered negative); gray shaded region in-between OD ratio 0.8/0.9–1.1 contains borderline results. Black line represents all individuals, independent of the number of study courses. Yellow dots and line represent individuals performing a singular study course (1–5 longitudinal blood draws) and blue dots and line represent individuals with multiple study courses (1–15 longitudinal blood draws). Each point represents a single measurement. (A) anti-spike (S) IgG; (B) anti-S IgA; (C) anti-nucleocapsid (N) IgG; (D) Gender and age specific dynamic changes in anti-S IgG antibody levels over time. 1 = female individuals with age higher than 54 years; 2 = female individuals with age lower than 54 years; 3 = male individuals with age higher than 54 years; 4 = male individuals with age lower than 54 years.
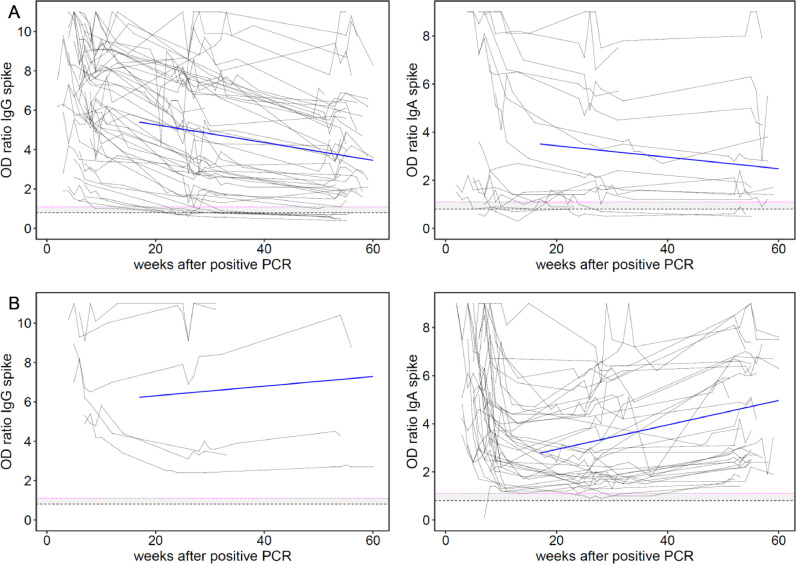
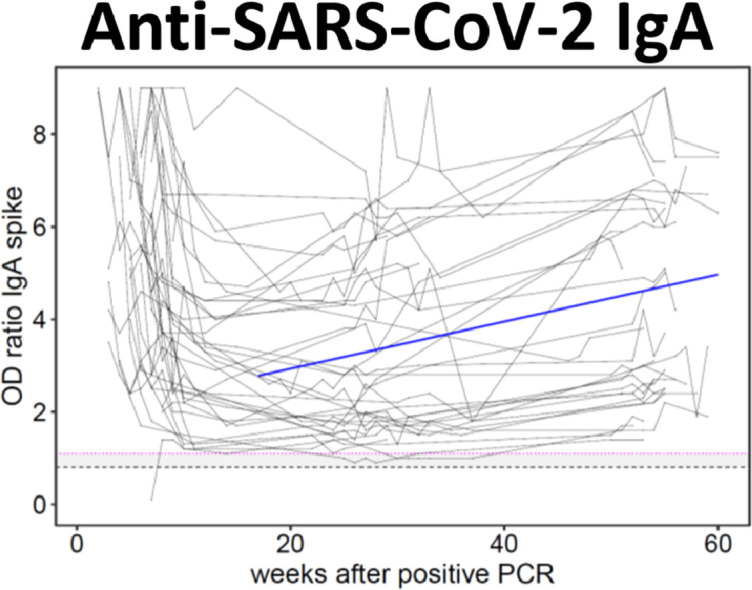
Longitudinal courses of individual anti-SARS-CoV-2 antibody levels (IgG and IgA) over time. Individual longitudinal anti-spike IgG and anti-spike IgA courses were analyzed utilizing robust regression (period week 17–57) using an MM estimator, which is an M-estimation with Turkey's biweight initialized by a specific S-estimator. The corresponding slopes were categorized according to the following properties of their individual course: Declining antibody concentrations were defined by a negative slope value (slope < 0 OD ratio/week); increasing antibody concentrations were defined by a positive slope value (slope > 0 OD ratio/week). Blue line represents an illustrative line indicating the averaged present slope calculated by the robust regression of data from week 17 to 57; dotted magenta line indicate optical density (OD) ratio at 1.1 (positive cut-off); dotted black line indicate OD ratio of 0.8 (values below are considered negative); gray shaded region in-between OD ratio 0.8–1.1 contains borderline results. Each point represents a single measurement. (A) anti-spike IgG (n = 47, 89%) and IgA (n = 19, 36%) antibody levels with declining tendency. (B) anti-spike IgG (n = 6, 11%) and IgA (n = 34, 64%) antibody levels with increasing tendency.
References
-
- Korte W., Buljan M., Rösslein M., Wick P., Golubov V., Jentsch J., et al. SARS-CoV-2 IgG and IgA antibody response is gender dependent; and IgG antibodies rapidly decline early on. J Infect. 2021;82(1):e11–ee4. JanPubMed PMID: 32853597. Pubmed Central PMCID: PMC7445467. Epub 2020/08/28. - PMC - PubMed
-
- Manisty C., Treibel T.A., Jensen M., Semper A., Joy G., Gupta R.K., et al. Time series analysis and mechanistic modelling of heterogeneity and sero-reversion in antibody responses to mild SARS‑CoV-2 infection. EBioMedicine. 2021;65 MarPubMed PMID: 33662833. Pubmed Central PMCID: PMC7920816. Epub 2021/03/05. eng. - PMC - PubMed
-
- Wickham M.A.H., Bryan J., Chang W., McGowan L.D.A., François R., Grolemund G., et al. Welcome to the tidyverse. J Open Source Softw. 2019;4(43):1686.
-
- Laing E.D., Epsi N.J., Richard S.A., Samuels E.C., Wang W., Vassell R., et al. medRxiv; 2021. SARS-CoV-2 antibodies remain detectable 12 months after infection and antibody magnitude is associated with age and COVID-19 severity. 2021.04.27.21256207.
Publication types
MeSH terms
Substances
LinkOut - more resources
Full Text Sources
Medical
Miscellaneous
