. 2022 Apr;41(2):403-415.
doi: 10.14366/usg.21044. Epub 2021 Aug 17.

Speckle tracking ultrasonography as a new tool to assess diaphragmatic function: a feasibility study

Affiliations

Speckle tracking ultrasonography as a new tool to assess diaphragmatic function: a feasibility study

Sebastian Johannes Fritsch et al. Ultrasonography. 2022 Apr.

Abstract

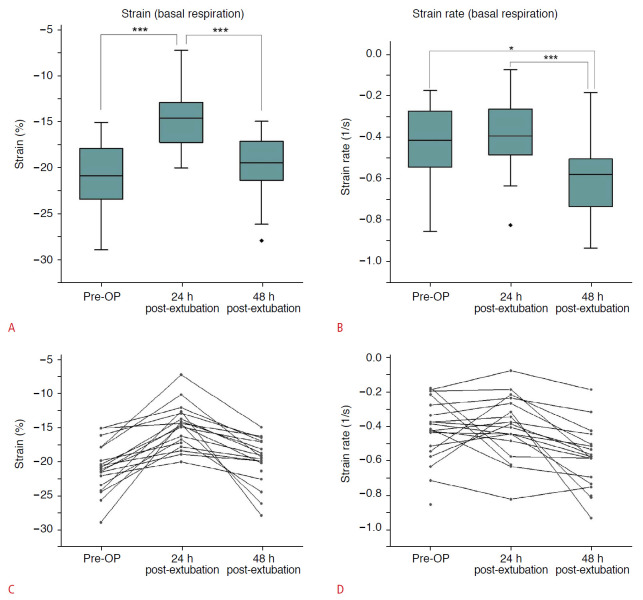
A reliable method of measuring diaphragmatic function at the bedside is still lacking. Widely used two-dimensional (2D) ultrasonographic measurements, such as diaphragm excursion, diaphragm thickness, and fractional thickening (FT) have failed to show clear correlations with diaphragmatic function. A reason for this is that 2D ultrasonographic measurements, like FT, are merely able to measure the deformation of muscular diaphragmatic tissue in the transverse direction, while longitudinal measurements in the direction of contracting muscle fibres are not possible. Speckle tracking ultrasonography, which is widely used in cardiac imaging, overcomes this disadvantage and allows observations of movement in the direction of the contracting muscle fibres, approximating muscle deformation and the deformation velocity. Several studies have evaluated speckle tracking as a promising method to assess diaphragm contractility in healthy subjects. This technical note demonstrates the feasibility of speckle tracking ultrasonography of the diaphragm in a group of 20 patients after an aortocoronary bypass graft procedure. The results presented herein suggest that speckle tracking ultrasonography is able to depict alterations in diaphragmatic function after surgery better than 2D ultrasonographic measurements.

Keywords: Diaphragm; Fractional thickening; Speckle tracking ultrasound; Ultrasonography.


Conflict of interest statement

N. H. received technical support from GE Healthcare. All remaining authors have declared no conflicts of interest.

Figures

Fig. 1.
Fig. 1.. Flowchart of the patient population.
The flowchart shows the course of examined patient numbers in the present feasibility study over time. Additionally, it shows the number of patients excluded with the respective reasons. CABG, coronary artery bypass graft; ST, speckle tracking.
Fig. 2.
Fig. 2.. Ultrasonographic imaging of the diaphragm recorded in B-mode in the zone of apposition.
The diaphragm is displayed between the two echogenic lines above the liver tissue, which represent the pleura and peritoneum.
Fig. 3.
Fig. 3.. A screenshot of the Q-analysis tool of the EchoPac software.
A. The subscreen shows a B-mode picture of the diaphragm with the respective regions of interest. B. This diagram visualizes contraction in relation to time (x-axis) and localization in the respective region of interest (ROI) (y-axis). C. The main graphs represent the strain values of the different ROIs over the course of one breathing cycle.
Fig. 4.
Fig. 4.. Speckle tracking analysis of diaphragmatic movement under basal respiration.
A, B. The figures depict the values for strain and strain rate over time. The box indicates the interquartile range (IQR) and the median, the whiskers indicate 1.5 times the IQR and the dots indicate outliers (Nota bene: negative values represent contraction). C, D. Plots represent the individual data of all patients for strain and strain rate over the three measurements. P-values were calculated using the Nemenyi test. *P<0.05, ***P<0.001.
Fig. 5.
Fig. 5.. Speckle tracking analysis of diaphragmatic movement under forced respiration.
A, B. The figures depict the values for strain and strain rate over the time. The box indicates the interquartile range (IQR) and the median, the whiskers indicate 1.5 times the IQR and the dots indicate outliers (Nota bene: negative values represent contraction). C, D. Plots represent the individual data of all patients for strain and strain rate over the three measurements. P-values were calculated using the Nemenyi test. **P<0.01.
Fig. 6.
Fig. 6.. Fractional thickening of the diaphragm.
A, B. The sub-figures show the values of fractional thickening under basal (A) and forced respiration (B). The box indicates the interquartile range (IQR) and the median, the whiskers indicate 1.5 times the IQR, and the dots indicate outliers. C, D. Plots represent the individual data of all patients for fractional thickening under basal (C) and forced respiration (D) over the three measurements. P-values were calculated using the Nemenyi test. *P<0.05.
Fig. 7.
Fig. 7.. Correlation between received fluids and diaphragmatic function 48 hours after extubation.
These scatter plots show the correlations between the strain (normalized) versus volume (A) and the strain rate (normalized) versus volume (B), showing a relationship between the received fluid amount within the first 24 hours in the intensive care unit (ICU) and diaphragmatic function 48 hours after extubation, as assessed by speckle tracking analysis.

References

    1. Matamis D, Soilemezi E, Tsagourias M, Akoumianaki E, Dimassi S, Boroli F, et al. Sonographic evaluation of the diaphragm in critically ill patients: technique and clinical applications. Intensive Care Med. 2013;39:801–810. - PubMed
    1. Orde SR, Boon AJ, Firth DG, Villarraga HR, Sekiguchi H. Diaphragm assessment by two dimensional speckle tracking imaging in normal subjects. BMC Anesthesiol. 2016;16:43. - PMC - PubMed
    1. D'Hooge J, Heimdal A, Jamal F, Kukulski T, Bijnens B, Rademakers F, et al. Regional strain and strain rate measurements by cardiac ultrasound: principles, implementation and limitations. Eur J Echocardiogr. 2000;1:154–170. - PubMed
    1. Waldman LK, Fung YC, Covell JW. Transmural myocardial deformation in the canine left ventricle: normal in vivo three-dimensional finite strains. Circ Res. 1985;57:152–163. - PubMed
    1. Helle-Valle T, Crosby J, Edvardsen T, Lyseggen E, Amundsen BH, Smith HJ, et al. New noninvasive method for assessment of left ventricular rotation: speckle tracking echocardiography. Circulation. 2005;112:3149–3156. - PubMed

Grants and funding

LinkOut - more resources