. 2021 Nov 8;40(1):351.
doi: 10.1186/s13046-021-02155-7.

C-Myc-activated long non-coding RNA LINC01050 promotes gastric cancer growth and metastasis by sponging miR-7161-3p to regulate SPZ1 expression

Affiliations

C-Myc-activated long non-coding RNA LINC01050 promotes gastric cancer growth and metastasis by sponging miR-7161-3p to regulate SPZ1 expression

Ziwei Ji et al. J Exp Clin Cancer Res. .

Erratum in

Abstract

Background: Growing evidence shows that long non-coding RNAs (lncRNAs) play significant roles in cancer development. However, the functions of most lncRNAs in human gastric cancer are still not fully understood. Here, we explored the role of a novel c-Myc-activated lncRNA, LINC01050, in gastric cancer progression.

Methods: The expression of LINC01050 in the context of gastric cancer was assessed using The Cancer Genome Atlas datasets. Its functions in gastric cancer were investigated through gain- and loss-of-function experiments combined with the Cell Counting Kit-8 assays, colony-forming assays, Transwell assays, flow cytometry, Western blot analyses, and xenograft tumor and mouse metastasis models. Potential LINC01050 transcription activators were screened via bioinformatics and validated by chromatin immunoprecipitation and luciferase assays. The interaction between LINC01050 and miR-7161-3p and the targets of miR-7161-3p were predicted by bioinformatics analysis and confirmed by a luciferase assay, RNA immunoprecipitation, RNA pull-down, and rescue experiments.

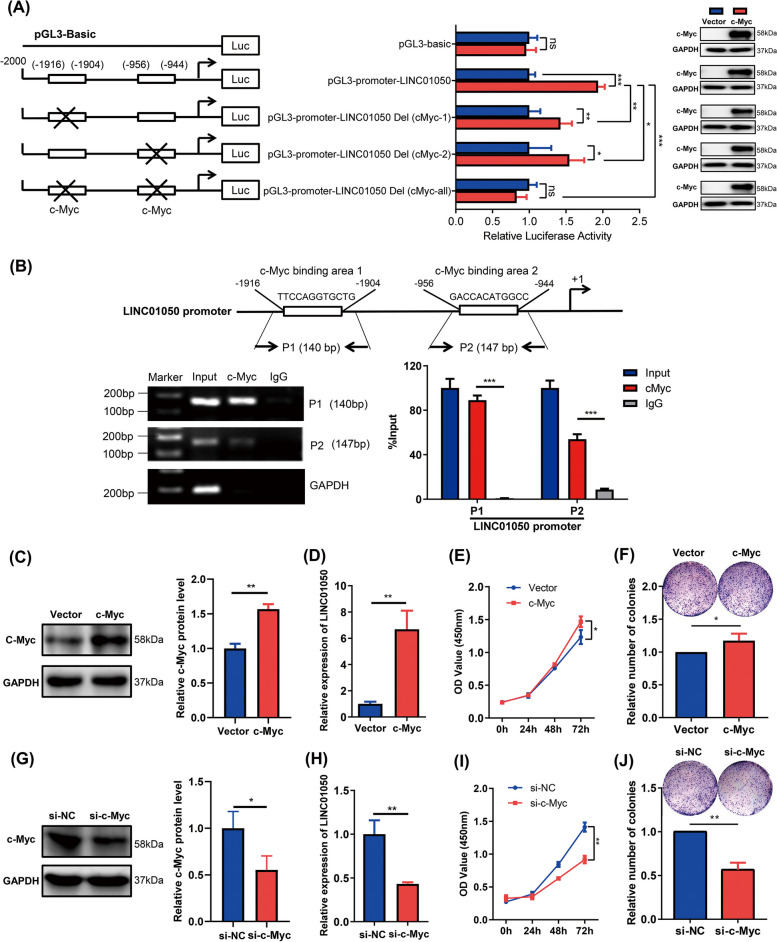
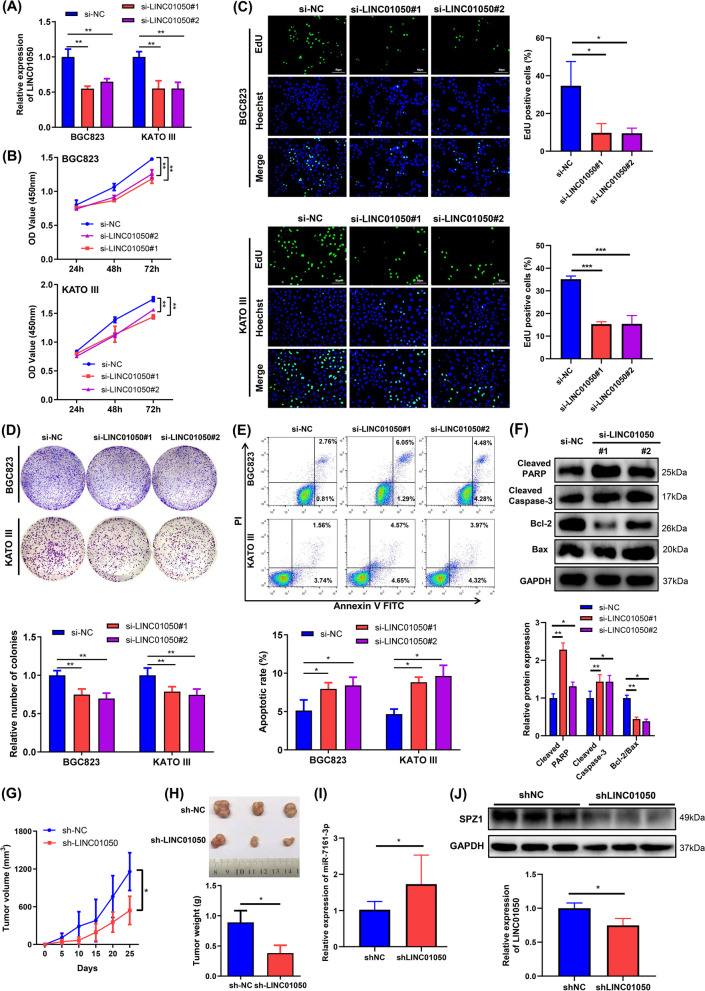
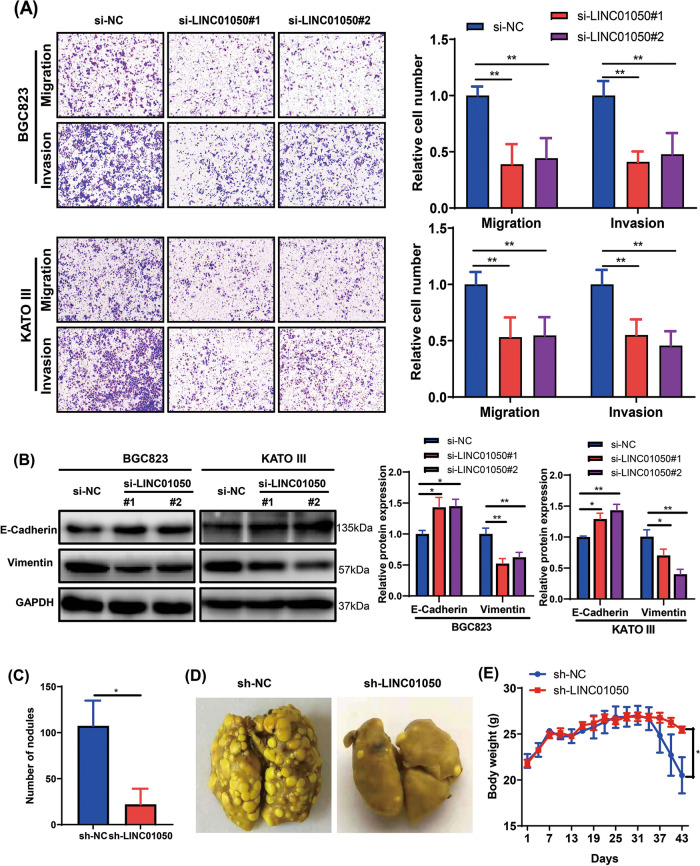
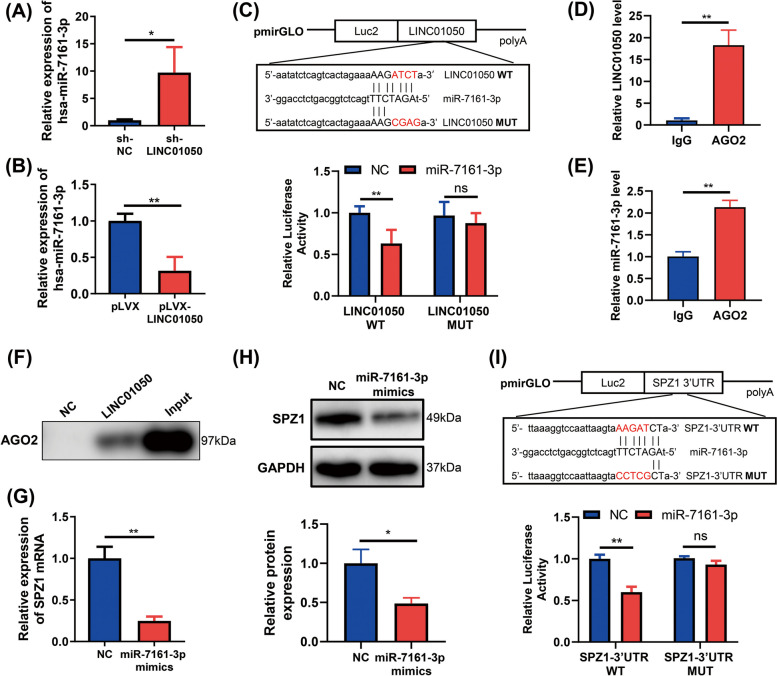
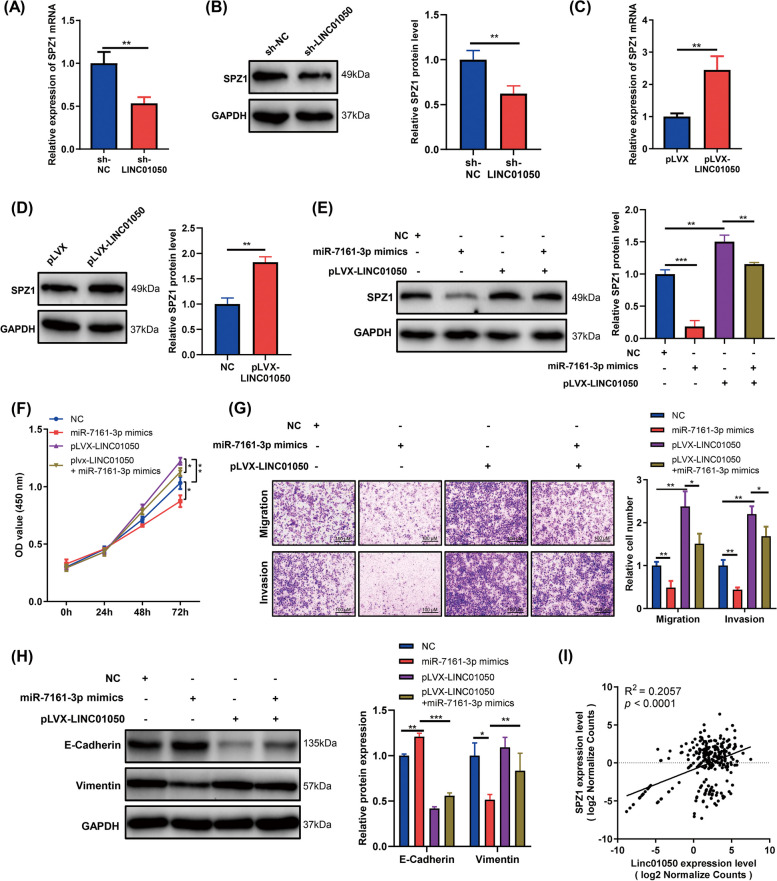
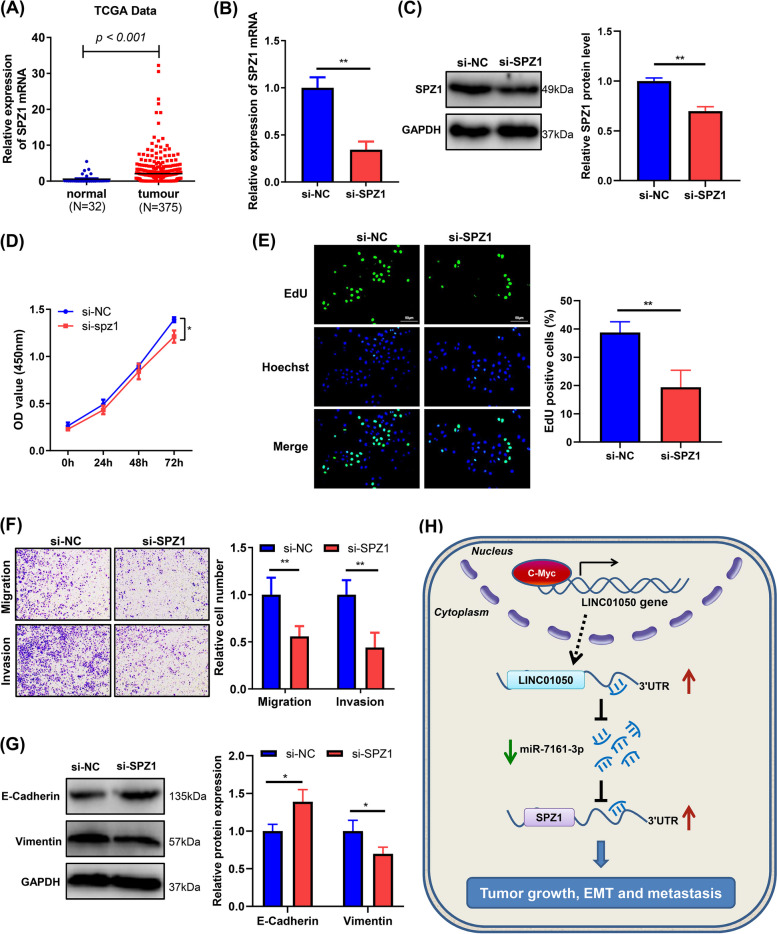
Results: LINC01050 was significantly up-regulated in gastric cancer, and its high expression was positively correlated with a poor prognosis. The transcription factor c-Myc was found to directly bind to the LINC01050 promoter region and activate its transcription. Furthermore, overexpression of LINC01050 was confirmed to promote gastric cancer cell proliferation, migration, invasion, and epithelial-mesenchymal transition in vitro and tumor growth in vivo. At the same time, its knockdown inhibited gastric cancer cell proliferation, migration, invasion, and epithelial-mesenchymal transition in vitro along with tumor growth and metastasis in vivo. Moreover, mechanistic investigations revealed that LINC01050 functions as a molecular sponge to absorb cytosolic miR-7161-3p, which reduces the miR-7161-3p-mediated translational repression of SPZ1, thus contributing to gastric cancer progression.

Conclusions: Taken together, our results identified a novel gastric cancer-associated lncRNA, LINC01050, which is activated by c-Myc. LINC01050 may be considered a potential therapeutic target for gastric cancer.

Keywords: C-Myc; Gastric cancer; LINC01050; Metastasis; SPZ1; miR-7161-3p.


Conflict of interest statement

The authors declare that they have no competing interests.

Figures

Fig. 1
Fig. 1
LINC01050 expression is up-regulated in gastric cancer tissues and is associated with a poor prognosis. a The top 15 dysregulated lncRNAs in gastric cancer from TCGA data. b Relative expression of LINC01050 in GC tissues compared with noncancerous tissues, based on TCGA data. P < 0.001. c Patients with high expression of LINC01050 showed reduced survival times compared to a low expression of LINC01050 (p = 0.014). d qRT-PCR analysis of LINC01050 expression in a normal gastric epithelium cell line (GES-1) and gastric cancer cell lines (AGS, KATO III, and BGC823). Data are presented as mean ± SD (n = 3). **P < 0.01. e qRT-PCR analysis of LINC01050 expression in the nuclear and cytoplasmic fractions from KATO III cells. GAPDH was used as the cytoplasmic control, and U6 as the nucleus control. The data are represented as the mean ± SD (n = 3). f RNA-FISH detection of LINC01050 (red) in GC cell lines (KATO III, BGC823, AGS, and HGC-27) and GES-1 cells. The nuclei were counterstained using DAPI (blue). FISH, fluorescence in situ hybridization. Scale bar = 10 μm
Fig. 2
Fig. 2
LINC01050 is a direct transcriptional target of c-Myc. a Luciferase activity of LINC01050 promoter constructs with a deletion encompassing the c-Myc binding sites in HEK293T cells transfected with pIRES2-vector or pIRES2-c-Myc. Overexpression of c-Myc in HEK293T cells was confirmed by Western blotting. Data are presented as mean ± SD (n = 3).*P < 0.05; **P < 0.01; ***P < 0.001. ns, not significant. b ChIP analysis of c-Myc enrichment at the LINC01050 promoter in KATO III cells. The data are represented as the mean ± SD. ***P < 0.001. c Western blot analysis of c-Myc protein expression in KATO III cells transfected with pIRES2-vector or pIRES2-c-Myc. Data are presented as mean ± SD (n = 3). **P < 0.01. d qRT-PCR analysis of LINC01050 expression in KATO III cells transfected with pIRES2-vector or pIRES2-c-Myc. Data are presented as mean ± SD (n = 3). **P < 0.01. e Overexpression of c-Myc promoted KATO III cell growth as revealed by CCK8 assays. Data are presented as mean ± SD (n = 3). *P < 0.05. f Overexpression of c-Myc in KATO III cells promoted plate colony formation. Data are presented as mean ± SD (n = 3). *P < 0.05. g Western blot analysis of c-Myc expression in KATO III cells transfected with si-NC or si-c-Myc. Data are presented as mean ± SD (n = 3). *P < 0.05. h qRT-PCR analysis of LINC01050 expression in KATO III cells transfected with si-NC or si-c-Myc. Data are presented as mean ± SD (n = 3). **P < 0.01. i Downregulation of c-Myc inhibited KATO III cell growth as revealed by the CCK8 assays. **P < 0.01. j Downregulation of c-Myc in KATO III cell inhibited plate colony formation. Data are presented as mean ± SD (n = 3). **P < 0.01
Fig. 3
Fig. 3
LINC01050 overexpression promotes cell proliferation, metastasis, and EMT in vitro and tumor growth in vivo. a qRT-PCR analysis of LINC01050 expression in KATO III cells transduced with pLVX-vector or pLVX-LINC01050. Data are presented as mean ± SD (n = 3). **P < 0.01. b-c Cell proliferation of KATO III cells transduced with pLVX-vector or pLVX-LINC01050 as determined by CCK8 (b) and EdU assays (c). Data are presented as mean ± SD (n = 3). *P < 0.05. Scale bar = 50 μm. d Colony-forming capabilities of KATO III cells transfected with pLVX-vector or pLVX-LINC01050, as determined by plate colony-formation assays. Data are presented as mean ± SD (n = 3). *P < 0.05. e Migration and invasion abilities of KATO III cells transduced with pLVX-vector or pLVX-LINC01050, as assessed by Transwell assays. Data are presented as mean ± SD (n = 3). **P < 0.01. f Western blot analysis of EMT-related proteins (E-cadherin and vimentin) in KATO III cells transduced with pLVX-vector or pLVX-LINC01050. GAPDH was used as an internal control. Data are presented as mean ± SD (n = 3). *P < 0.05. g Growth curves of tumors from KATO III cells transduced with pLVX-vector or pLVX-LINC01050 in tumor-bearing nude mice. Data are presented as mean ± SD (n = 5). *P < 0.05. h Tumor weights from KATO III cells transduced with pLVX-vector or pLVX-LINC01050 in tumor-bearing nude mice (right panel, n = 5). *P < 0.05. The data are presented as the mean ± SD. Three representative images of the tumors from the nude mice are shown (left panel, n = 5). i Immunohistochemistry to detect the proliferation markers Ki-67 and PTEN in tumor tissue sections. Scale bar = 50 μm
Fig. 4
Fig. 4
LINC01050 knockdown inhibits gastric cancer cell proliferation and induces apoptosis in vitro and inhibits tumor growth in vivo. a qRT-PCR analysis of LINC01050 expression in BGC823 and KATO III cells transfected with si-NC (negative control), si-LINC01050#1, or si-LINC01050#2. Data are presented as mean ± SD (n = 3). **P < 0.01. b-c Proliferation of BGC823 and KATO III cells transfected with si-NC (negative control), si-LINC01050#1, or si-LINC01050#2, as determined using CCK8 (b) and EdU assays (c). Data are presented as mean ± SD (n = 3). **P < 0.01. d Colony-formation capabilities of BGC823 and KATO III cells transfected with si-NC (negative control), si-LINC01050#1, or si-LINC01050#2, as determined using plate colony formation assays. Data are presented as mean ± SD (n = 3). **P < 0.01. e Cell apoptosis in BGC823 and KATO III cells transfected with si-NC (negative control), si-LINC01050#1, or si-LINC01050#2 for 48 h, analyzed using flow cytometry by Annexin V-FITC and Propidium iodide (PI) staining. Data are presented as mean ± SD (n = 3). *P < 0.05. f Western blot analysis of cleaved PARP 1, cleaved Caspase-3, Bcl-2, and Bax expression. GAPDH was used as an internal control. Data are presented as mean ± SD (n = 3). *P < 0.05, **P < 0.01. g Growth curves of tumors from KATO III cells transduced with lentiviral sh-LINC01050 in tumor-bearing nude mice. Data are presented as mean ± SD (n = 5). *P < 0.05. h Weights of tumors from nude mice. The values are presented as the means ± SD (lower panel, n = 5). Three representative images of the tumors from the nude mice are shown (upper panel). *P < 0.05. i qRT-PCR analysis of miR-7161-3p expressions in subcutaneous tumor tissues of KATO III cells transduced with lentiviral shNC (negative control) or shLINC01050. Data are presented as mean ± SD (n = 3). *P < 0.05. j Western blot analysis of SPZ1 expressions in subcutaneous tumor tissues of KATO III cells transduced with lentiviral shNC or shLINC01050. GAPDH was used as an internal control
Fig. 5
Fig. 5
LINC01050 knockdown inhibits gastric cancer cell migration and invasion in vitro and metastasis in vivo. a Migration and invasion abilities of BGC823 and KATO III cells transfected with si-NC (negative control), si-LINC01050#1, or si-LINC01050#2, as assessed by Transwell assays. The data are presented as the mean ± SD. **P < 0.01. Scale bar = 100 μm. b Western blot analysis of EMT-related protein expression (E-cadherin and vimentin) in BGC823 and KATO III cells transfected with si-NC (negative control), si-LINC01050#1, or si-LINC01050#2. GAPDH was used as an internal control. Data are presented as mean ± SD (n = 3). *P < 0.05, **P < 0.01. c Statistical quantification of lung metastatic nodules (n = 5) produced after BGC823 cells transduced with lentiviral shNC or shLINC01050 were injected into nude mice via the tail vein. The data are represented as the mean ± SD. *P < 0.05. d Representative photographs showing the macroscopic appearance of lung metastases. e Body weights of mice were recorded after a tail vein injection of the BGC823 cells transduced with lentiviral shNC or shLINC01050. Data are presented as mean ± SD (n = 5).*P < 0.05
Fig. 6
Fig. 6
LINC01050 directly binds to miR-7161-3p which targets SPZ1 by binding to its 3’UTR. a qRT-PCR analysis of miR-7161-3p expression in KATO III cells transduced with lentiviral control shRNA (sh-NC) or sh-LINC01050. *P < 0.05. b qRT-PCR analysis of miR-7161-3p expression in KATO III cells transduced with pLVX vector or pLVX-LINC01050. **P < 0.01. c Diagram of the luciferase reporter vectors containing the wild-type (WT) or mutant (MUT) LINC01050 sequences, with the highly conversed putative miR-7161-3p binding sites indicated. In the HEK293T cells, the miR-7161-3p mimic reduced the luciferase activity of the WT reporter relative to the negative control, but had little impact on the MUT reporter activity. **P < 0.01; ns, not significant. d-e Detection of LINC01050 and miR-7161-3p by qRT-PR in immunoprecipitated RNA after performing an anti-AGO2 RIP in KATO III cells. IgG was the negative control. ** P < 0.01. f Enrichment of AGO2 protein in pull-down assay performed using LINC01050 or a negative control (NC) incubated with cell extracts. g qRT-PCR analysis of SPZ1 mRNA expression in KATO III cells transfected with the NC or miR-7161-3p mimics. **P < 0.01. h Western blot analysis of SPZ1 protein expression in KATO III cells transfected with the NC or miR-7161-3p mimics. *P < 0.05. i Diagram of the luciferase reporter vectors containing the WT or MUT sequence of the SPZ1 3’UTR, with the highly conversed putative miR-7161-3p binding sites indicated. Luciferase activity of pmirGLO vectors containing the WT or MUT SPZ1 3’UTR sequence after co-transfection into HEK293T cells with the NC or miR-7161-3p mimics. **P < 0.01; ns, not significant
Fig. 7
Fig. 7
LINC01050 promotes gastric cancer cell proliferation, migration, invasion, and EMT by regulating the miR-7161-3p/SPZ1 axis. a qRT-PCR analysis of SPZ1 mRNA expression in KATO III cells transfected with the control shRNA (sh-NC) or sh-LINC01050. **P < 0.01. b Western blot analysis of SPZ1 protein level in KATO III cells stably expressing the sh-NC or sh-LINC01050. **P < 0.01. c qRT-PCR analysis of SPZ1 mRNA expression in KATO III stable cell line with the pLVX vector or overexpressing pLVX-LINC01050. **P < 0.01. d Western blot analysis of SPZ1 protein level in KATO III cells transduced with the pLVX vector or pLVX-LINC01050. **P < 0.01. e Western blot analysis of SPZ1 protein level in KATO III cells transfected with NC, miR-7161-3p mimics, pLVX-LINC01050 or pLVX-LINC01050 plus miR-7161-3p mimics. **P < 0.01, ***P < 0.001. f Growth curves of KATO III cells transfected with NC, miR-7161-3p mimics, pLVX-LINC01050 or pLVX-LINC01050 plus miR-7161-3p mimics, as revealed using CCK8 assays. *P < 0.05, **P < 0.01. g Migration and invasion capabilities of KATO III cells transfected with NC, miR-7161-3p mimics, pLVX-LINC01050 or pLVX-LINC01050 plus miR-7161-3p mimics, as revealed using Transwell assays. *P < 0.05, **P < 0.01. Scale bar = 100 μm. h Western blot analysis of EMT-related protein expression (E-cadherin and vimentin) in KATO III cells transfected with NC, miR-7161-3p mimics, pLVX-LINC01050 or pLVX-LINC01050 plus miR-7161-3p mimics. GAPDH protein was used as an internal control. *P < 0.05, **P < 0.01, ***P < 0.001. i Association of LINC01050 and SPZ1 expression levels. P < 0.0001
Fig. 8
Fig. 8
SPZ1 knockdown inhibits gastric cancer cell proliferation, migration, invasion, and EMT. a Relative expression of SPZ1 mRNA in gastric cancer tissues and normal tissues according to TCGA data (P < 0.001). b SPZ1 mRNA levels in KATO III cells transfected with si-NC or si-SPZ1, as determined by qRT-PCR. Data are presented as mean ± SD (n = 3). **P < 0.01. c SPZ1 protein expression in KATO III cells transfected with si-NC or si-SPZ1. Data are presented as mean ± SD (n = 3). **P < 0.01. d-e Proliferation of KATO III cells transfected with si-NC (negative control) or si-SPZ1, as determined using CCK8 (d) and EdU (e) assays. Data are presented as mean ± SD (n = 3). *P < 0.05, **P < 0.01. Scale bar = 50 μm. f Migration and invasion capabilities of KATO III cells transfected with si-NC or si-SPZ1, revealed using Transwell assays. The data are represented as the mean ± SD (n = 3). **P < 0.01. g Western blot analysis ofEMT-related protein expression (E-cadherin and vimentin) in KATO III cells transfected with si-NC or si-SPZ1. Data are presented as mean ± SD (n = 3). *P < 0.05. h A proposed model illustrating the regulatory role of c-Myc-activated lncRNA LINC01050 in promoting gastric cancer growth and metastasis by sponging miR-7161-3p to regulate SPZ1 expression

References

    1. Bray F, Ferlay J, Soerjomataram I, Siegel RL, Torre LA, Jemal A. Global cancer statistics 2018: GLOBOCAN estimates of incidence and mortality worldwide for 36 cancers in 185 countries. CA Cancer J Clin. 2018;68(6):394–424. doi: 10.3322/caac.21492. - DOI - PubMed
    1. Van Cutsem E, Sagaert X, Topal B, Haustermans K, Prenen H. Gastric cancer. Lancet (London, England) 2016;388(10060):2654–2664. doi: 10.1016/S0140-6736(16)30354-3. - DOI - PubMed
    1. Wang XN, Liang H. Some problems in the surgical treatment of gastric cancer. Chin J Cancer. 2010;29(4):369–373. doi: 10.5732/cjc.009.10629. - DOI - PubMed
    1. Saka M, Morita S, Fukagawa T, Katai H. Present and future status of gastric cancer surgery. Jpn J Clin Oncol. 2011;41(3):307–313. doi: 10.1093/jjco/hyq240. - DOI - PubMed
    1. Guttman M, Amit I, Garber M, French C, Lin MF, Feldser D, et al. Chromatin signature reveals over a thousand highly conserved large non-coding RNAs in mammals. Nature. 2009;458(7235):223–227. doi: 10.1038/nature07672. - DOI - PMC - PubMed

Substances