. 2021 Nov 8;13(1):177.
doi: 10.1186/s13073-021-00975-y.

Multiscale heterogeneity in gastric adenocarcinoma evolution is an obstacle to precision medicine

Affiliations

Multiscale heterogeneity in gastric adenocarcinoma evolution is an obstacle to precision medicine

Christoph Röcken et al. Genome Med. .

Abstract

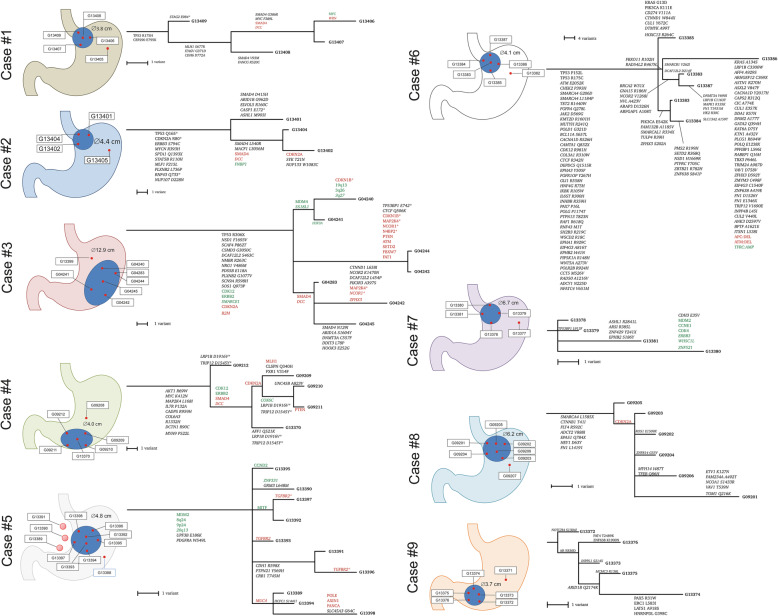
Background: Cancer is a somatic evolutionary disease and adenocarcinomas of the stomach and gastroesophageal junction (GC) may serve as a two-dimensional model of cancer expansion, in which tumor subclones are not evenly mixed during tumor progression but rather spatially separated and diversified. We hypothesize that precision medicine efforts are compromised when clinical decisions are based on a single-sample analysis, which ignores the mechanisms of cancer evolution and resulting intratumoral heterogeneity. Using multiregional whole-exome sequencing, we investigated the effect of somatic evolution on intratumoral heterogeneity aiming to shed light on the evolutionary biology of GC.

Methods: The study comprised a prospective discovery cohort of 9 and a validation cohort of 463 GCs. Multiregional whole-exome sequencing was performed using samples form 45 primary tumors and 3 lymph node metastases (range 3-10 tumor samples/patient) of the discovery cohort.

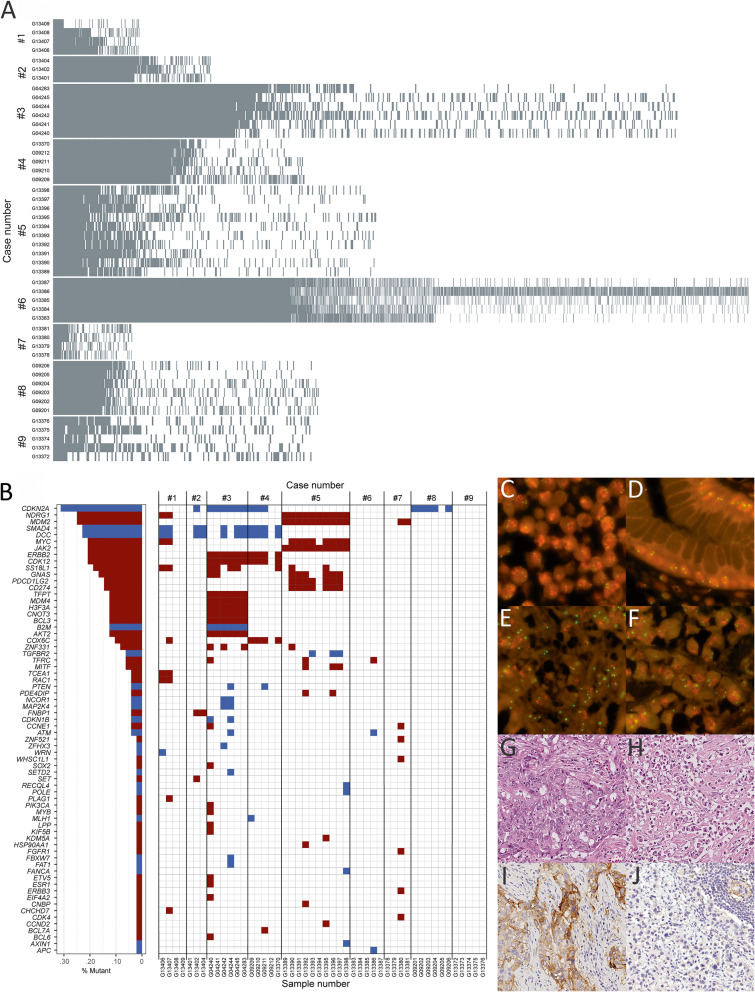
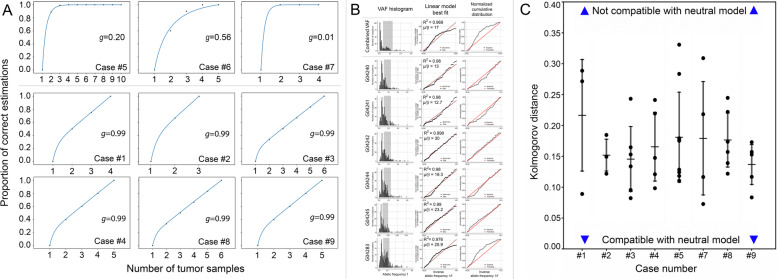
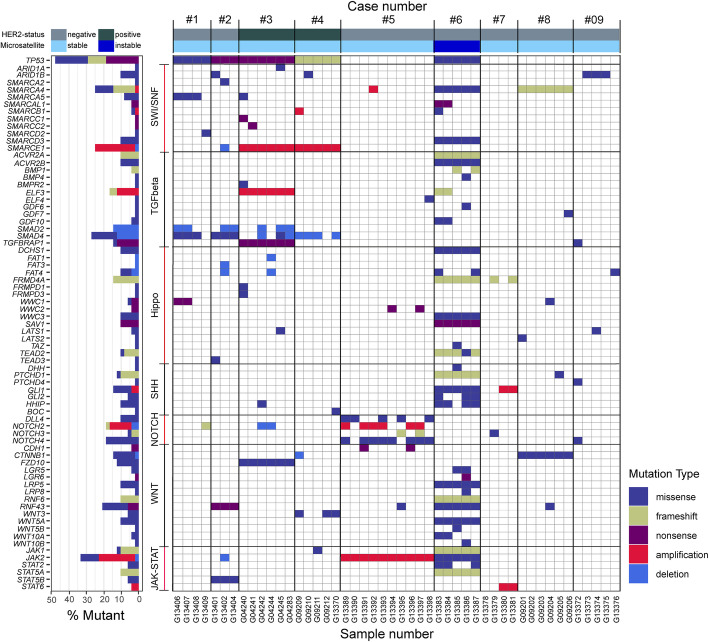
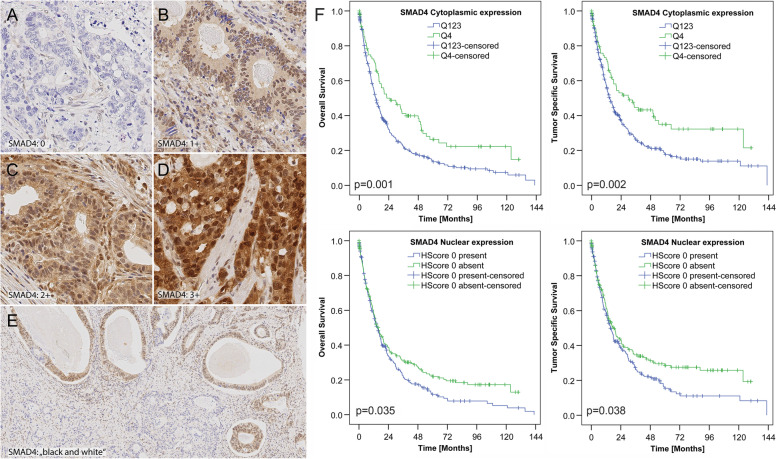
Results: In total, the discovery cohort harbored 16,537 non-synonymous mutations. Intratumoral heterogeneity of somatic mutations and copy number variants were present in all tumors of the discovery cohort. Of the non-synonymous mutations, 53-91% were not present in each patient's sample; 399 genes harbored 2-4 different non-synonymous mutations in the same patient; 175 genes showed copy number variations, the majority being heterogeneous, including CD274 (PD-L1). Multi-sample tree-based analyses provided evidence for branched evolution being most complex in a microsatellite instable GC. The analysis of the mode of evolution showed a high degree of heterogeneity in deviation from neutrality within each tumor. We found evidence of parallel evolution and evolutionary trajectories: different mutations of SMAD4 aligned with different subclones and were found only in TP53 mutant GCs.

Conclusions: Neutral and non-neutral somatic evolution shape the mutational landscape in GC along its lateral expansions. It leads to complex spatial intratumoral heterogeneity, where lymph node metastases may stem from different areas of the primary tumor, synchronously. Our findings may have profound effects on future patient management. They illustrate the risk of mis-interpreting tumor genetics based on single-sample analysis and open new avenues for an evolutionary classification of GC, i.e., the discovery of distinct evolutionary trajectories which can be utilized for precision medicine.

Keywords: Evolution; Gastric cancer; Intratumoral heterogeneity; SMAD4; TP53.


Conflict of interest statement

The authors declare that they have no competing interests.

Figures

Fig. 1
Fig. 1
Discovery cohort and multiregional trees. Schematic representation of the nine patients from the discovery cohort. Multiregional trees provide evidence of somatic evolution. Text in green and red indicate amplifications and deletions; italics represent predicted drivers, while others are known drivers as determined by Cancer Genome Interpreter. Variants denoted by an asterisk are those that are present in more than one branch of a tree and could not be satisfactorily resolved into a single branch
Fig. 2
Fig. 2
Intratumoral heterogeneity and Copy number variation. A Non-synonymous mutations were unevenly distributed among patients and patient samples. Each row represents a patient sample and each column represents one non-synonymous mutation. B Copy number variation analyses showed marked intratumoral heterogeneity (maroon denotes amplification and dark blue deletion). C–J Case #5 yields homogeneous amplifications in MDM2 (all ten samples) and a heterogeneous amplification of CD274 (PD-L1; 2/10 samples including a single lymph node metastasis). MDM2 amplification was confirmed independently in all samples, i.e., primary tumor (C, F; non-neoplastic mucosa as a reference in D) and all lymph node metastases (E). Amplification of CD274 was associated with strong PD-L1 immunostaining only in a single sample (I) and only in a single lymph node metastasis. All other samples were immunonegative for PD-L1 (J). The PD-L1-positive tumor area (G) showed a phenotype, different from the remainder (H). Primary tumor (C); corresponding non-neoplastic mucosa (D); lymph node metastasis corresponding to sample G13390 (E, G, I) and a sample of the primary tumor without CD274 amplification (PD-L1-immunonegative; F, H, J). Fluorescence in situ hybridization (orange signal: MDM2, green signal: reference centromere; CF); H&E staining (G; H) and anti-PD-L1-immunostaining (I, J). Original magnifications 1000-fold (CF), 400-fold (G–J)
Fig. 3
Fig. 3
Clonality and neutrality in the discovery cohort. A Clonality was assessed as described [36, 38]. Cases #1, #2, #3, #4, #8, and #9 are highly unbalanced and additional samples would be needed for correct estimation of clonality. In three cases (cases #5, #6, and #7), we could be fairly certain that mutations from the root of the phylogenetic tree were indeed clonal using the existing number of samples. B, C The neutral model assumes that there are no selective differences, such that the number of mutations of a certain allelic frequency declines as the inverse of that frequency [38]. Here, we show the agreement between each tumor sample and this neutral expectation. B Illustrates neutrality analysis of the samples from case #3. Left column: variant allele frequency histogram. Dark gray shade marks interval used for comparison with the neutral model. Central column: shows increment in the cumulative number of mutation with inverse allelic frequency 1/f (black dots) and linear model best fit (red line). Light gray marks samples that are in agreement with the neutral model R2 ≥ 0.98. Right column: normalized cumulative distribution of mutations and theoretical model. Distance between distributions was quantified using a Kolmogorov-Smirnov test. While the figure for the combined VAF shows deviations from neutrality, here mostly driven by sample G04283, some parts of the tumor could still evolve under neutral conditions. C Summarizes neutrality analyses for cases #1 to #5, #7 to #9. Case #6 (MSI) was not included in the neutrality analysis as a large, likely clonal, peak covered the most of the frequency range obfuscating the distribution of subclonal mutations. The agreement is quantified by the Kolmogorov-Smirnov test, where the Kolmogorov distance between the empirical and the theoretical distribution is shown for each sample. The normalized cumulative number of putatively subclonal mutations in a frequency area below the clonal peak was used where a power-law distributed subclonal tail of mutations would be expected in the model of neutral evolution. The lines represent the standard deviation of the Kolmogorov distance across samples per patient
Fig. 4
Fig. 4
Pathway analysis. Assignment of mutations to pathways, i.e., the SWI/SNF, TGFβ, Hippo, sonic hedgehog, NOTCH, WNT, and JAK-STAT pathway, also showed marked intratumoral heterogeneity and provided evidence of parallel evolution
Fig. 5
Fig. 5
SMAD4 is heterogeneously expressed in gastric cancer and a decreased expression correlates with patient survival (validation cohort). References for immunostaining analysis according to H-score. Staining intensities ranged from 0 (A; nuclear and cytoplasmic negative) to 3+ (D, nuclear and cytoplasmic strong expression) with 1+ (B; nuclear and cytoplasmic weak expression) and 2+ (C; nuclear and cytoplasmic moderate expression) in between. Black-and-white expression of SMAD4 describes tumors with clearly demarcated areas of complete loss of nuclear and cytoplasmic SMAD4 expression next to areas with retained expression (E). Anti-SMAD4 immunostaining, hematoxylin counterstain; × 400 (A–D) and × 100 (E) magnifications. F Kaplan-Meier curves depicting patients’ survival according to SMAD4 status (Q1–3 vs. Q4; for further details see Suppl. Results). Kaplan-Meier curves demonstrating correlations between cytoplasmic SMAD4 (top row) and nuclear (bottom row) loss in tumor cells and overall as well as tumor-specific survival

References

    1. Ajani JA, Lee J, Sano T, Janjigian YY, Fan D, Song S. Gastric adenocarcinoma. Nat Rev Dis Primers. 2017;3(1):17036. doi: 10.1038/nrdp.2017.36. - DOI - PubMed
    1. Lee J, Kim ST, Kim K, Lee H, Kozarewa I, Mortimer PGS, Odegaard JI, Harrington EA, Lee J, Lee T, Oh SY, Kang JH, Kim JH, Kim Y, Ji JH, Kim YS, Lee KE, Kim J, Sohn TS, An JY, Choi MG, Lee JH, Bae JM, Kim S, Kim JJ, Min YW, Min BH, Kim NKD, Luke S, Kim YH, Hong JY, Park SH, Park JO, Park YS, Lim HY, Talasaz A, Hollingsworth SJ, Kim KM, Kang WK. Tumor genomic profiling guides patients with metastatic gastric cancer to targeted treatment: the VIKTORY Umbrella Trial. Cancer Discov. 2019;9(10):1388–1405. doi: 10.1158/2159-8290.CD-19-0442. - DOI - PubMed
    1. Cancer Genome Atlas Research N Comprehensive molecular characterization of gastric adenocarcinoma. Nature. 2014;513(7517):202–209. doi: 10.1038/nature13480. - DOI - PMC - PubMed
    1. Böger C, Krüger S, Behrens HM, Bock S, Haag J, Kalthoff H, Röcken C. Epstein-Barr virus-associated gastric cancer reveals intratumoral heterogeneity of PIK3CA mutations. Ann Oncol. 2017;28(5):1005–1014. doi: 10.1093/annonc/mdx047. - DOI - PMC - PubMed
    1. Lee HH, Kim SY, Jung ES, Yoo J, Kim TM. Mutation heterogeneity between primary gastric cancers and their matched lymph node metastases. Gastric Cancer. 2019;22(2):323–334. doi: 10.1007/s10120-018-0870-6. - DOI - PubMed

Publication types

MeSH terms