

Skeletal Muscle Phenotype in Patients Undergoing Long-Term Hemodialysis Awaiting Kidney Transplantation
- PMID: 34750160
- PMCID: PMC8729424
- DOI: 10.2215/CJN.02390221
Skeletal Muscle Phenotype in Patients Undergoing Long-Term Hemodialysis Awaiting Kidney Transplantation
Abstract
Background and objectives: Age and comorbidity-related sarcopenia represent a main cause of muscle dysfunction in patients on long-term hemodialysis. However, recent findings suggest muscle abnormalities that are not associated with sarcopenia. The aim of this study was to isolate functional and cellular muscle abnormalities independently of other major confounding factors, including malnutrition, age, comorbidity, or sedentary lifestyle, which are common in patients on maintenance hemodialysis. To overcome these confounding factors, alterations in skeletal muscle were analyzed in highly selected patients on long-term hemodialysis undergoing kidney transplantation.
Design, setting, participants, & measurements: In total, 22 patients on long-term hemodialysis scheduled for kidney transplantation with few comorbidities, but with a long-term uremic milieu exposure, and 22 age, sex, and physical activity level frequency-matched control participants were recruited. We compared biochemical, functional, and molecular characteristics of the skeletal muscle using maximal voluntary force and endurance of the quadriceps, 6-minute walking test, and muscle biopsy of vastus lateralis. For statistical analysis, mean comparison and multiple regression tests were used.
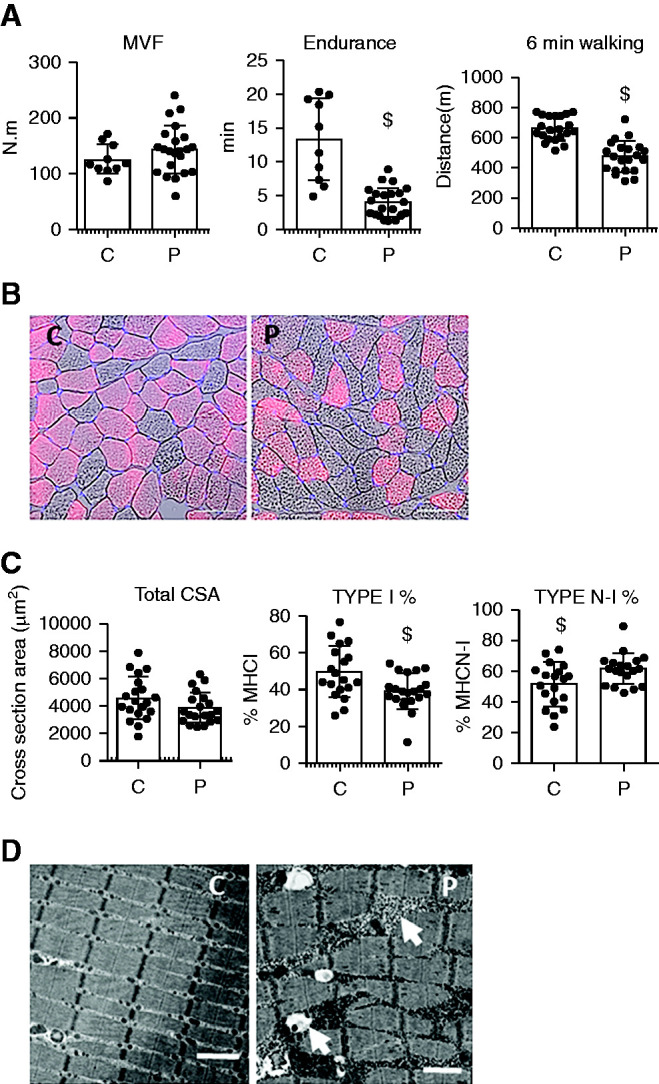
Results: In patients on long-term hemodialysis, muscle endurance was lower, whereas maximal voluntary force was not significantly different. We observed a transition from type I (oxidative) to type II (glycolytic) muscle fibers, and an alteration of mitochondrial structure (swelling) without changes in DNA content, genome replication (peroxisome proliferator activator receptor γ coactivator-1α and mitochondrial transcription factor A), regulation of fusion (mitofusin and optic atrophy 1), or fission (dynamin-related protein 1). Notably, there were autophagosome structures containing glycogen along with mitochondrial debris, with a higher expression of light chain 3 (LC3) protein, indicating phagophore formation. This was associated with a greater conversion of LC3-I to LC3-II and the expression of Gabaralp1 and Bnip3l genes involved in mitophagy.
Conclusions: In this highly selected long-term hemodialysis population, a low oxidative phenotype could be defined by a poor endurance, a fiber-type switch, and an alteration of mitochondria structure, without evidence of sarcopenia. This phenotype could be related to uremia through the activation of autophagy/mitophagy.
Clinical trial registration numbers: NCT02794142 and NCT02040363.
Keywords: cell signaling; chronic hemodialysis; chronic kidney disease; mitochondria; phenotype; signal transduction; transplantation.
Copyright © 2021 by the American Society of Nephrology.
Figures


Comment in
-
Muscle Abnormalities with Kidney Failure.Clin J Am Soc Nephrol. 2021 Nov;16(11):1613-1614. doi: 10.2215/CJN.12550921. Clin J Am Soc Nephrol. 2021. PMID: 34750157 Free PMC article. No abstract available.
References
-
- Pereira RA, Cordeiro AC, Avesani CM, Carrero JJ, Lindholm B, Amparo FC, Amodeo C, Cuppari L, Kamimura MA: Sarcopenia in chronic kidney disease on conservative therapy: Prevalence and association with mortality. Nephrol Dial Transplant 30: 1718–1725, 2015 - PubMed
-
- Carrero JJ, Johansen KL, Lindholm B, Stenvinkel P, Cuppari L, Avesani CM: Screening for muscle wasting and dysfunction in patients with chronic kidney disease. Kidney Int 90: 53–66, 2016 - PubMed
-
- Panaye M, Kolko-Labadens A, Lasseur C, Paillasseur J-L, Guillodo MP, Levannier M, Teta D, Fouque D: Phenotypes influencing low physical activity in maintenance dialysis. J Ren Nutr 25: 31–39, 2015 - PubMed
-
- Aniort J, Stella A, Philipponnet C, Poyet A, Polge C, Claustre A, Combaret L, Béchet D, Attaix D, Boisgard S, Filaire M, Rosset E, Burlet-Schiltz O, Heng AE, Taillandier D: Muscle wasting in patients with end-stage renal disease or early-stage lung cancer: Common mechanisms at work. J Cachexia Sarcopenia Muscle 10: 323–337, 2019 - PMC - PubMed
-
- Johansen KL, Shubert T, Doyle J, Soher B, Sakkas GK, Kent-Braun JA: Muscle atrophy in patients receiving hemodialysis: Effects on muscle strength, muscle quality, and physical function. Kidney Int 63: 291–297, 2003 - PubMed
Publication types
MeSH terms
Substances
Associated data
LinkOut - more resources
Full Text Sources
Medical
Research Materials
