. 2021 Nov 16;118(46):e2109380118.
doi: 10.1073/pnas.2109380118.

Modular origins of high-amplitude cofluctuations in fine-scale functional connectivity dynamics

Affiliations

Modular origins of high-amplitude cofluctuations in fine-scale functional connectivity dynamics

Maria Pope et al. Proc Natl Acad Sci U S A. .

Abstract

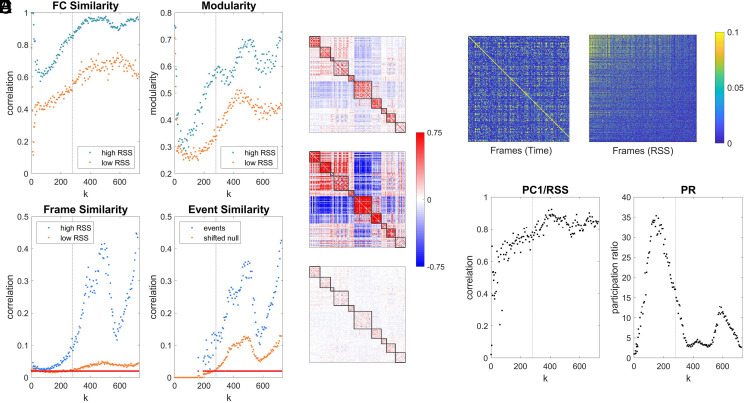
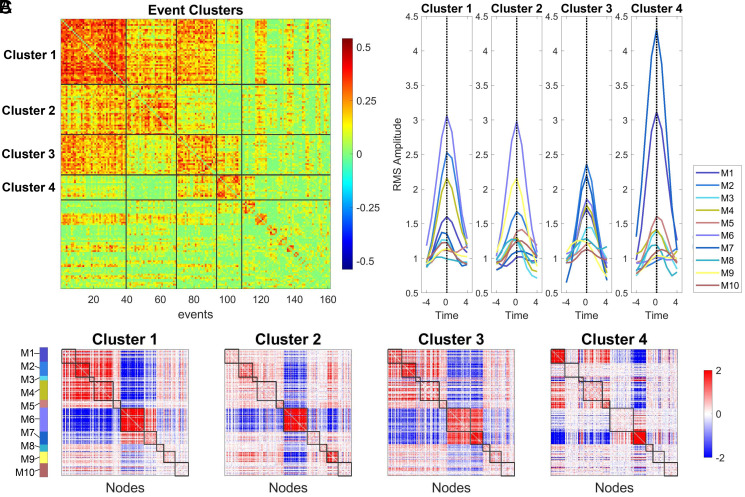
The topology of structural brain networks shapes brain dynamics, including the correlation structure of brain activity (functional connectivity) as estimated from functional neuroimaging data. Empirical studies have shown that functional connectivity fluctuates over time, exhibiting patterns that vary in the spatial arrangement of correlations among segregated functional systems. Recently, an exact decomposition of functional connectivity into frame-wise contributions has revealed fine-scale dynamics that are punctuated by brief and intermittent episodes (events) of high-amplitude cofluctuations involving large sets of brain regions. Their origin is currently unclear. Here, we demonstrate that similar episodes readily appear in silico using computational simulations of whole-brain dynamics. As in empirical data, simulated events contribute disproportionately to long-time functional connectivity, involve recurrence of patterned cofluctuations, and can be clustered into distinct families. Importantly, comparison of event-related patterns of cofluctuations to underlying patterns of structural connectivity reveals that modular organization present in the coupling matrix shapes patterns of event-related cofluctuations. Our work suggests that brief, intermittent events in functional dynamics are partly shaped by modular organization of structural connectivity.

Keywords: brain dynamics; computational neuroscience; connectomics; fMRI; resting state.


Conflict of interest statement

The authors declare no competing interest.

Figures

Fig. 1.
Fig. 1.
KS model schematic, computational workflow, and event detection. (A) SC weight and length matrix. (B) Node pair (i,j) linked by an edge ij  and its corresponding phases θ(t). (C) Oscillator time series sin(θ(t)). (D) HRF used for convolving oscillator time series to yield BOLD time series (E). (F) Elementwise product of normalized BOLD time series yields edge time series. (G) RSS of all edge time series yields RSS amplitude time series. The null model consists of a distribution of null RSS amplitudes computed from randomly shifted node time series. Gray dots show amplitudes from 100 null models, stippled line indicates the P<0.001 cutoff derived from 1,000 permutation nulls. Peaks exceeding the cutoff indicated by inverted triangles correspond to events. Data shown here computed from a representative run (k=280, 12 events detected).
Fig. 2.
Fig. 2.
SC and FC. (A) Empirical data. (Left) SC consensus weight matrix; (Middle) SC connection lengths (conduction delays); (Right) FC, average of 95 subjects, four runs each; all panels shown in FC module node order (FC modules marked at Left, cf. SI Appendix, Fig. 1A). (B) SC consensus and simulated FC. (Left) Coclassification (agreement) matrix derived from the consensus SC matrix; (Right) simulated FC, average of 12 runs, k=280; both panels shown in SC consensus module node order (SC consensus modules marked at Left, cf. SI Appendix, Fig. 1B). (Right) Scatter plot showing comparison of empirical and simulated FC (orange: all node pairs; blue: intrahemispheric node pairs only). (C) (Left) Similarity (Pearson correlation) between empirical and simulated FC across all values of k; (Middle) Spearman’s rho between empirical SC weights (Kij) and simulated FC; (Right) similarity (Pearson correlation) between empirical SC coclassification matrix and simulated FC. All panels in C show data for the full range of the coupling parameter k, with orange dots indicating full-brain coverage (both cerebral hemispheres and their interconnections) and blue dots indicating intrahemispheric connections only. Large dots indicate data for k=280 (stippled vertical lines) averaged over 12 runs.
Fig. 3.
Fig. 3.
Events in simulated edge time series. (A) Number of events (Left) and event amplitudes (RSS; Right) over the full range of k. Application of the null model for event detection suppresses low RSS-amplitude peaks. (B) Example of simulated edge time series (k=280) and RSS amplitudes, with event peaks surviving null model comparison indicated by inverted triangles.
Fig. 4.
Fig. 4.
Properties of simulated edge time series. (A) Comparison of FC components derived from the top 10% (“high RSS,” blue dots) or bottom 10% (“low RSS,” orange dots) RSS frames. (Left) Similarity (Pearson correlation) with full FC; (Right) modularity. Both panels show data across the full range of k. (B) Example FC matrix (all frames, Top; cf. Fig. 2) and FC components (high-RSS frames, Middle; low-RSS frames, Bottom). Data averaged over 12 simulation runs of KS model at k=280. (C) Similarity of frame sets sampled during high-/low-RSS epochs and during events. (Left) Mean similarity (Pearson correlation) of frames within high-/low-RSS sets (110 frames each). Red dots indicate values of k for which significant differences between distributions were detected (Wilcoxon rank-sum test, one-sided, P<0.0001, uncorrected). (Right) Mean similarity (Pearson correlation) of event frames compared to mean of 250 randomly offset frame sets. Red dots indicate values of k with P<0.01 (uncorrected). (D) Example plot of similarity of edge time series (Pearson correlation) across all frames within one simulation run (KS model, k=280; Left: frames in original time sequence; Right: frames sorted by RSS amplitude). (E) (Left) Correlation of the largest PC (PC1) of the edge time series with the RSS amplitude across all values of k. (Right) Participation ratio (dimensionality) computed from the FC covariance matrix. Stippled vertical line marks k=280 in panels A, C, and E.
Fig. 5.
Fig. 5.
Event clusters and relation to SC consensus modules. (A) Clustered correlation matrix of event patterns (k = 280, 161 events). Matrix is reordered to show event clusters from largest to smallest. The top four clusters are delineated and contain 37, 30, 26, and 15 events, respectively. (B) Means of the events clusters (cluster centroids) displayed in matrix form, with nodes arranged in SC consensus order (cf. Fig. 2). (C) Mean time courses of RMS, computed for each SC consensus module, with time courses aligned to the event peak for each of the four main event clusters (means of 37, 30, 26, and 15 events, respectively). Time courses show mean cofluctuation amplitude for each SC consensus module.

References

    1. Bullmore E., Sporns O., Complex brain networks: Graph theoretical analysis of structural and functional systems. Nat. Rev. Neurosci. 10, 186–198 (2009). - PubMed
    1. Bassett D. S., Sporns O., Network neuroscience. Nat. Neurosci. 20, 353–364 (2017). - PMC - PubMed
    1. Fornito A., Zalesky A., Bullmore E., Fundamentals of Brain Network Analysis (Academic Press, ed. 1, 2016).
    1. Sporns O., Betzel R. F., Modular brain networks. Annu. Rev. Psychol. 67, 613–640 (2016). - PMC - PubMed
    1. Betzel R. F., Bassett D. S., Multi-scale brain networks. Neuroimage 160, 73–83 (2017). - PMC - PubMed

Publication types