

The shifting age distribution of people with HIV using antiretroviral therapy in the United States
- PMID: 34750289
- PMCID: PMC8795488
- DOI: 10.1097/QAD.0000000000003128
The shifting age distribution of people with HIV using antiretroviral therapy in the United States
Abstract
Objective: To project the future age distribution of people with HIV using antiretroviral therapy (ART) in the United States, under expected trends in HIV diagnosis and survival (baseline scenario) and achieving the ending the HIV epidemic (EHE) goals of a 75% reduction in HIV diagnoses from 2020 to 2025 and sustaining levels to 2030 (EHE75% scenario).
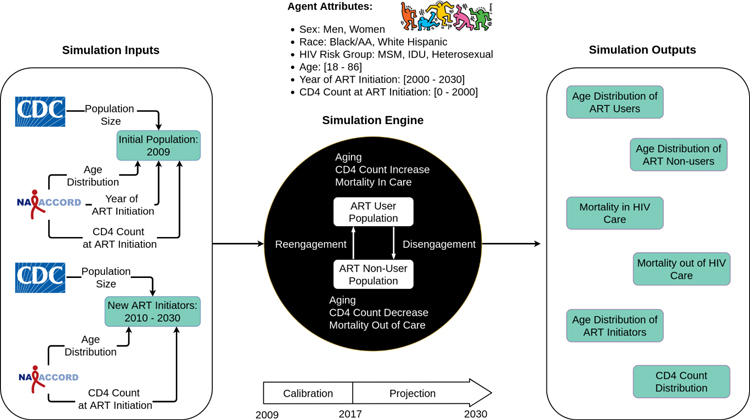
Design: An agent-based simulation model with mathematical functions estimated from North American AIDS Cohort Collaboration on Research and Design data and parameters from the US Centers for Disease Control and Prevention's annual HIV surveillance reports.
Methods: The PEARL (ProjEcting Age, MultimoRbidity, and PoLypharmacy in adults with HIV) model simulated individuals in 15 subgroups of sex-and-HIV acquisition risk and race/ethnicity. Simulation outcomes from the baseline scenario are compared with outcomes from the EHE75% scenario.
Results: Under the baseline scenario, PEARL projects a substantial increase in number of ART-users over time, reaching a population of 909 638 [95% uncertainty range (UR): 878 449-946 513] by 2030. The overall median age increased from 50 years in 2020 to 52 years in 2030, with 23% of ART-users age ≥65 years in 2030. Under the EHE75% scenario, the projected number of ART-users was 718 348 [703 044-737 817] (median age = 56 years) in 2030, with a 70% relative reduction in ART-users <30 years and a 4% relative reduction in ART-users age ≥65 years compared to baseline, and persistent heterogeneities in projected numbers by sex-and-HIV acquisition risk group and race/ethnicity.
Conclusions: It is critical to prepare healthcare systems to meet the impending demand of the US population aging with HIV.
Copyright © 2021 Wolters Kluwer Health, Inc. All rights reserved.
Figures


References
-
- Panel on Antiretroviral Guidelines for Adults and Adolescents. Guidelines for the Use of Antiretroviral Agents in HIV-1-Infected Adults and Adolescents.; 2012. https://aidsinfo.nih.gov/contentfiles/adultandadolescentgl003093.pdf.
-
- US Centers for Disease Control and Prevention. HIV Surveillance Report, 2019. http://www.cdc.gov/hiv/library/reports/hiv-surveillance.html. Published 2019. Accessed August 4, 2021.
-
- Althoff KN, Chandran A, Zhang J, et al. Life-expectancy disparities among adults with HIV in the United States and Canada: The impact of a reduction in drug- and alcohol-related deaths using the lives saved simulation model. Am J Epidemiol. 2019;188(12):2097–2109. doi:10.1093/aje/kwz232 - DOI - PMC - PubMed
Publication types
MeSH terms
Grants and funding
- R01 DA011602/DA/NIDA NIH HHS/United States
- K23 EY013707/EY/NEI NIH HHS/United States
- U54 GM133807/GM/NIGMS NIH HHS/United States
- U01 AI038855/AI/NIAID NIH HHS/United States
- U01 HL146208/HL/NHLBI NIH HHS/United States
- UL1 RR024131/RR/NCRR NIH HHS/United States
- U01 HL146192/HL/NHLBI NIH HHS/United States
- U01 AI069432/AI/NIAID NIH HHS/United States
- HCP-97105/CIHR/Canada
- U01 HL146201/HL/NHLBI NIH HHS/United States
- U01 AA020790/AA/NIAAA NIH HHS/United States
- KL2 TR000421/TR/NCATS NIH HHS/United States
- K01 AI131895/AI/NIAID NIH HHS/United States
- U01 HL146241/HL/NHLBI NIH HHS/United States
- R01 AA016893/AA/NIAAA NIH HHS/United States
- N01 CP001004/CP/NCI NIH HHS/United States
- P30 AI027767/AI/NIAID NIH HHS/United States
- P30 AI050409/AI/NIAID NIH HHS/United States
- U01 HL146333/HL/NHLBI NIH HHS/United States
- F31 AI124794/AI/NIAID NIH HHS/United States
- P30 MH062246/MH/NIMH NIH HHS/United States
- U01 AI069434/AI/NIAID NIH HHS/United States
- TGF-96118/CIHR/Canada
- Z01 CP010176/ImNIH/Intramural NIH HHS/United States
- P30 AI094189/AI/NIAID NIH HHS/United States
- U01 HL146245/HL/NHLBI NIH HHS/United States
- UL1 TR001863/TR/NCATS NIH HHS/United States
- G12 MD007583/MD/NIMHD NIH HHS/United States
- K24 DA000432/DA/NIDA NIH HHS/United States
- U01 DA036935/DA/NIDA NIH HHS/United States
- CBR-94036/CIHR/Canada
- U01 HL146205/HL/NHLBI NIH HHS/United States
- R24 AI067039/AI/NIAID NIH HHS/United States
- U01 HL146242/HL/NHLBI NIH HHS/United States
- U01 AI038858/AI/NIAID NIH HHS/United States
- U10 EY008057/EY/NEI NIH HHS/United States
- U01 AI068636/AI/NIAID NIH HHS/United States
- U01 HL146193/HL/NHLBI NIH HHS/United States
- U10 EY008052/EY/NEI NIH HHS/United States
- P30 AI110527/AI/NIAID NIH HHS/United States
- R34 DA045592/DA/NIDA NIH HHS/United States
- P30 AI027763/AI/NIAID NIH HHS/United States
- K01 AI093197/AI/NIAID NIH HHS/United States
- U01 AI069918/AI/NIAID NIH HHS/United States
- K24 AI118591/AI/NIAID NIH HHS/United States
- UL1 TR002378/TR/NCATS NIH HHS/United States
- CBR-86906/CIHR/Canada
- K24 AI065298/AI/NIAID NIH HHS/United States
- U01 AA013566/AA/NIAAA NIH HHS/United States
- N02 CP055504/CP/NCI NIH HHS/United States
- UL1 TR000083/TR/NCATS NIH HHS/United States
- P30 AI027757/AI/NIAID NIH HHS/United States
- U01 HL146204/HL/NHLBI NIH HHS/United States
- R01 DA012568/DA/NIDA NIH HHS/United States
- U01 HL146202/HL/NHLBI NIH HHS/United States
- UL1 TR000004/TR/NCATS NIH HHS/United States
- U01 HL146240/HL/NHLBI NIH HHS/United States
- F31 DA037788/DA/NIDA NIH HHS/United States
- R56 AG081148/AG/NIA NIH HHS/United States
- R01 AG053100/AG/NIA NIH HHS/United States
- U10 EY008067/EY/NEI NIH HHS/United States
- P30 AI036219/AI/NIAID NIH HHS/United States
- U01 HL146194/HL/NHLBI NIH HHS/United States
- U24 AA020794/AA/NIAAA NIH HHS/United States
- U01 HL146203/HL/NHLBI NIH HHS/United States
- U01 AI068634/AI/NIAID NIH HHS/United States
- P30 AI050410/AI/NIAID NIH HHS/United States
- K01 AI138853/AI/NIAID NIH HHS/United States
LinkOut - more resources
Full Text Sources
Medical
