

Quantification of the effects of climatic conditions on French hospital admissions and deaths induced by SARS-CoV-2
- PMID: 34750498
- PMCID: PMC8575948
- DOI: 10.1038/s41598-021-01392-2
Quantification of the effects of climatic conditions on French hospital admissions and deaths induced by SARS-CoV-2
Abstract
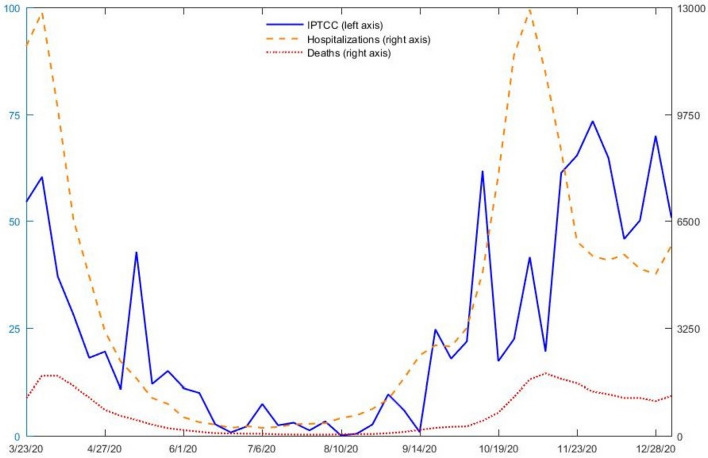
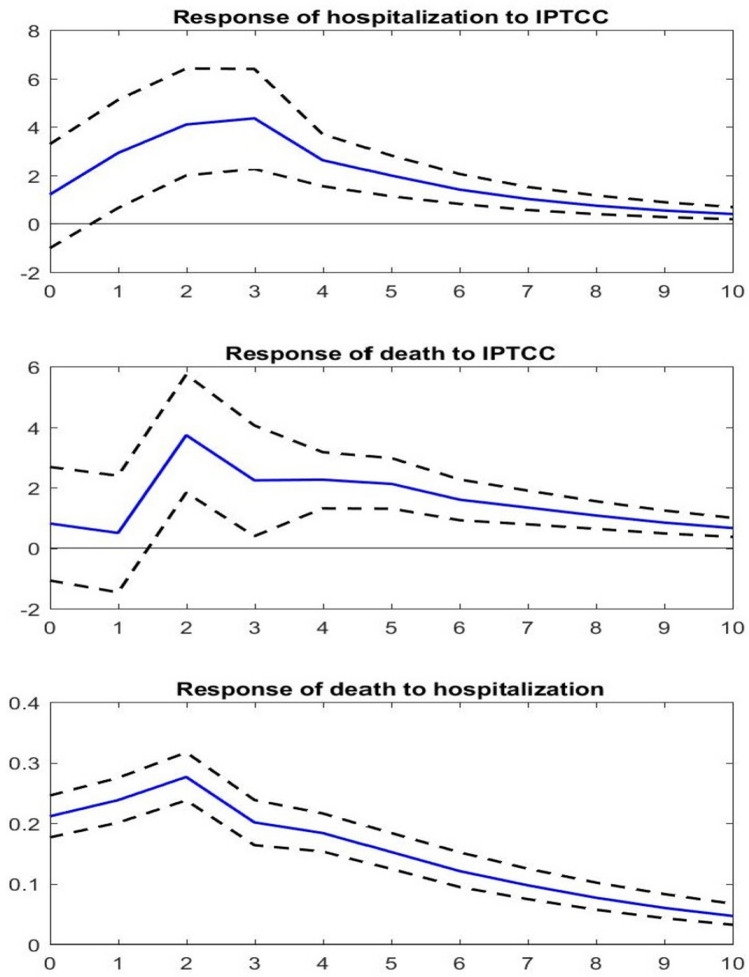
An estimation of the impact of climatic conditions-measured with an index that combines temperature and humidity, the IPTCC-on the hospitalizations and deaths attributed to SARS-CoV-2 is proposed. The present paper uses weekly data from 54 French administrative regions between March 23, 2020 and January 10, 2021. Firstly, a Granger causal analysis is developed and reveals that past values of the IPTCC contain information that allow for a better prediction of hospitalizations or deaths than that obtained without the IPTCC. Finally, a vector autoregressive model is estimated to evaluate the dynamic response of hospitalizations and deaths after an increase in the IPTCC. It is estimated that a 10-point increase in the IPTCC causes hospitalizations to rise by 2.9% (90% CI 0.7-5.0) one week after the increase, and by 4.1% (90% CI 2.1-6.4) and 4.4% (90% CI 2.5-6.3) in the two following weeks. Over ten weeks, the cumulative effect is estimated to reach 20.1%. Two weeks after the increase in the IPTCC, deaths are estimated to rise by 3.7% (90% CI 1.6-5.8). The cumulative effect from the second to the tenth weeks reaches 15.8%. The results are robust to the inclusion of air pollution indicators.
© 2021. The Author(s).
Conflict of interest statement
The authors declare no competing interests.
Figures
References
-
- WHO, WHO Director-General/Speeches, 2020. [Online]. Available (accessed 02 March 2021): https://www.who.int/director-general/speeches/detail/who-director-genera....
-
- Kraemer MUG, Yang C-H, Gutierrez B, Wu C-H, Klein B, Pigott DM, Group OCLDW, Plessis LD, Faria NR, Li R, Hanage WP, Brownstein JS, Layan M, Vespignani A, Tian H, Dye C, Pybus OG, Scarpin SV. The effect of human mobility and control measures on the COVID-19 epidemic in China. Science. 2020;368:493–497. doi: 10.1126/science.abb4218. - DOI - PMC - PubMed
-
- Delnevo G, Mirri S, Roccetti M. Particulate matter and COVID-19 disease diffusion in Emilia-Romagna (Italy): Already a cold case? Computation. 2020;59:2.
-
- Briz-Redon A, Serrano-Aroca A. The effect of climate on the spread of the COVID-19 213 pandemic: A review of findings, and statistical and modelling techniques. Prog. 214 Phys. Geogr. Earth Environ. 2020;44:591–604. doi: 10.1177/0309133320946302. - DOI
MeSH terms
Substances
LinkOut - more resources
Full Text Sources
Medical
Miscellaneous
