Multicenter Study
. 2021 Nov;3(11):1476-1483.
doi: 10.1038/s42255-021-00478-5. Epub 2021 Nov 8.

Integrative analysis of the plasma proteome and polygenic risk of cardiometabolic diseases

Affiliations
Multicenter Study

Integrative analysis of the plasma proteome and polygenic risk of cardiometabolic diseases

Scott C Ritchie et al. Nat Metab. 2021 Nov.

Abstract

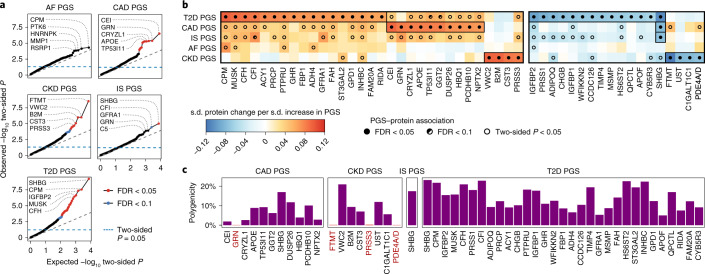
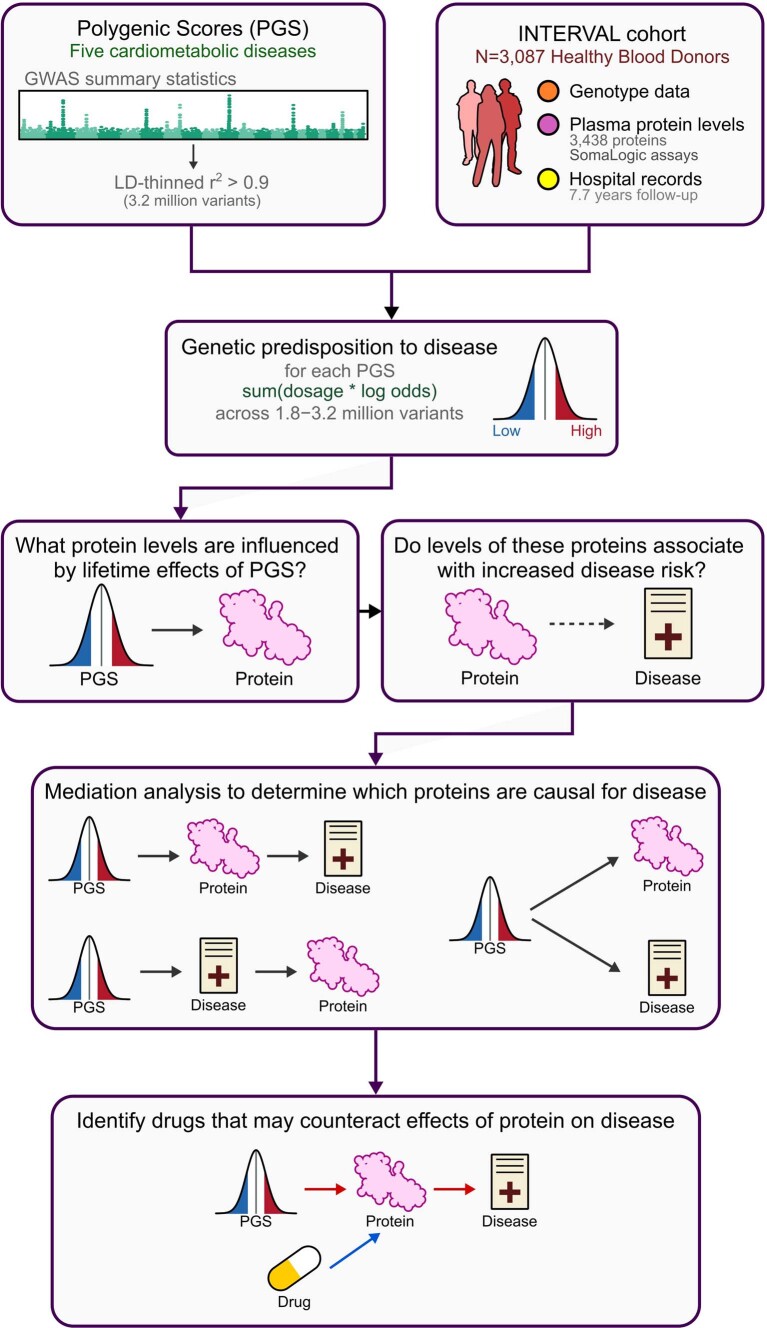
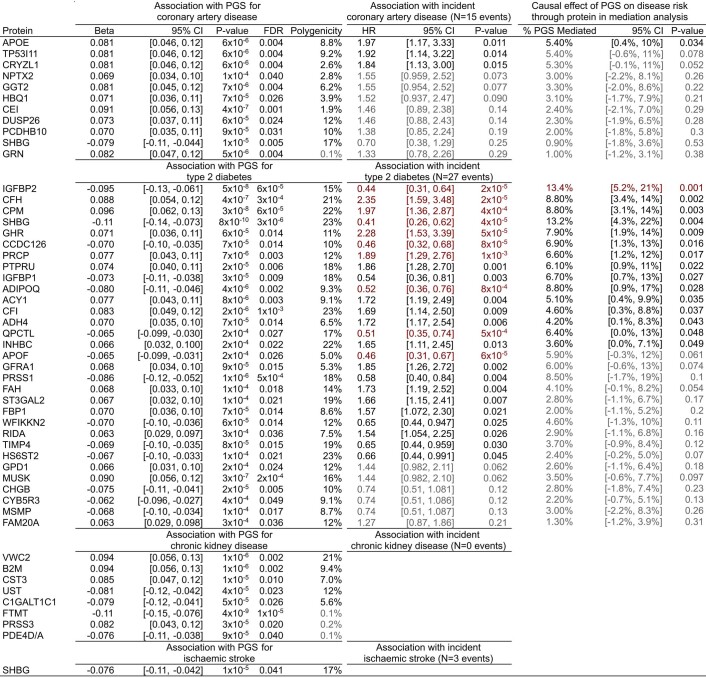
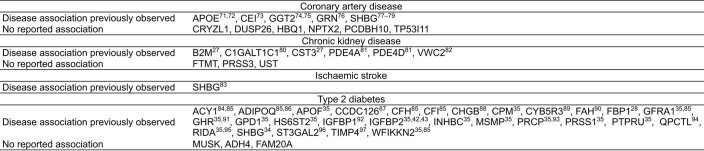
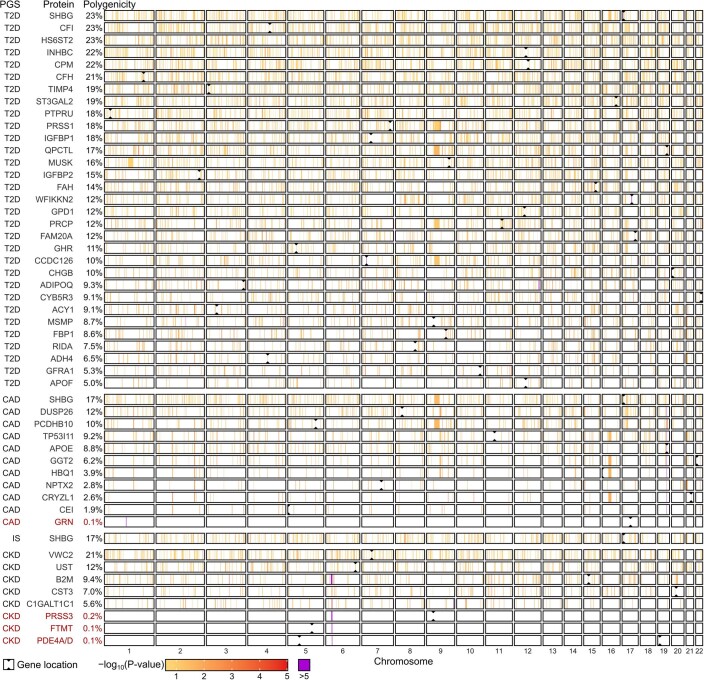
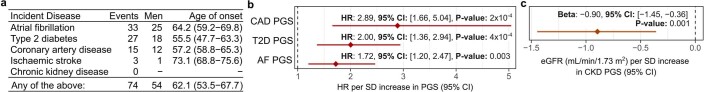
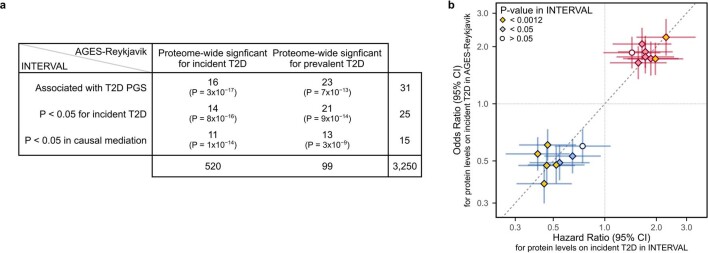
Cardiometabolic diseases are frequently polygenic in architecture, comprising a large number of risk alleles with small effects spread across the genome1-3. Polygenic scores (PGS) aggregate these into a metric representing an individual's genetic predisposition to disease. PGS have shown promise for early risk prediction4-7 and there is an open question as to whether PGS can also be used to understand disease biology8. Here, we demonstrate that cardiometabolic disease PGS can be used to elucidate the proteins underlying disease pathogenesis. In 3,087 healthy individuals, we found that PGS for coronary artery disease, type 2 diabetes, chronic kidney disease and ischaemic stroke are associated with the levels of 49 plasma proteins. Associations were polygenic in architecture, largely independent of cis and trans protein quantitative trait loci and present for proteins without quantitative trait loci. Over a follow-up of 7.7 years, 28 of these proteins associated with future myocardial infarction or type 2 diabetes events, 16 of which were mediators between polygenic risk and incident disease. Twelve of these were druggable targets with therapeutic potential. Our results demonstrate the potential for PGS to uncover causal disease biology and targets with therapeutic potential, including those that may be missed by approaches utilizing information at a single locus.


Conflict of interest statement

Several authors are now employed by or run pharmaceutical companies. All significant contributions to this study were made before these roles and the named companies had no role in the study. M.A. is an employee of AstraZeneca. P.S. is an employee of Roche. J.M. is an employee of Genomics PLC. G.A. is an employee of CSL Limited. S.K. is the chief executive officer of Verve Therapeutics. The other authors declare no competing interests.

Figures

Fig. 1
Fig. 1. Proteins associated with polygenic risk for cardiometabolic disease.
a, Quantile–quantile plots of two-sided P values from linear regression testing associations between PGS and protein levels in n = 3,087 INTERVAL participants across all 3,438 tested proteins. Each plot compares the distribution of observed two-sided P values (y axes) to the distribution of expected two-sided P values under the null hypothesis for 3,438 tests (x axes) on a −log10 scale. Associations were fitted using linear regression adjusting for age, sex, ten genotype principal components, sample measurement batch and time between blood draw and sample processing. Full summary statistics including exact P values are provided in Supplementary Data 3a. The top five proteins by P value are labelled. b, Heatmaps showing the 49 proteins whose levels were significantly associated with at least one PGS after Benjamini–Hochberg FDR multiple-testing correction (FDR < 0.05) of the two-sided P values (statistical tests are as described in a). Each heatmap cell shows the s.d. change in protein levels per s.d. increase in PGS. Point estimates for the 49 FDR-significant proteins are detailed in Extended Data Fig. 3. Details about each protein are provided in Extended Data Fig. 4. c, Barplots showing the proportion of the genome (%) required to explain each PGS–protein association in n = 3,087 INTERVAL participants (polygenicity). Proteins are ordered from left to right by strength of PGS–protein association. Highlighted in red are PGS–protein associations that were explained by singular variants regulating protein levels, pQTLs, rather than polygenic. Percentages are detailed in Extended Data Fig. 3.
Fig. 2
Fig. 2. PGS-associated proteins influence 7.7-year risk of CAD and T2D.
a, Possible models of causality for PGS–protein–disease associations. C, causal disease factor upstream of the protein that induces a correlation between protein levels and disease. b, Association of PGS-associated proteins with 7.7-year risk of hospitalization with CAD or T2D in n = 3,087 INTERVAL participants in Cox proportional hazards models adjusting for age, sex, sample measurement batch and time between blood draw and sample processing. The data shown correspond to the HR for CAD or T2D conferred per s.d. increase in protein levels (points) and its 95% CI (vertical bars). P < 0.0012 indicates that the association was significant after Bonferroni correction for the 42 tests. c, Comparison of associations between protein levels and the CAD PGS or T2D PGS from Fig. 1b (x axes) to HRs for protein levels for 7.7-year risk of hospitalization with CAD or T2D from Fig. 2b (y axes). Beta estimates (points; x axes) correspond to s.d. change in protein levels per s.d. increase in CAD PGS or T2D PGS in the linear regression described in Fig. 1b. HRs (y axes) are as described in b. Linear regression and Cox proportional hazards models were fitted in the same n = 3,087 samples. The point shape and colour correspond to the P value in b. d, Percentage of PGS–disease association mediated by each protein in causal mediation analysis in n = 3,087 INTERVAL participants adjusting for age, sex, ten genotype principal components, sample measurement batch and time between blood draws. The data shown are the percentage of association between the PGS and hospitalization with CAD or T2D after 7.7 years of follow-up in Cox proportional hazard models mediated by each respective protein (points) and the 95% CI of this percentage (vertical bars). Proteins are ordered from left to right by their HR in Fig. 1b and coloured red where protein levels increased with PGS or blue where protein levels decreased with PGS in Fig. 1b. P < 0.0012 indicates that mediation was significant after Bonferroni correction for the 42 tests. Full summary statistics including exact two-sided P values for bd are detailed in Extended Data Fig. 3.
Extended Data Fig. 1
Extended Data Fig. 1. Study schematic.
Overview of the study design.
Extended Data Fig. 2
Extended Data Fig. 2. Cohort characteristics.
IQR: interquartile range. Body mass index (BMI) was computed from self-reported height and weight.
Extended Data Fig. 3
Extended Data Fig. 3. Summary statistics for PGS to protein to disease associations.
Beta: standard deviation change in protein levels per standard deviation increase in PGS (from Fig. 1b) in linear regression adjusting for age, sex, 10 genotype PCs, sample measurement batch, and time between blood draw and sample processing. FDR: Benjamini-Hochberg false discovery rate corrected P-value. FDR correction was applied separately for each PGS to all 3,438 P-values from linear regression of each of the 3,438 measured proteins on the respective PGS. Polygenicity: proportion of the genome (%) required to explain the PGS to protein association (from Fig. 1c). HR: hazard ratio for 7.7 year risk of hospitalisation with the respective disease conferred per standard deviation increase in protein levels (from Fig. 2b) in cox proportional hazard models using follow-up as time scale and adjusting for age, sex, sample measurement batch, and time between blood draw and sample processing. Associations highlighted in red indicate significant associations after Bonferroni correction for the 42 tests (P < 0.0012). Associations dulled in grey indicate P > 0.05. % PGS Mediated: Percentage of total association between the respective PGS and 7.7 year risk of hospitalisation with the respective disease mediated by the respective protein (from Fig. 2d). Highlighted in red indicates mediation was significant after Bonferroni correction for the 42 tests (P < 0.0012). Entries dulled in grey indicate P > 0.05. Linear regression, polygenicity, cox proportional hazard models, and mediation analysis were all performed in the same n = 3,087 independent INTERVAL participants. In each instance, 95% CI corresponds to the 95% confidence interval of the respective point estimate. All P-values are two-sided. 95% confidence intervals and P-values could not be formulated for the polygenicity tests. For proteins measured by more than one SomaLogic aptamer (GPD1, IGFBP1, IGFBP2, SHBG, and WFIKKN2) effect sizes were averaged and two-sided P-values were obtained from averaged Z-scores, and aptamer-specific summary statistics are detailed in Supplementary Table 3.
Extended Data Fig. 4
Extended Data Fig. 4. Information about each PGS associated protein.
Aptamer: Sequence ID for the SomaLogic aptamer(s) targeting the protein. A * next to the protein name indicates the aptamer(s) binds to specific isoforms of the listed protein or binds to multiple proteins; see Aptamer target column. Extended details on aptamer sensitivity and specificity can be found in Supplementary Table 2.
Extended Data Fig. 5
Extended Data Fig. 5. Previous evidence for PGS-associated proteins in disease.
Citations provided where association with the respective disease has been previously observed.
Extended Data Fig. 6
Extended Data Fig. 6. Robustness of PGS to protein associations.
a-c) Robustness and longitudinal stability of PGS to protein associations to proteomics technology. d-e) Robustness and longitudinal stability of protein levels to proteomics technology. f) Robustness of PGS-protein associations to environmental and physiological confounding. g) Mediation of PGS-protein associations through body mass index (BMI) for six proteins associated with T2D PGS. a) Compares PGS-protein associations from Fig. 1b in n = 3,087 INTERVAL participants in which protein levels were measured with the SomaLogic platform (x-axis) to PGS-protein associations tested in an independent set of n = 418 INTERVAL participants in which protein levels were measured with the Olink Explore platform (y-axis). In total 1,463 proteins were quantified by the Olink Explore platform, including 907 quantified by the SomaLogic platform, and among these 16 of the 49 PGS-associated proteins from Fig. 1b. b) Compares PGS-protein associations from Fig. 1b (x-axis) to PGS-protein associations tested in an independent set of n = 3,848 INTERVAL participants in which protein levels were measured with the Olink T96 platform (y-axis). In total 265 proteins were quantified by the Olink T96 platform, including 224 quantified by the SomaLogic platform, and among these 4 of the 49 PGS-associated proteins from Fig. 1b. c) Compares PGS-protein associations tested in n = 646 INTERVAL participants in which protein levels were measured with both the SomaLogic platform (x-axis) and, after two-years of follow-up, the Olink T96 platform (y-axis). a-c) Data shown correspond to the beta estimates from linear regression (points) and their 95% confidence interval (bars), indicating standard deviation change in protein levels per standard deviation increase in the respective PGS (denoted by colour). Solid points indicate two-sided P-value < 0.05 for the test on the y-axis. Linear regression on both axes were adjusted for age (at protein measurement), sex, 10 genotype PCs, and platform-specific technical covariates. Full summary statistics including exact P-values are detailed in Supplementary Data 3,b for linear regression tests on y-axes, and in Supplementary Data 3,a for linear regression tests on x-axes. d) Compares protein levels quantified by the SomaLogic platform (x-axes) to protein levels quantified by the Olink T96 platform (y-axes) after two years of follow-up in n = 646 INTERVAL participants. e) Compares protein levels quantified by the Olink T96 platform (x-axes) to protein levels quantified by the Olink Explore platform (y-axes) in n = 418 INTERVAL participants. f) Compares PGS-protein associations from Fig. 1b in n = 3,087 INTERVAL participants (x-axes) to PGS-protein associations (1) additionally adjusted for circadian effects (time of day of blood draw), (2) additionally adjusted for seasonal effects (date of blood draw), (3) when including 87 additional participants with prevalent cardiometabolic disease (n = 3,174 on y-axis), and (4) when adjusting for BMI (n = 3,072 participants with non-missing BMI on y-axis). All associations were testing using linear regression adjusting for age, sex, 10 genotype PCs, sample measurement batch, and time between blood draw and sample measurement in addition to the covariates noted above. Data shown correspond to the beta estimates from linear regression (points) and their 95% confidence interval (bars), indicating standard deviation change in protein levels per standard deviation increase in the respective PGS (denoted by colour). Full summary statistics including exact P-values in these sensitivity analyses are detailed in Supplementary Data 3,c. g) For the six proteins whose association with T2D PGS was attenuated by adjustment for BMI (P > 0.05; Extended Data Fig. 6f) gives, from mediation analysis, the estimated effect of T2D PGS on the protein levels through BMI (standard deviation change in protein levels through BMI per standard deviation increase in T2D PGS), percentage of T2D PGS to protein levels mediated by BMI, and the estimated effect of T2D PGS on protein levels independent of BMI in n = 3,072 INTERVAL participants. All P-values are two-sided.
Extended Data Fig. 7
Extended Data Fig. 7. Polygenicity of PGS to protein associations.
Linkage disequilibrium (LD) blocks contributing to each PGS to protein association in polygenicity tests. Briefly, each PGS was partitioned into 1,703 approximately independent LD blocks then tested for association with each protein in linear regression adjusting for age, sex, 10 genotype PCs, sample measurement batch, and time between blood draw and sample processing in 3,087 INTERVAL participants. Full summary statistics including exact two-sided P-values for these tests are detailed in Supplementary Data 3,e. Next, to obtain the set of LD blocks contributing to each PGS to protein association, LD blocks were sequentially removed from the PGS in ascending order by association P-value (two-sided) until the association between resulting PGS and protein levels were attenuated (two-sided P > 0.05). Full summary statistics including exact two-sided P-values for these tests are detailed in Supplementary Data 3,f. The polygenicity of PGS to protein association (% of genome) shown on the left (and in Fig. 1c) was subsequently computed based on the sum of lengths of all contributing LD blocks (in base pairs) as a proportion of the genome. Here, associations (−log10 two-sided P-values) between protein levels and LD blocks contributing to the PGS to protein association are shown. Regions in white contain LD blocks that did not contribute to the PGS to protein association. PGS to protein associations listed in red are those explained by pQTLs (cis and/or trans) rather than polygenic.
Extended Data Fig. 8
Extended Data Fig. 8. Incident disease and PGS validity.
a) Incident disease events over the 7.7 year of follow-up in the n = 3,087 INTERVAL participants. Endpoint: incident disease definition available in INTERVAL for the relevant PGS, as defined by CALIBER phenotyping algorithms. Age of onset: median age of first hospitalisation with the respective endpoint. Numbers in brackets gives the interquartile range. b) Hazard ratio (HR) (points) and 95% confidence interval (95% CI) (horizontal bar) for 7.7 year risk of hospitalisation with the respective endpoint per standard deviation increase in the respective PGS in cox proportional hazards models using follow-up as time scale and adjusting for age, sex, 10 genotype PCs, sample measurement batch, and time between blood draw and sample processing in n = 3,087 INTERVAL participants. P-values are two-sided. c) Association between CKD PGS with estimated glomerular filtration rate (eGFR), a marker of renal function used in chronic kidney disease diagnosis: decreased eGFR is indicative of reduced renal function. EGFR was computed from serum creatinine in n = 3,307 participants using the CKD-EPI equation. Association was fit with linear regression adjusting for age and sex, and 10 genotype PCs. The point corresponds to the change in eGFR per standard deviation increase in CKD PGS, and the horizontal bar corresponds to the 95% CI. P-values are two-sided.
Extended Data Fig. 9
Extended Data Fig. 9. Mendelian randomisation analysis.
a) Causal effects of protein levels on disease risk estimated through two-sample Mendelian randomisation analysis of pQTL summary statistics and disease GWAS summary statistics. OR: consensus estimate of the odds ratio conferred per standard deviation increase in protein levels across five Mendelian randomisation methods. * Estimated causal effect is directionally consistent with PGS-protein associations in Fig. 1b. 95% CI: 95% confidence interval. P-value: Two-sided P-value obtained by averaging Z-scores across five Mendelian randomisation methods. Entries are greyed out where P > 0.05, and red where P < 0.0038 (Bonferroni correction for 13 tests). Pleiotropy P-value: two-sided P-value for the intercept term in Egger regression, indicating where P < 0.05 confounding of the causal estimate by horizontal pleiotropy. Full summary statistics including exact P-values are detailed in Supplementary Table 6. b) Dose response curves showing the estimated causal effect of changes in protein levels on disease risk for each protein and disease. Points on each plot show the cis-pQTLs used as genetic instruments for each test. On the x-axes, points show the standard deviation change in protein levels per copy of the minor allele in the pQTL summary statistics, and horizontal bars show + /- the standard error. On the y-axes, points show odds ratio conferred per copy of the minor allele in the GWAS summary statistics, and vertical bars indicate show + /- the standard error. Effect sizes, standard errors, and exact two-sided P-values from pQTL and GWAS summary statistics are detailed in Supplementary Table 7. The slope of the orange dashed line corresponds to the estimated causal effect (consensus Odds Ratio from a). The yellow ribbon shows the 95% confidence interval for the estimated causal effect (slope), accounting also for the 95% confidence interval for the intercept term in Egger regression.
Extended Data Fig. 10
Extended Data Fig. 10. Overlap of results with proteome-wide T2D associations in AGES-Reykjavik.
a) Contingency table tabulating the overlap in results from our study detailed in Extended Data Fig. 3 (rows) with proteome-wide significant associations with incident and prevalent T2D in AGES-Reykjavik in Gudmundsdottir et al. 2020 (columns). One-sided P-values from Fisher’s exact tests are given in each cell testing whether the overlap is greater than expected by chance. Row totals and column totals indicate the number of proteins in each row and column group, and the total overlap in proteins present in both studies (3,250) is given in the bottom right. b) For the 16 of 31 proteins nominally associated with T2D PGS in INTERVAL (Fig. 2b) and proteome-wide significant for incident T2D in AGES-Reykjavik, compares hazard ratios (points; x-axis) for incident T2D in INTERVAL (N = 27 cases over 7.7 years of follow-up in 3,087 participants) to odds ratios (points; y-axis) for incident T2D in AGES-Reykjavik (N = 112 cases after 5 years of follow-up in 2,940 participants). Cox proportional hazards models in INTERVAL were fit with follow-up as time scale, adjusting for age, sex, 10 genotype PCs, sample measurement batch, and time between blood draw and sample processing. Logistic regression in AGES-Reykjavik were fit adjusting for age and sex. Horizontal and vertical bars correspond to the 95% confidence intervals of the hazard ratios and odds ratios respectively. Two-sided P < 0.0012 indicates association with incident T2D in INTERVAL from Fig. 2b was significant after Bonferroni correction for the 42 tested protein to disease associations. Summary statistics including exact two-sided P-values from both analyses are given in Supplementary Table 8.

References

    1. Purcell SM, et al. Common polygenic variation contributes to risk of schizophrenia and bipolar disorder. Nature. 2009;460:748–752. doi: 10.1038/nature08185. - DOI - PMC - PubMed
    1. Loh P-R, et al. Contrasting genetic architectures of schizophrenia and other complex diseases using fast variance-components analysis. Nat. Genet. 2015;47:1385–1392. doi: 10.1038/ng.3431. - DOI - PMC - PubMed
    1. Khera AV, et al. Genome-wide polygenic scores for common diseases identify individuals with risk equivalent to monogenic mutations. Nat. Genet. 2018;50:1219–1224. doi: 10.1038/s41588-018-0183-z. - DOI - PMC - PubMed
    1. Lambert SA, Abraham G, Inouye M. Towards clinical utility of polygenic risk scores. Hum. Mol. Genet. 2019;28:R133–R142. doi: 10.1093/hmg/ddz187. - DOI - PubMed
    1. Torkamani A, Wineinger NE, Topol EJ. The personal and clinical utility of polygenic risk scores. Nat. Rev. Genet. 2018;19:581–590. doi: 10.1038/s41576-018-0018-x. - DOI - PubMed

Publication types

MeSH terms