

Kerley A-lines represent thickened septal plates between lung segments in patients with lymphangitic carcinomatosis: confirmation using 3D-CT lung segmentation analysis
- PMID: 34750736
- PMCID: PMC8977263
- DOI: 10.1007/s11604-021-01215-4
Kerley A-lines represent thickened septal plates between lung segments in patients with lymphangitic carcinomatosis: confirmation using 3D-CT lung segmentation analysis
Abstract
Purpose: Kerley A-lines are generally apparent in patients with pulmonary edema or lymphangitic carcinomatosis. There are two main thoughts regarding the etiology of Kerley A-lines, but no general agreement. Specifically, the lines are caused by thickened interlobular septa or dilated anastomotic lymphatics. Our purpose was to determine the anatomic structure represented as Kerley A-lines using 3D-CT lung segmentation analysis.
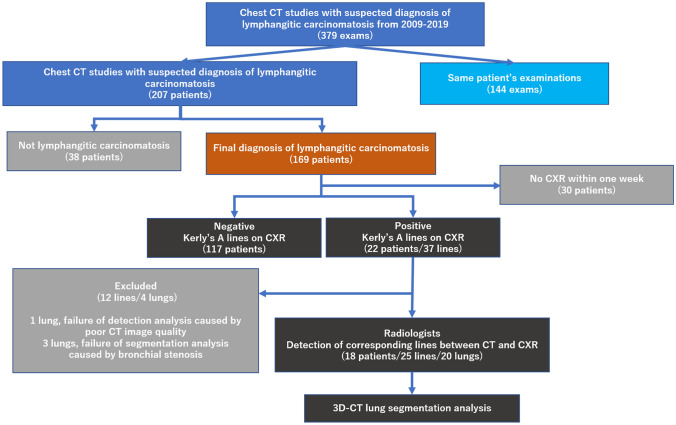
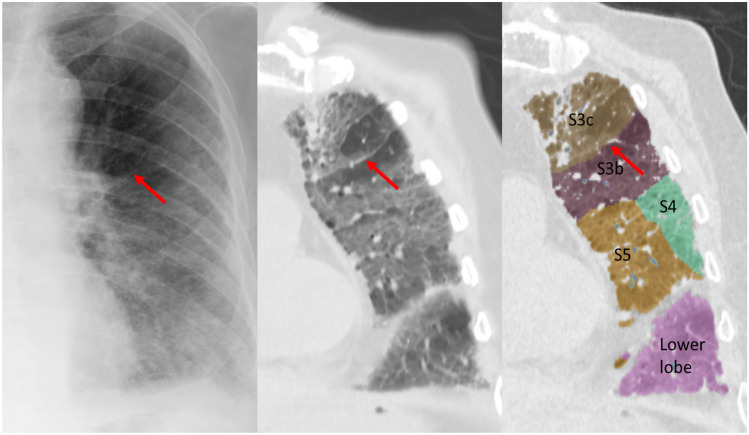
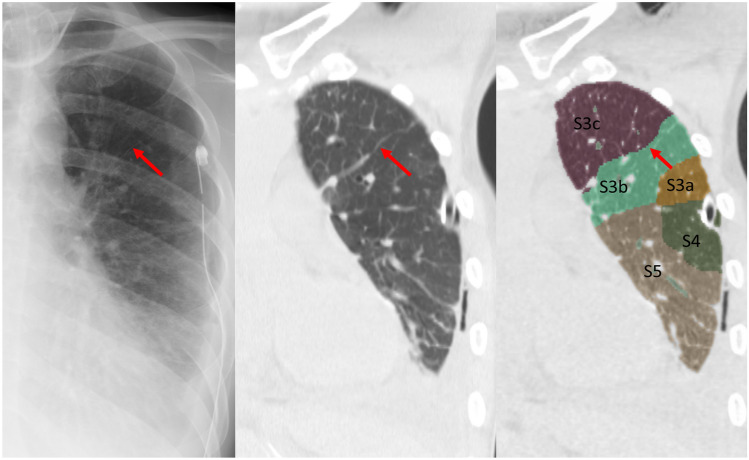
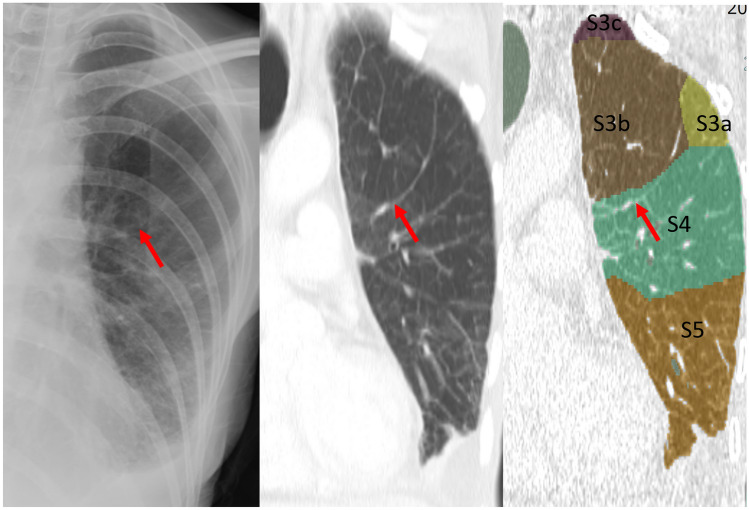
Materials and methods: We reviewed 139 charts of patients with lymphangitic carcinomatosis of the lung who had CT and X-ray exams with a maximum interval of 7 days. The presence of Kerley A-lines on X-ray was assessed by a radiologist. The A-lines on X-ray were defined as follows: dense; fine (< 1 mm thick); ≥ 2 cm in length, radiating from the hilum; no bifurcation; and not adjacent to the pleura. For cases with Kerley A-lines on X-ray, three radiologists agreed that the lines on CT corresponded with Kerley A-lines. The incidence of A-lines and the characteristics of the lines were investigated. The septal lines between lung segments were identified using a 3D-CT lung segmentation analysis workstation. The percentage of agreement between the A-lines on CT and lung segmental lines was assessed.
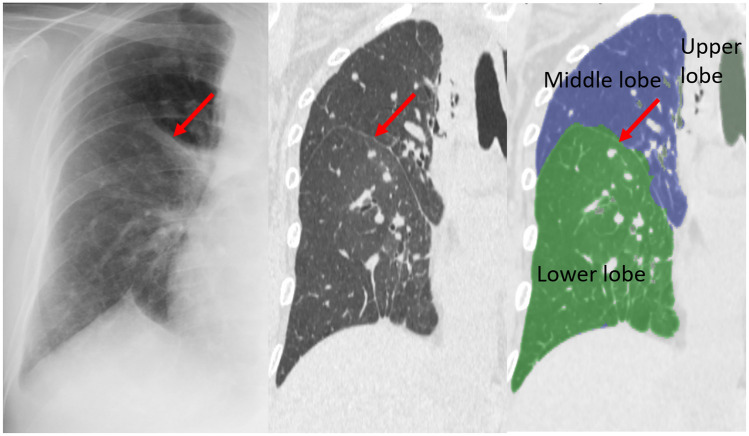
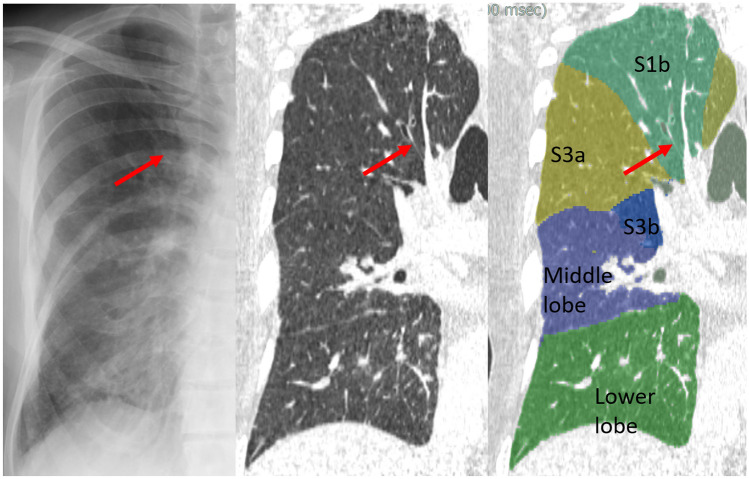
Results: On chest X-ray, 37 Kerley A-lines (right, 16; left, 21) were identified in the 22 cases (16%). Of these, 4 lungs with 12 lines were excluded from analysis due to technical reasons. Nineteen of the 25 lines (76%) corresponded to the septal lines on CT. Of these, 11 lines matched with automatically segmented lines (intersegmental septa, 4; intersubsegmental septa, 7) by the workstation. Two lines (8%) represented fissures. Four lines corresponded to the bronchial wall/artery (3 lines, 12%) or vein (1 line, 4%).
Conclusion: Kerley A-lines primarily represented thickened and continued interlobular septal lines that corresponded to the septa between lung segments and subsegments.
Keywords: Computed tomography; Interlobular septa; Kerley's A lines; Lung segmentation; Lymphatics.
© 2021. The Author(s).
Conflict of interest statement
Sadayuki Murayama received funding from Canon Medical.
Figures

References
-
- Kerley PJ. Occupational disease of the lungs. In: Shanks C, Kerley P, editors. A text-book of X-ray diagnosis. 2. London: H. K. Lewis; 1951. p. 404.
-
- Kerley PJ. The pulmonary circulation. In: Shanks C, Kerley P, editors. A text-book of X-ray diagnosis. 4. London: H. K. Lewis; 1972. pp. 40–47.
-
- Felson B. Chest roentgenology. Tronto: Atbs Publisher; 1973. The hila and pulmonary vessels; pp. 241–250.
MeSH terms
LinkOut - more resources
Full Text Sources
Medical
