. 2022 Jan 5;23(1):e202100467.
doi: 10.1002/cbic.202100467. Epub 2021 Dec 2.

Optochemical Control of Bacterial Gene Expression: Novel Photocaged Compounds for Different Promoter Systems

Affiliations

Optochemical Control of Bacterial Gene Expression: Novel Photocaged Compounds for Different Promoter Systems

Fabian Hogenkamp et al. Chembiochem. .

Abstract

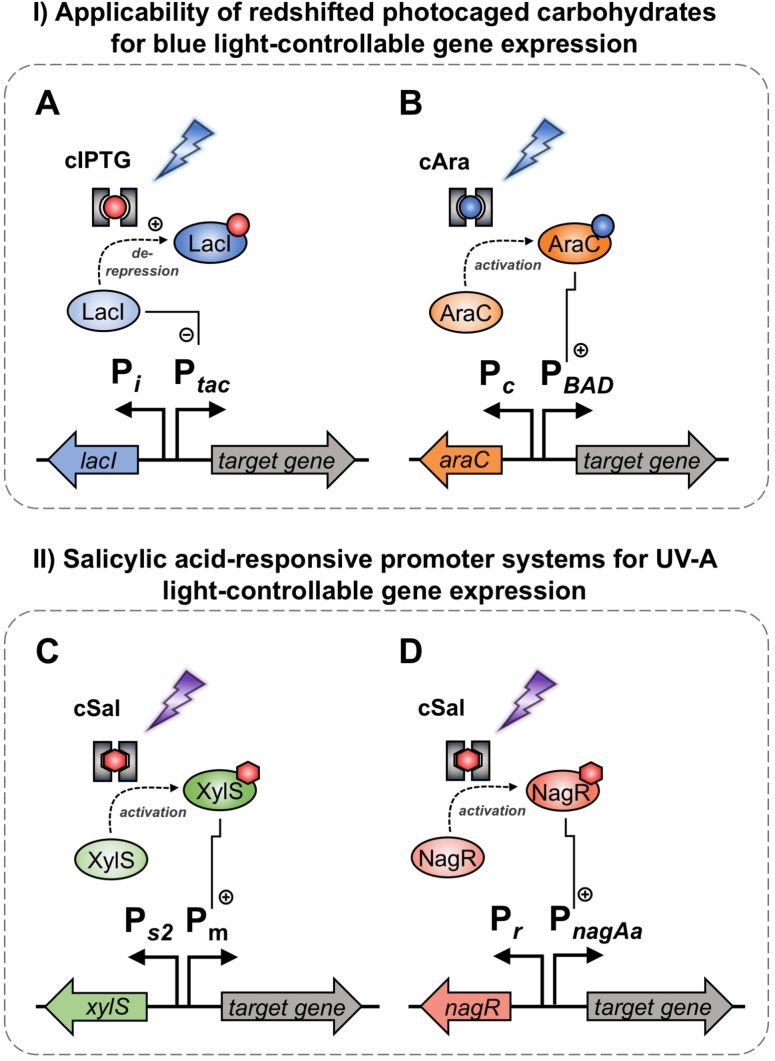
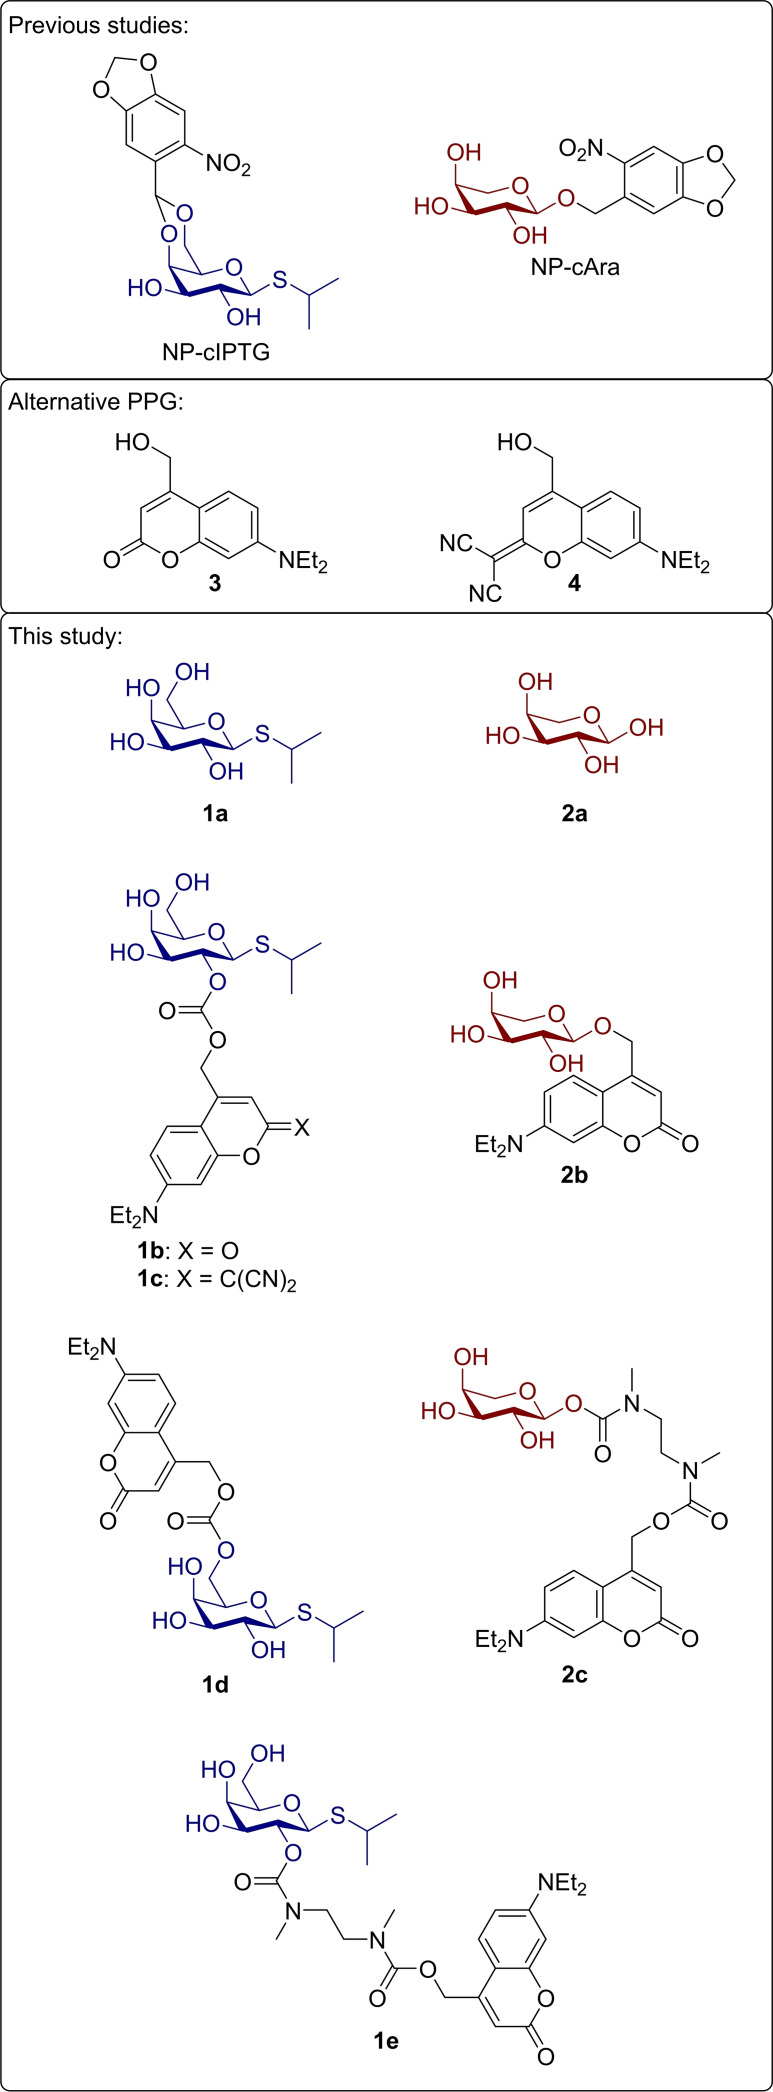
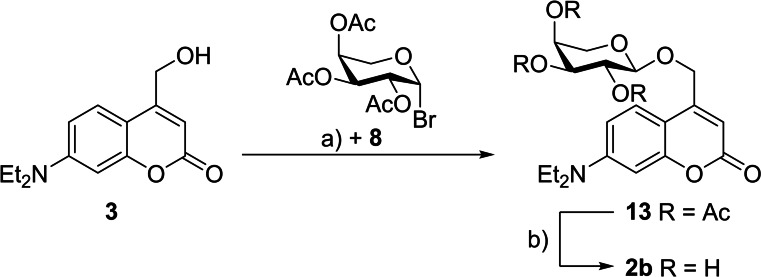
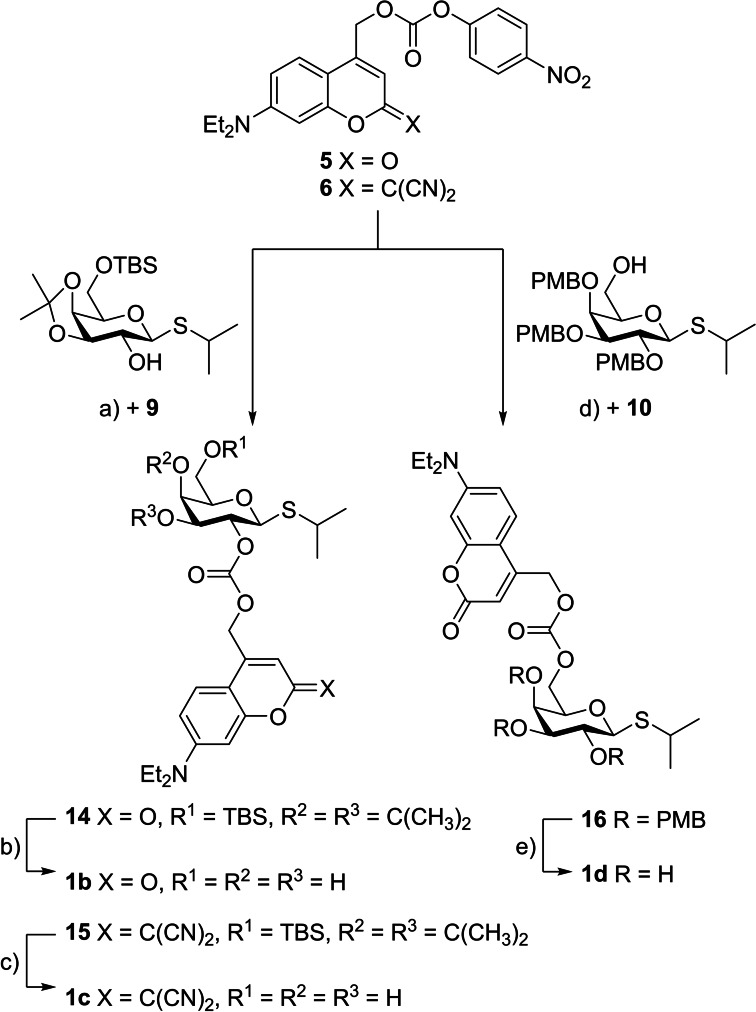
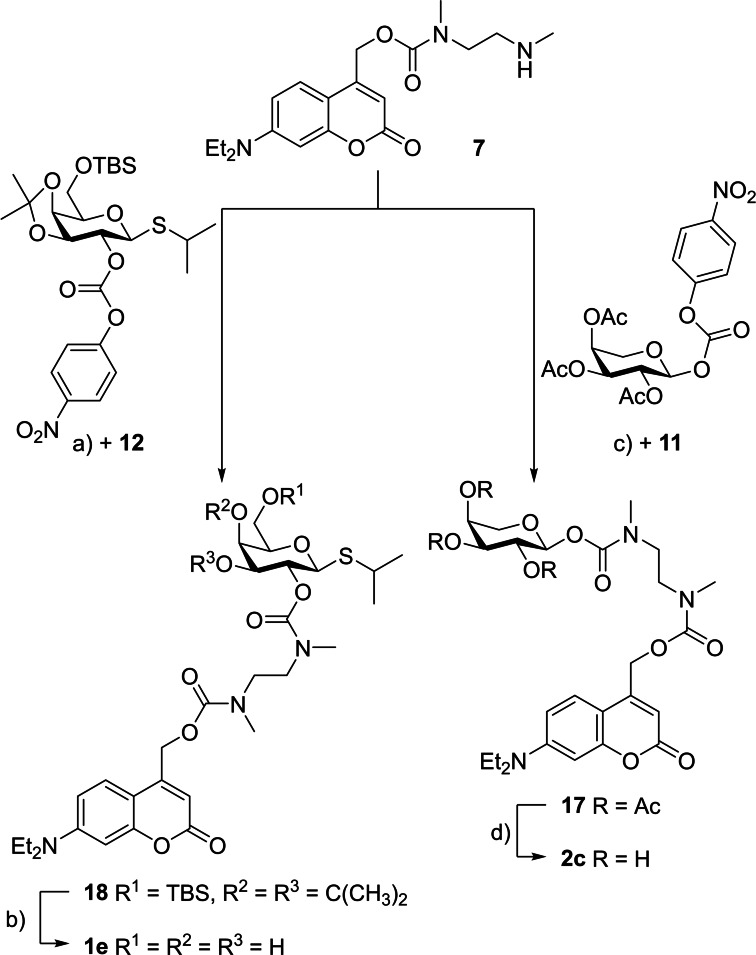
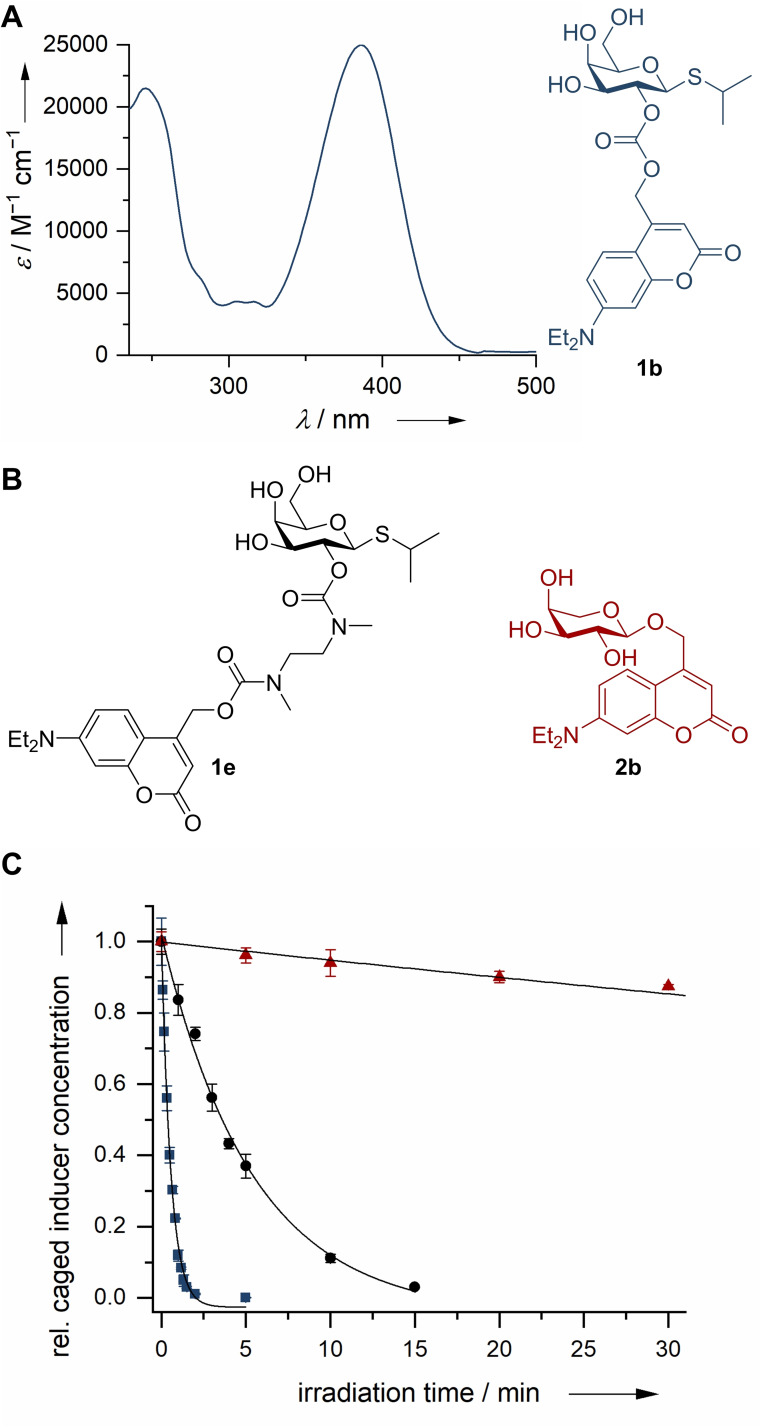
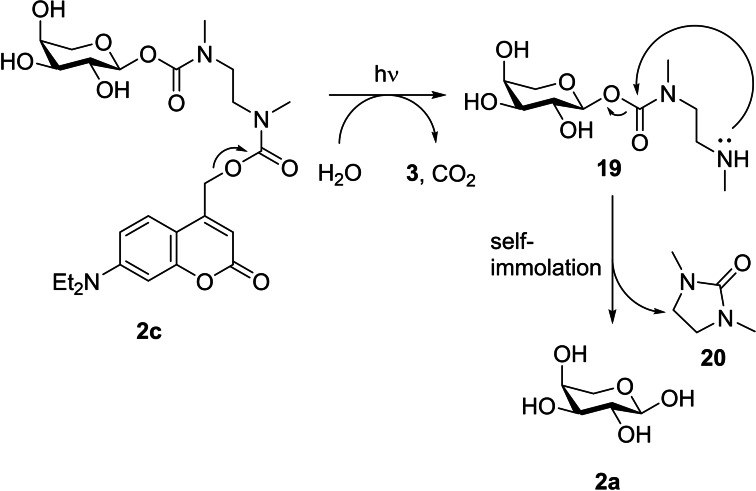
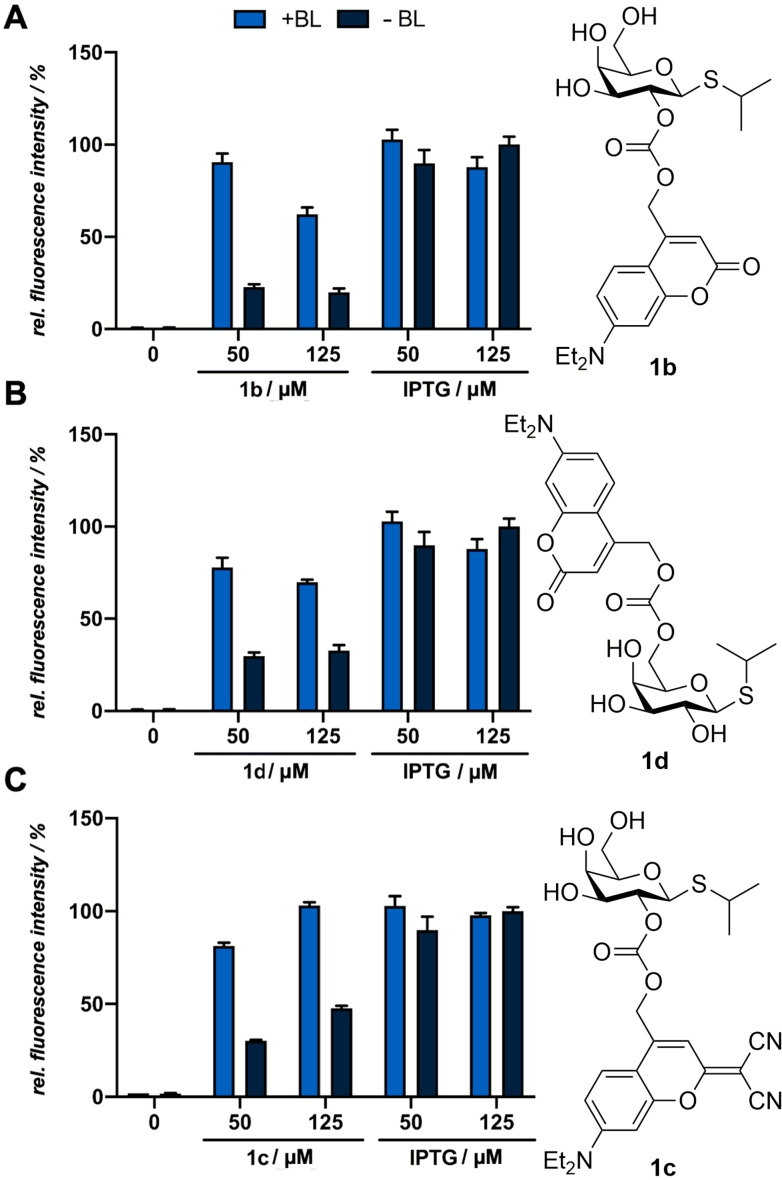
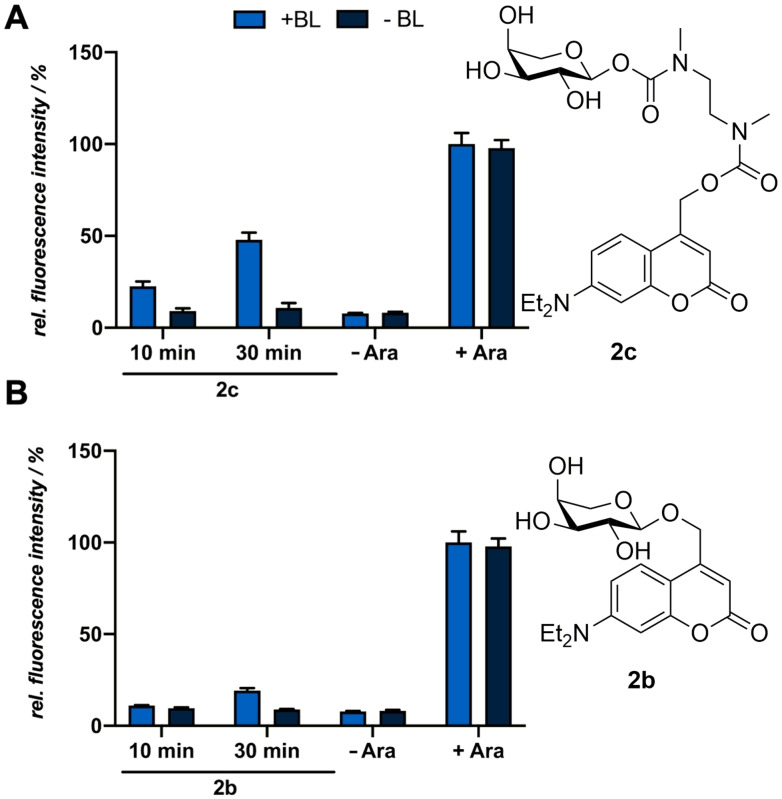
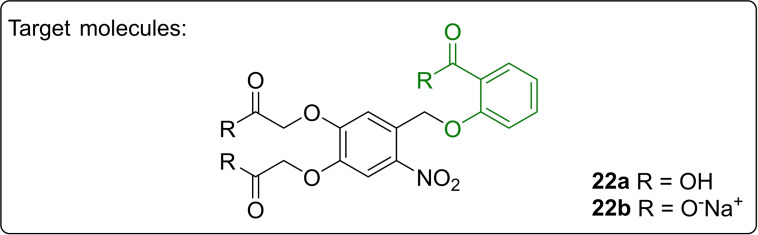
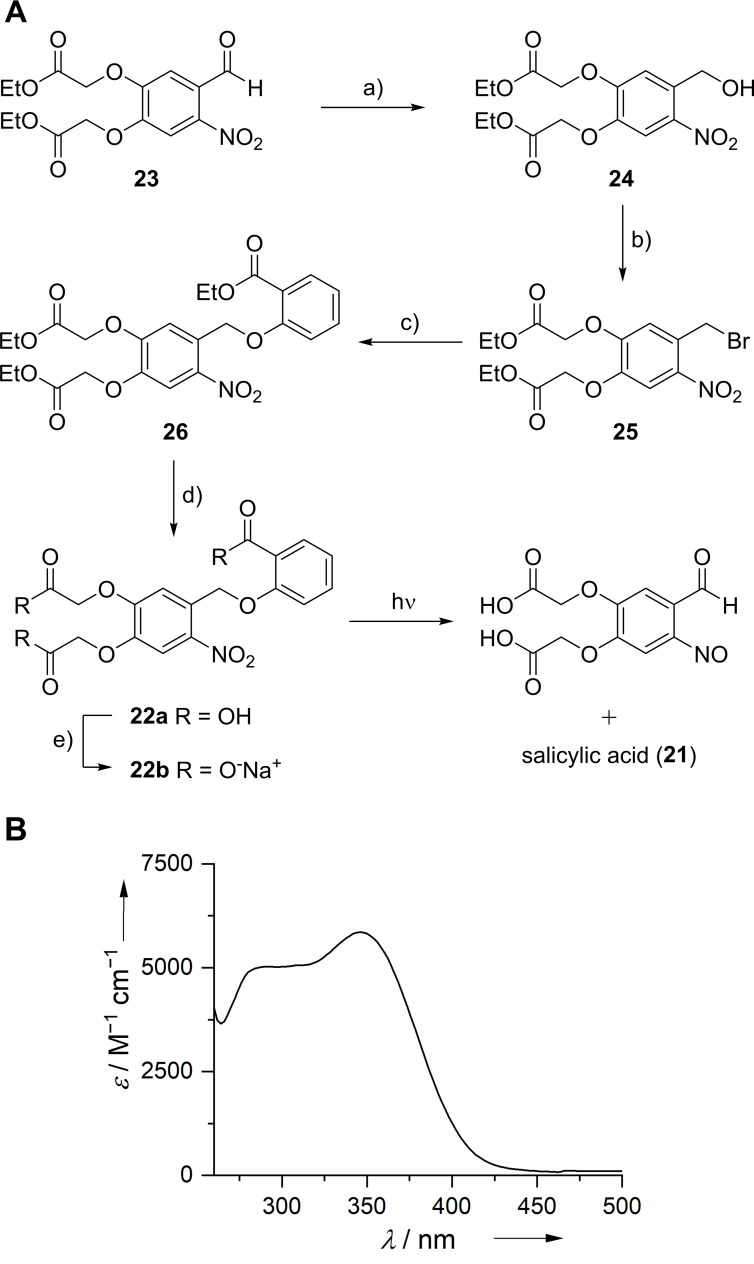
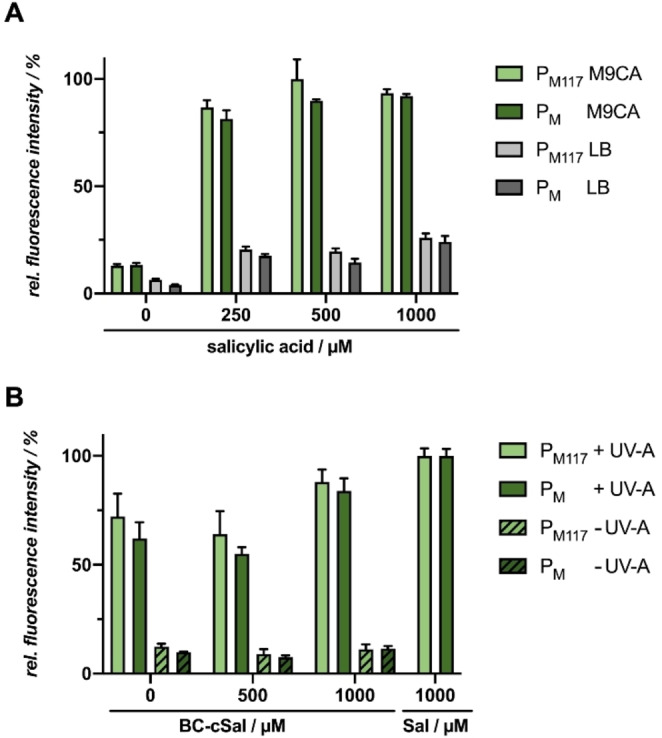
Photocaged compounds are applied for implementing precise, optochemical control of gene expression in bacteria. To broaden the scope of UV-light-responsive inducer molecules, six photocaged carbohydrates were synthesized and photochemically characterized, with the absorption exhibiting a red-shift. Their differing linkage through ether, carbonate, and carbamate bonds revealed that carbonate and carbamate bonds are convenient. Subsequently, those compounds were successfully applied in vivo for controlling gene expression in E. coli via blue light illumination. Furthermore, benzoate-based expression systems were subjected to light control by establishing a novel photocaged salicylic acid derivative. Besides its synthesis and in vitro characterization, we demonstrate the challenging choice of a suitable promoter system for light-controlled gene expression in E. coli. We illustrate various bottlenecks during both photocaged inducer synthesis and in vivo application and possibilities to overcome them. These findings pave the way towards novel caged inducer-dependent systems for wavelength-selective gene expression.

Keywords: caged compounds; gene expression; optogenetics; photochemistry; synthetic biology.


Conflict of interest statement

The authors declare no conflict of interest.

Figures

Figure 1
Figure 1
Promoter systems for optogenetic control of target gene expression used in this study. Firstly, the applicability of photocaged carbohydrates for controlling gene expression with blue light (flash symbol) was evaluated. For induction with photocaged IPTG (cIPTG, red dot with grey frame), the well‐established P tac /LacI promoter system (A) was chosen, in which the P tac promoter is subject to regulation by the LacI activator protein. Upon binding of a suited inducer such as IPTG (red dot), LacI undergoes a conformational change leading to the dissociation from the operator region and thus, de‐repression of transcription. For induction with photocaged arabinose (cAra, blue dot with grey frame), the P BAD /AraC promoter system (B) was applied, which is positively regulated by the activator protein AraC upon l‐arabinose (blue dot) binding. As a second step, salicylic acid‐responsive promoter systems were for the first time evaluated for photo‐controllable gene expression using photocaged salicylic acid derivatives (cSal, red hexagon with grey frame). For this purpose, the P m /XylS regulatory system was applied, which is positively controlled by the activator protein XylS in the presence of salicylic acid (red hexagon). Furthermore, the P nagAa /NagR regulon was evaluated, which is also positively regulated by its activator protein NagR in the presence of salicylic acid (red hexagon).
Figure 2
Figure 2
Photocaged carbohydrates deployed in previous publications,[ 12c , 14 ] alternative photolabile protecting groups 3 and 4 serving as starting point and targeted photocaged inducer molecules 1 be and 2 bc based on the effector molecules 1 a and 2 a potentially suitable for bathochromically shifted irradiation.
Scheme 1
Scheme 1
Synthetic scheme for preparation of photocaged arabinose 2 b. Reagents and conditions: a) AgOTf, CH2Cl2, RT, 22 h, 59 %; b) NH3 in MeOH (7 m), MeOH, RT, quant.
Scheme 2
Scheme 2
Synthetic scheme for preparation of photocaged IPTG 1 b, 1 c and 1 d. Reagents and conditions: a) DMAP, CH2Cl2, RT, 20 h, 77–96 %; b) TFA, H2O, CH2Cl2, 0 °C, 10 min, 96 %; c) TFA, H2O, CH2Cl2, 0 °C, 10 min, 92 %; d) DMAP, CH2Cl2, RT, 20 h, 66 %; e) TFA, H2O, CH2Cl2, 0 °CRT, 1 h, 78 %.
Scheme 3
Scheme 3
Synthetic scheme for preparation of photocaged arabinose 2 c and photocaged IPTG 1 e. Reagents and conditions: a) DIPEA, DMAP, CH2Cl2, RT, 24 h, 97 %; b) TFA, H2O, 0 °C, 10 min, quant.; c) DIPEA, DMAP, CH2Cl2, RT, 24 h, 85 %; d) NH3 in MeOH (7 m), MeOH, RT, 86 %.
Figure 3
Figure 3
A) Exemplary absorption spectrum of photocaged inducer molecule 1 b. B) Molecular structures of photocaged inducer molecules 1 b, 1 e and 2 b. C) Comparison of decay of photocaged inducer molecules 1 b, 1 e and 2 b after irradiation at 405 nm. Ether 2 b (red triangles), Carbonate 1 b (blue squares), Carbamate 1 e (black circle).
Scheme 4
Scheme 4
Representative release cascade after irradiation of compound 2 c in aqueous media.
Figure 4
Figure 4
Normalized in vivo eYFP fluorescence intensity of E. coli Tuner (DE3)/pRhotHi‐2‐lacI‐eYFP expression cultures supplemented with 50 μm and 125 μm of the photocaged compounds 1 b (A), 1 d (B) or 1 c (C). All cultures were incubated in the dark for 20 h in LB medium at 30 °C. Induction of reporter gene expression was performed after 2.5 h by blue light exposure at 447 nm (+BL; ∼10 mW cm−2) for 10 min [1 b, 1 c, 1 d or by the addition of respective amounts of conventional IPTG (1 a)]. In vivo fluorescence intensities were determined by using a Tecan Microplate Reader (eYFP: λex=488 nm, λem=527 nm), normalized to cell densities and are shown in relation to the respective fluorescence intensities of a culture kept in the dark (‐BL). Values are means of triplicate measurements. Error bars indicate the respective standard deviations.
Figure 5
Figure 5
Normalized in vivo mCherry fluorescence intensity of E. coli LMG194/pBTBX‐2‐mCherry expression cultures supplemented with 50 μm of the photocaged arabinose variants 2 c (A) and 2 b (B). All cultures were incubated in the dark for 20 h in LB medium at 37 °C and light‐mediated induction of reporter gene expression was performed after 2.5 h by blue light exposure at 447 nm (+BL; ∼10 mW cm−2) for 10 or 30 min or the addition of respective amounts of conventional arabinose (2 a). In vivo fluorescence intensities were determined by using a Tecan Microplate Reader (mCherry: λex=580 nm, λem=610 nm), normalized to cell densities and are shown in relation to the respective fluorescence intensities of a culture induced with conventional arabinose (2 a) and exposed to blue light for 30 min. Values are means of triplicate measurements. Error bars indicate the respective standard deviations.
Figure 6
Figure 6
Targeted photocaged salicylic acids 22 a and 22 b.
Scheme 5
Scheme 5
A) Synthetic scheme for preparation of BC‐cSal (22 a) and BC‐cSal*Na (22 b). Reagents and conditions: a) NaBH4, CH2Cl2, EtOH, AcOH, 0 °C, 3 h, 73 %; b) CBr4, PPh3, CH2Cl2, 0 °CRT, 6 h, 96 %; c) ethyl salicylate, K2CO3, acetone, RT, 2 d, 92 %; d) KOH (0.2 m), MeOH, 60 °C, 4 h, 92 %; e) NaOH (0.2 m), MeOH, RT, 5 min, quant. B) Absorption spectrum of compound 22 a.
Figure 7
Figure 7
Light‐controlled gene expression in E. coli Tuner (DE3)/pM117(pM)‐R45T‐GFPmut3 using BC‐cSal (22 a). A) In vivo GFPmut3 fluorescence (λex=508 nm, λem=532 nm) of E. coli cultures grown in LB medium (grey) or M9CA minimal medium (green) at 30 °C after 20 h (stationary growth phase). Induction was performed after 6 h with salicylic acid (21) concentrations ranging from 0 to 1000 μm. B) In vivo GFPmut3 fluorescence (λex=508 nm, λem=532 nm) of E. coli cultures grown in M9CA minimal medium at 30 °C and supplemented with 500 μm or 1000 μm of BC‐cSal (22 a) is shown in relation to a 0 and 1000 μm salicylic acid (Sal) control after 20 h (stationary growth phase). Induction was performed after 6 h via UV‐A light exposure at 365 nm (∼1 mW cm−2) for 30 min or the addition of 1000 μm salicylic acid (Sal). In vivo fluorescence intensities were normalized to cell densities and values are means of individual biological triplicates. Error bars indicate the respective standard deviations.
Figure 8
Figure 8
Light‐controlled gene expression in E. coli Tuner(DE3)/pM117‐R45T‐GFPmut3 or pM‐R45T‐GFPmut3 using UV‐A light. A) In vivo GFPmut3 fluorescence (λex=508 nm, λem=532 nm) of E. coli cultures illuminated with UV‐A light for different exposure time is shown in relation to a salicylic acid control (Sal). Induction was performed after 6 h via UV‐A light exposure at 365 nm (∼1 mW cm−2) or the addition of 1000 μm Sal. B) In vivo GFPmut3 fluorescence of E. coli cultures harbouring plasmid with both XylS gene and, as a negative control, a xylS gene deletion (ΔXylS) plasmid variant and illuminated with UV‐A light for 10–30 min is shown in relation to a 1000 μm salicylic acid control (Sal). Induction was performed after 6 h via UV‐A light exposure at 365 nm (∼1 mW cm−2) or the addition of 1000 μm Sal. In vivo fluorescence intensities were normalized to cell densities and values are means of individual biological triplicates. Error bars indicate the respective standard deviations.
Figure 9
Figure 9
Light‐controlled gene expression in E. coli Tuner (DE3)/pBNTmcs‐mCherry‐Km using novel caged salicylic acid derivatives. A) In vivo mCherry fluorescence (λex=580 nm, λem=610 nm) of E. coli cultures grown in LB medium (light green) or M9CA‐Gly minimal medium (dark green) at 30 °C after 20 h (stationary growth phase). Induction was performed after 2 h with salicylic acid (19) concentrations ranging from 0 to 1000 μm. B) In vivo mCherry fluorescence (λex=580 nm, λem=610 nm) of E. coli cultures grown in LB medium at 30 °C and supplemented with 1000 μm of BC‐cSal (22 a) and BC‐cSal sodium salt (BC‐cSal*Na, 22 b) is shown in relation to control cultures, where reporter gene expression was not induced (0 μm) or induced by adding 1000 μm salicylic acid (Sal) after 20 h (stationary growth phase). Induction was performed after 2 h via UV‐A light exposure at 365 nm (∼1 mW cm−2) for 30 min or the addition conventional inducer (Sal). In vivo fluorescence intensities were normalized to cell densities and values are means of triplicate measurements. Error bars indicate the respective standard deviations.

Similar articles

Cited by

References

    1. None
    1. Drepper T., Krauss U., Meyer zu Berstenhorst S., Pietruszka J., Jaeger K.-E., Appl. Microbiol. Biotechnol. 2011, 90, 23–40; - PubMed
    1. Hartmann D., Smith J. M., Mazzotti G., Chowdhry R., Booth M. J., Biochem. Soc. Trans. 2020, 48, 1645–1659. - PMC - PubMed
    1. Hamouri F., Zhang W., Aujard I., Le Saux T., Ducos B., Vriz S., Jullien L., Bensimon D., in Methods Enzymol., Vol. 624 (Ed.: Deiters A.), Academic Press, 2019, pp. 1–23. - PubMed
    1. None

Publication types

MeSH terms

LinkOut - more resources