

Characterising a homozygous two-exon deletion in UQCRH: comparing human and mouse phenotypes
- PMID: 34750991
- PMCID: PMC8649870
- DOI: 10.15252/emmm.202114397
Characterising a homozygous two-exon deletion in UQCRH: comparing human and mouse phenotypes
Abstract
Mitochondrial disorders are clinically and genetically diverse, with isolated complex III (CIII) deficiency being relatively rare. Here, we describe two affected cousins, presenting with recurrent episodes of severe lactic acidosis, hyperammonaemia, hypoglycaemia and encephalopathy. Genetic investigations in both cases identified a homozygous deletion of exons 2 and 3 of UQCRH, which encodes a structural complex III (CIII) subunit. We generated a mouse model with the equivalent homozygous Uqcrh deletion (Uqcrh-/- ), which also presented with lactic acidosis and hyperammonaemia, but had a more severe, non-episodic phenotype, resulting in failure to thrive and early death. The biochemical phenotypes observed in patient and Uqcrh-/- mouse tissues were remarkably similar, displaying impaired CIII activity, decreased molecular weight of fully assembled holoenzyme and an increase of an unexpected large supercomplex (SXL ), comprising mostly of one complex I (CI) dimer and one CIII dimer. This phenotypic similarity along with lentiviral rescue experiments in patient fibroblasts verifies the pathogenicity of the shared genetic defect, demonstrating that the Uqcrh-/- mouse is a valuable model for future studies of human CIII deficiency.
Keywords: OXPHOS; UQCRH; complex III; mitochondrial disease; mouse model.
© 2021 The Authors. Published under the terms of the CC BY 4.0 license.
Conflict of interest statement
The authors declare that they have no conflict of interest.
Figures
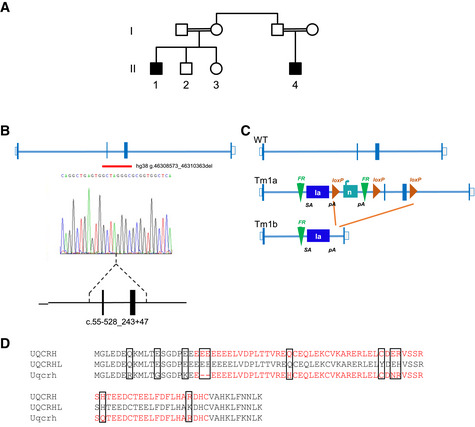
Pedigree of the family carrying a two‐exon deletion of UQCRH. Affected individuals (black‐filled squares) present with episodes of vomiting, metabolic acidosis, high lactate and hypoglycaemia.
Position of the identified UQCRH deletion in the two affected patients. Empty bars, untranslated region (UTR); filled bars, translated sequence; thin blue lines, intron; red line underlines the two deleted exons.
Scheme of the genomic targeting strategy by a Cre recombinase resulting in the deletion of two flanking loxP exons in the Uqcrh gene of the mouse model. SA indicates splice acceptor site; pA, poly‐A.
Alignment of amino acids of human UQCRH, human pseudogene UQCRHL and mouse Uqcrh. In red, the deleted amino acids in human and mouse. The black boxes indicate variation in amino acid residues.
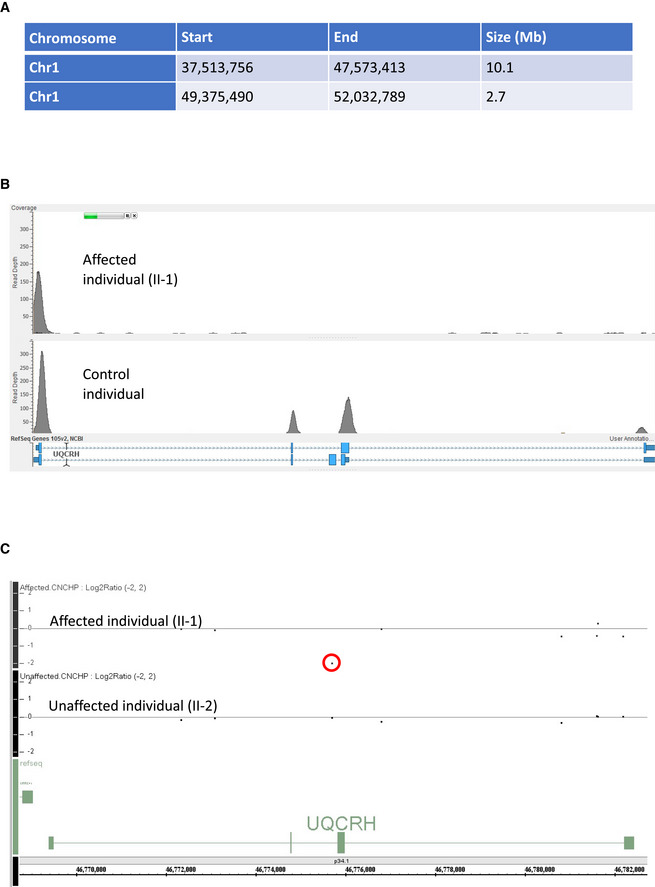
Table detailing the homozygous regions identified in the two affected first cousin individuals.
Read depth image from exome sequence data from the affected individual (II‐1) demonstrating absences of sequence reads encompassing exons 2 and 3 of UQCRH (upper panel) and evidence of sequence reads for both exons in an unrelated control (lower panel).
Log2 ratio SNP microarray results show the absence of signal for a single probe between exons two and three of UQCRH (indicated by a red circle) in an affected individual (II‐1) upper track and evidence of two copies of this probe in their unaffected sibling (II‐2) in the lower track.
- A
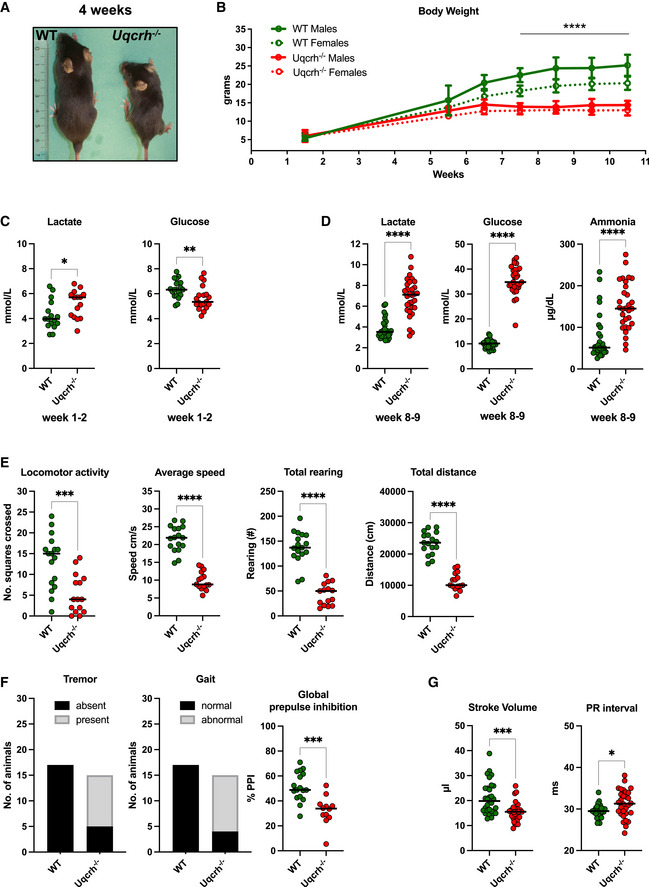
Representative picture of a WT and age‐ and sex‐matched Uqcrh −/− mouse at 4 weeks of age. Scale expressed in centimetres.
- B
Body weight of Uqcrh −/− mice and wild‐type littermates at 1–2 weeks (n = 10 f, 5 m Uqcrh −/− and 8 f, 8 m WT); during the post‐weaning period from 5 to 6 weeks of age (n = 3 m, 7 f Uqcrh −/− and 3 f, 3 m WT); 6–7 weeks of age (n = 28 f, 23 m Uqcrh −/− and 22 f, 23 m WT); 7–8 weeks of age (n = 33 f, 30 m Uqcrh −/− and 45 f, 40 m WT); 8–9 weeks of age (n = 21 f, 25 m Uqcrh −/− and 35 f, 37 m WT); 9–10 weeks of age (n = 45 f, 45 m Uqcrh −/− and 61 f, 66 m WT); 10–11 weeks of age (n = 14 f, 13 m Uqcrh −/− and 21 f, 25 m WT). Data are shown as mean ± SD. ****P < 0.0001, 2‐way ANOVA, from 7.5 weeks of age for Uqcrh −/− males and females versus sex‐matched controls.
- C, D
Clinical chemistry plasma concentrations of parameters related to acid‐base balance (lactate and ammonia) and metabolic state (glucose) n = 15 Uqcrh −/− and 16 WT pups 1–2‐week‐old (C); n = 15 f, 15 m Uqcrh −/− and 15 f,15 m WT mice aged 8–9 weeks (D); sex not differentiated. Data are shown as scatter dot plots with a line at the median. *P < 0.05, **P < 0.01, ****P < 0.0001, Wilcoxon rank‐sum test.
- E, F
Measures related to behaviour and neurological function, data generated by the open‐field test (8 weeks old, E) and SHIRPA (9 weeks old, F), n = 7f, 8m Uqcrh −/− and 8f, 9m WT animals. Prepulse inhibition of the acoustic startle as a parameter associated with sensorimotor gating (10 weeks, E right panel), n = 7 f/5 m Uqcrh −/− and 8 f/ 9 m WT mice. Sex is not differentiated. Data are shown as scatter dot plots with a line representing the median. ***P < 0.001, ****P < 0.0001, Wilcoxon rank‐sum test.
- G
Parameters related to heart function generated by echocardiography (ECHO) and electrocardiography (ECG), n = 15 f, 15 m Uqcrh −/− and 15 f, 15 m WT mice, 6 weeks old.
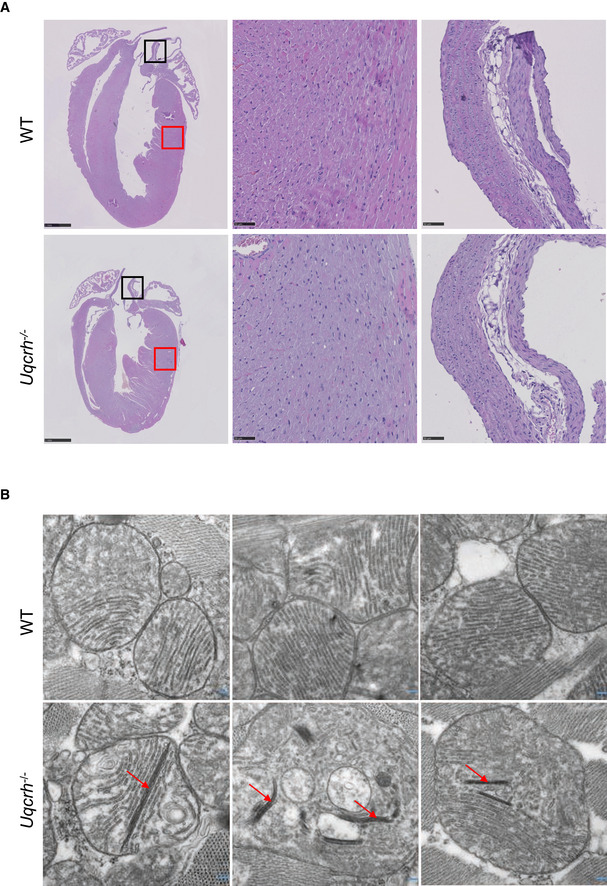
Representative photomicrographs of heart tissue, stained with haematoxylin and eosin, from wild‐type (WT, upper panel) and Uqcrh −/− (lower panel) mice at 9 weeks of age. Normal histopathological structure of the myocardium (red box, central panels) and aorta (black box, right panels) were observed in both groups of mice. Scale bars represent 1 mm in the left panels and 50 μm in the central and right panels.
Electron microscopy images of 3 representative wild‐type (WT, upper panel) and 3 Uqcrh −/− mice (lower panel) heart mitochondria. Mitochondria from Uqcrh−/− mouse heart tissue showed paracrystalline inclusions (arrows). Magnification 1:50,000.
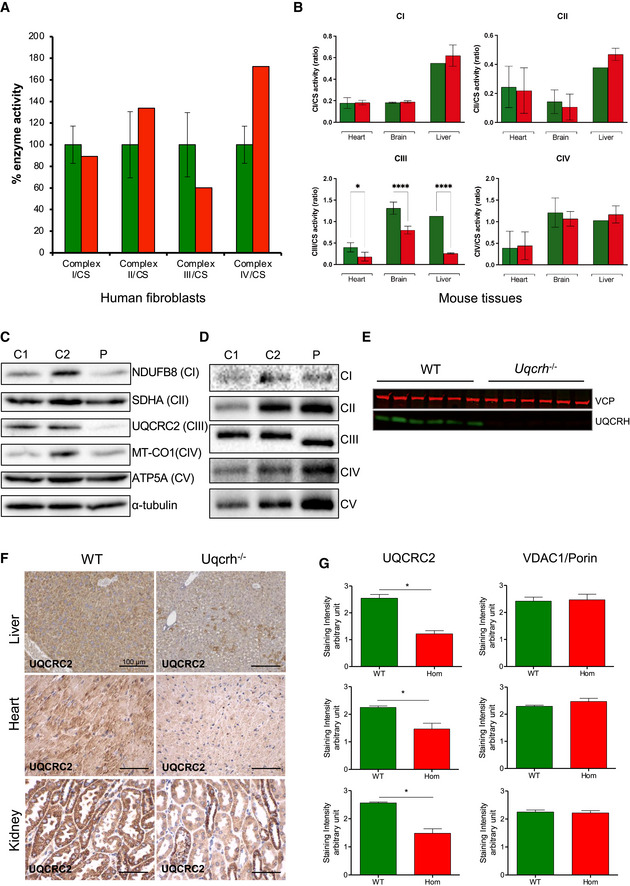
Respiratory chain enzyme activities from human control (green) and patient (red) fibroblasts. Mean activities of controls (n = 8) are set to 100% and error bars represent 1 standard deviation. Data are normalised to citrate synthase (CS) activity.
Respiratory chain enzyme activities in heart, brain and liver, of wild‐type and Uqcrh −/− mice. Data are normalised to citrate synthase (CS) activity. Values are given as mean ± SD, n = 4 WT, 5 Uqcrh −/− (heart), 3 WT, 3 Uqcrh −/− (brain), 1 WT and 2 Uqcrh −/− (Liver). *P < 0.05, ****P < 0.0001, 2‐way ANOVA (multiple comparisons). Data showing CS activity/total protein concentration can be found in Appendix Fig S1A.
Western blot analysis of OXPHOS components in the patient (P) and control (n = 2, C1‐2) fibroblasts.
BN‐PAGE analysis of OXPHOS complex assembly in enriched mitochondria from patient and control fibroblasts (n = 2, C1‐2) solubilised with DDM. Immunoblotting was performed using antibodies to a subunit of each complex (CI [NDUFB8], CII [SDHA], CIII [UQCRC2], CIV [MT‐CO1] and CV [ATP5A]).
Western blot analysis of liver lysates derived from 6 wild‐type (WT) and 6 Uqcrh −/− animals at 4 weeks of age. The upper band (97 kDa) refers to loading control VCP protein; the lower band (11 kDa) indicates UQCRH.
Immunohistochemical staining of UQCRC2 was performed on liver, heart and kidney derived from wild‐type and Uqcrh −/− mice at 9 weeks of age. Staining of VDAC1/porin was also carried out (Appendix Fig S1B).
Graphs indicate score values of immunohistochemical staining intensity of both VDAC1/porin and UQCRC2. Data are given as mean ± SEM. *P < 0.05; n = 3, Student’s t‐test (unpaired samples).
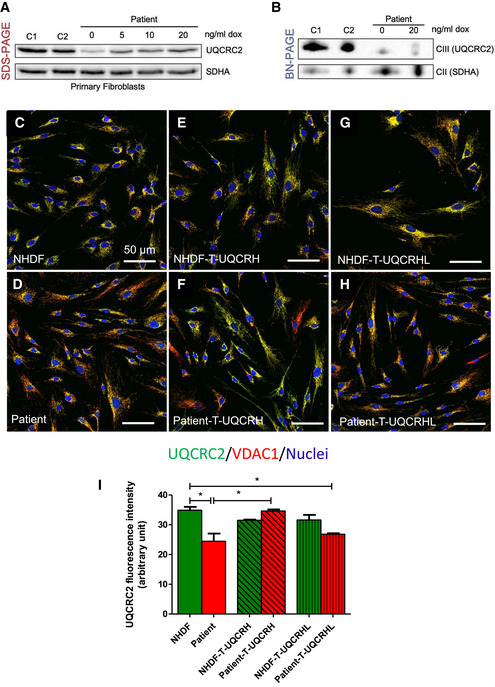
Western blot analysis of control (n = 2, C1‐2) and patient fibroblasts transduced with a lentiviral vector (pLVX) containing wild‐type UQCRH. Expression of wild‐type UQCRH was induced using various concentrations of doxycycline (dox) up to 20 ng/ml for 72 h.
BN‐PAGE analysis of control (n = 2, C1‐2) and patient fibroblasts transduced with a lentiviral vector (pLVX) containing wild‐type UQCRH. Transduced fibroblasts were either uninduced or induced with 20 ng/ml doxycycline (dox) for 72 h.
Immunofluorescence for UQCRC2 (green), VDAC1/porin (red) and nuclei (DAPI, blue), in control (NHDF) fibroblasts.
Immunofluorescence for UQCRC2 (green), VDAC1/porin (red) and nuclei (DAPI, blue), in patient fibroblasts.
Immunofluorescence for UQCRC2 (green), VDAC1/porin (red) and nuclei (DAPI, blue), in control (NHDF) fibroblasts transduced with wild‐type UQCRH.
Immunofluorescence for UQCRC2 (green), VDAC1/porin (red) and nuclei (DAPI, blue), in patient fibroblasts transduced with wild‐type (WT) UQCRH.
Immunofluorescence for UQCRC2 (green), VDAC1/porin (red) and nuclei (DAPI, blue), in control (NHDF) fibroblasts transduced with the pseudogene UQCRHL.
Immunofluorescence for UQCRC2 (green), VDAC1/porin (red) and nuclei (DAPI, blue), in patient fibroblasts transduced with the pseudogene UQCRHL.
Graph indicating the staining intensity of UQCRC2 in control (NHDF) fibroblasts (green) and patient fibroblasts (red), those respective cell lines transduced (T) with wild‐type UQCRH (diagonal lines) and those cell lines transduced with the pseudogene UQCRHL (vertical lines) measured using Image J, Data are given as mean ± SEM. One‐way ANOVA (Kruskal‐Wallis test), *P < 0.05; n = 3 macroscopic field (10–14 cells for macroscopic field were measured).
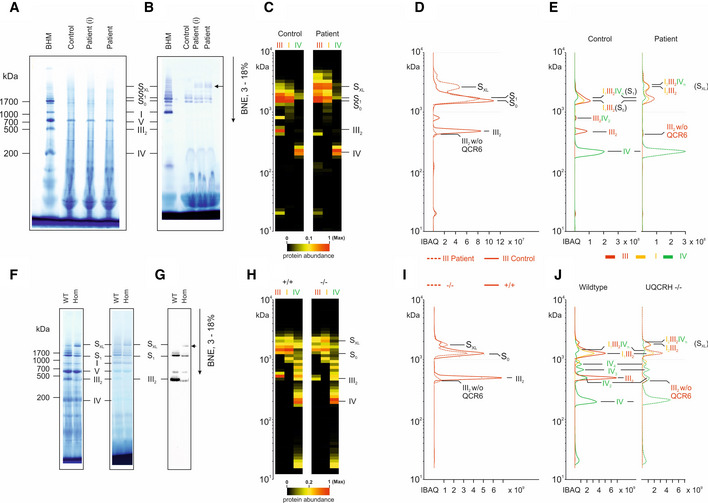
BN‐PAGE gel stained with Coomassie showing molecular weight marker (BHM) and samples from control and patient (primary fibroblasts, (I) = immortalised fibroblasts).
BN‐PAGE gel stained with NADH:NTB reductase activity stain showing molecular weight marker (BHM) and samples from control and patient (primary fibroblasts, (I) = immortalised fibroblasts).
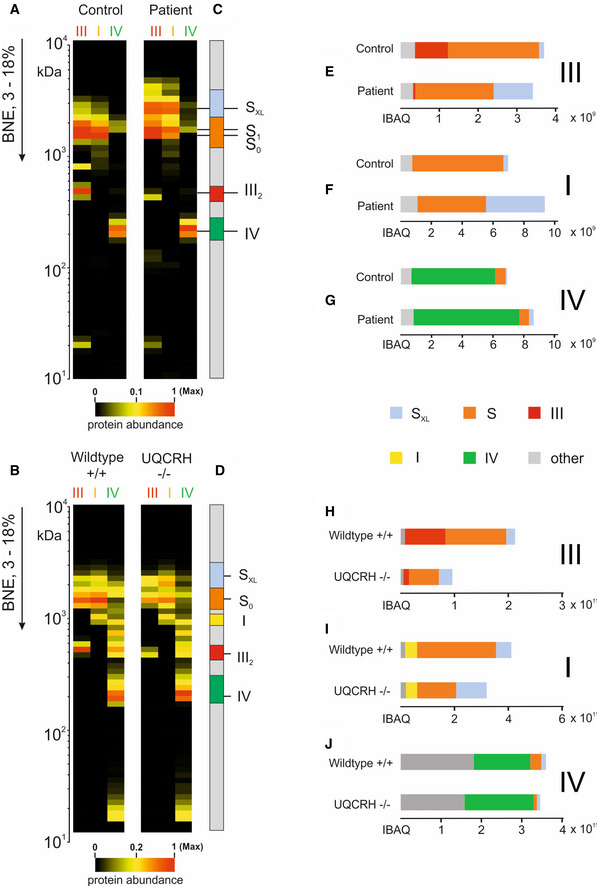
Further complexome analysis of the BN‐PAGE gels shown in A and B. Each native lane was cut into even fractions from high to low molecular mass. Proteins in each slice were digested with trypsin and analysed by quantitative mass spectrometry. Shown here are average IBAQ values of all identified subunits from complexes III, I and IV (full data including all individual subunits shown in Fig EV4).
Profile of complex III (averaged IBAQ values) in the patient (dashed line) and control (solid line) fibroblasts.
Profile of complexes III (red), I (yellow) and IV (green) to visualise and assess supercomplex composition and stability in control (solid lines) and patient (dashed lines) fibroblasts.
BN‐PAGE gel stained with Coomassie (left) and NADH:NTB reductase activity stain (right) showing molecular weight marker (BHM) and heart tissue samples from wild‐type (WT) and Uqcrh −/− mice.
BN‐PAGE and immunoblot using the antibody to CIII subunit UQCRC2 in heart tissue samples from wild‐type (WT) and Uqcrh −/− mice.
Further complexome analysis of the BN‐PAGE gels shown in F, shown here are average IBAQ values of subunits from complexes III, I and IV (full data including all individual subunits shown in Fig EV4).
Profile of complex III (averaged IBAQ values) in wild‐type (+/+, solid line) and Uqcrh −/− (−/−, dashed line) heart tissue.
Profile of complexes III (red), I (yellow) and IV (green) to visualise and assess supercomplex composition and stability in wild‐type (+/+, solid line) and Uqcrh −/− (−/−, dashed line) heart tissue.
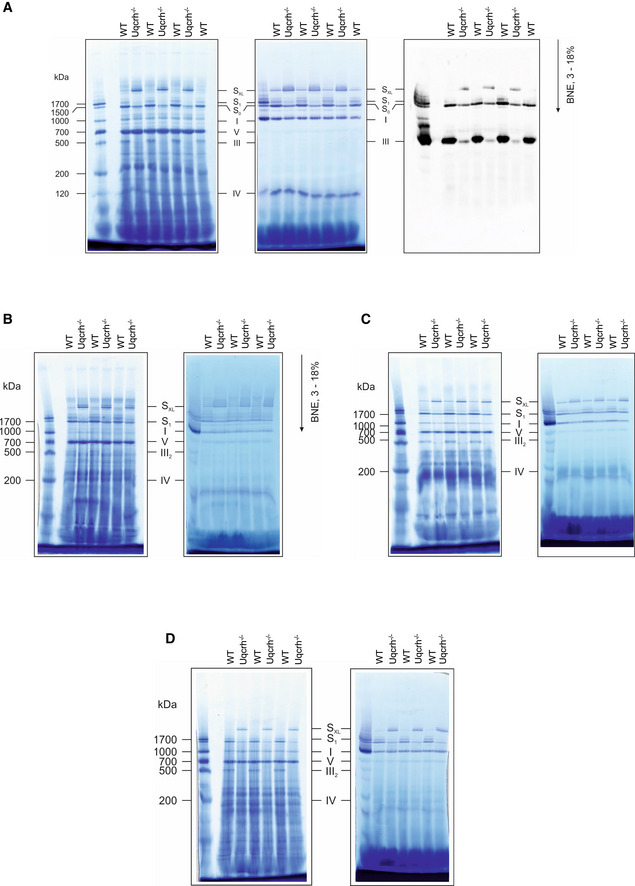
Mitochondrial membranes from kidney samples of wild‐type (WT) and Uqcrh −/− mice were solubilised with digitonin and separated on native gradient gels. Protein complexes were stained with Coomassie (left panel) with NADH:NTB reductase activity stain (centre panel) and with an antibody against Core II subunit of complex III (Uqcrc2, right panel).
Mitochondrial membranes from brain samples of wild‐type (WT) and Uqcrh −/− mice were solubilised with digitonin and separated on native gradient gels. Protein complexes were stained with Coomassie (left panel) with NADH:NTB reductase activity stain (right panel).
Mitochondrial membranes from skeletal muscle samples of wild‐type (WT) and Uqcrh −/− mice were solubilised with digitonin and separated on native gradient gels. Protein complexes were stained with Coomassie (left panel) with NADH:NTB reductase activity stain (right panel).
Mitochondrial membranes from liver samples of wild‐type (WT) and Uqcrh −/− mice were solubilised with digitonin and separated on native gradient gels. Protein complexes were stained with Coomassie (left panel) with NADH:NTB reductase activity stain (right panel).
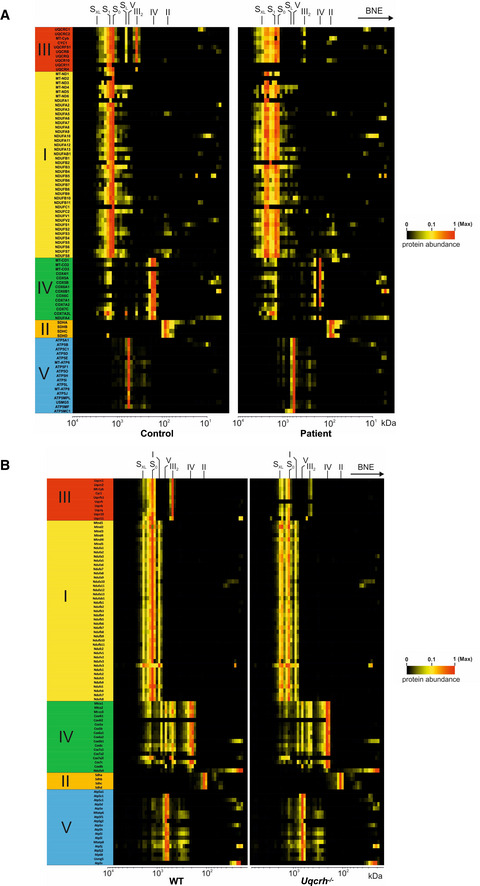
Mitochondrial membranes of control and patient fibroblasts were solubilised with digitonin and separated on native gradient gels. Each native lane was cut into even fractions from high to low molecular mass. Proteins in each slice were digested with trypsin and analysed by quantitative mass spectrometry.
Mitochondrial membranes of heart from wild‐type and Uqcrh −/− deficient mice were solubilised with digitonin and separated on native gradient gels. Each native lane was cut into even fractions from high to low molecular mass. Proteins in each slice were digested with trypsin and analysed by quantitative mass spectrometry.
- A, B
The average of IBAQ values of all identified subunits from complexes III, I and IV (full data including all individual subunits shown in Fig EV4).
- C, D
Molecular mass region used to quantify the appearance of individual and supercomplexes.
- E, H
Sum of all IBAQ values and relative distribution of complex III as individual dimer or assembled into supercomplexes and large supercomplexes.
- F, I
Sum of all IBAQ values and relative distribution of complex I as individual or assembled into supercomplexes and large supercomplexes.
- G, J
Sum of all IBAQ values and relative distribution of complex IV as individual or assembled into supercomplexes.
References
-
- Andreu AL, Hanna MG, Reichmann H, Bruno C, Penn AS, Tanji K, Pallotti F, Iwata S, Bonilla E, Lach B et al (1999) Exercise intolerance due to mutations in the cytochrome b gene of mitochondrial DNA. N Engl J Med 341: 1037–1044 - PubMed
Publication types
MeSH terms
Substances
Grants and funding
LinkOut - more resources
Full Text Sources
Medical
Molecular Biology Databases
