. 2021 Dec 21;2(12):100456.
doi: 10.1016/j.xcrm.2021.100456. Epub 2021 Nov 4.

SARS-CoV-2 can infect and propagate in human placenta explants

Affiliations

SARS-CoV-2 can infect and propagate in human placenta explants

Amal Fahmi et al. Cell Rep Med. .

Abstract

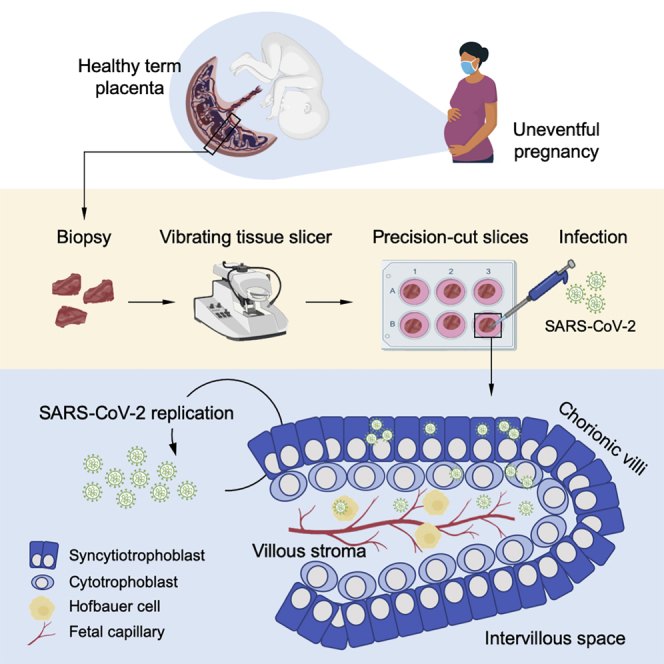
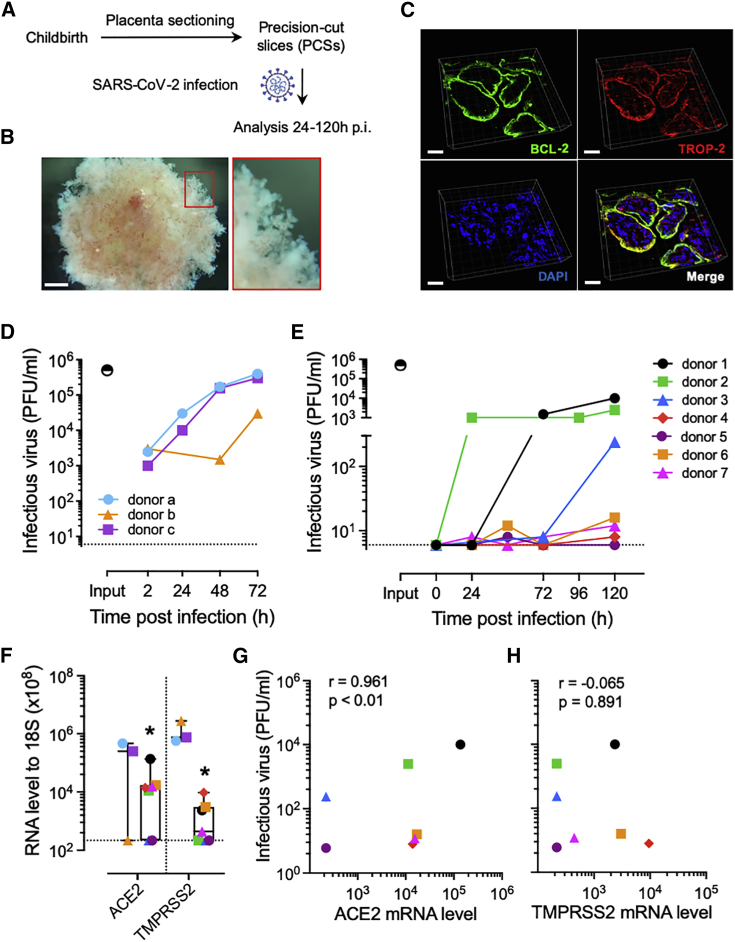
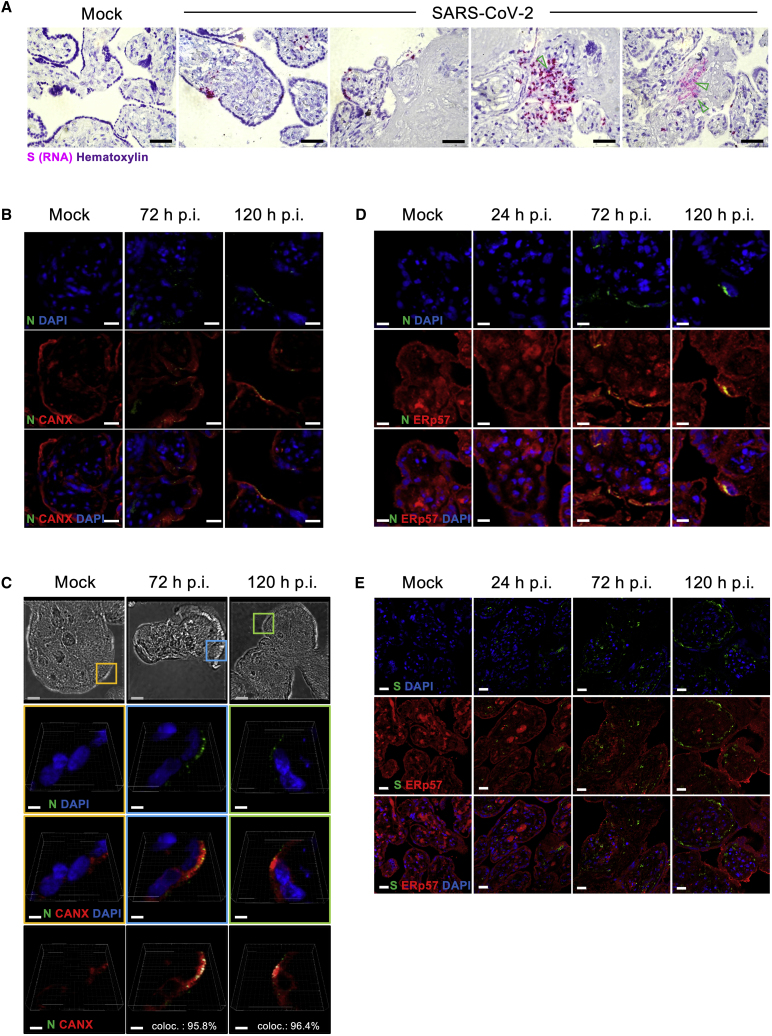
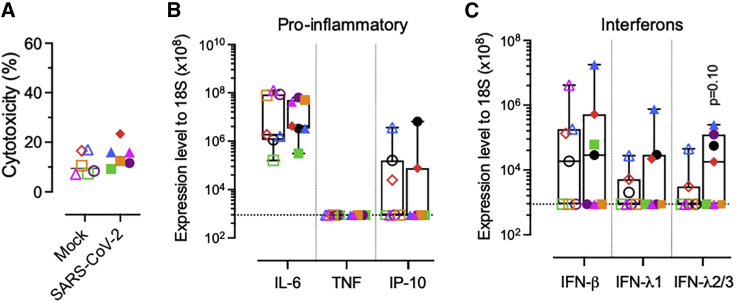
The ongoing SARS-CoV-2 pandemic continues to lead to high morbidity and mortality. During pregnancy, severe maternal and neonatal outcomes and placental pathological changes have been described. We evaluate SARS-CoV-2 infection at the maternal-fetal interface using precision-cut slices (PCSs) of human placenta. Remarkably, exposure of placenta PCSs to SARS-CoV-2 leads to a full replication cycle with infectious virus release. Moreover, the susceptibility of placental tissue to SARS-CoV-2 replication relates to the expression levels of ACE2. Viral proteins and/or viral RNA are detected in syncytiotrophoblasts, cytotrophoblasts, villous stroma, and possibly Hofbauer cells. While SARS-CoV-2 infection of placenta PCSs does not cause a detectable cytotoxicity or a pro-inflammatory cytokine response, an upregulation of one order of magnitude of interferon type III transcripts is measured. In conclusion, our data demonstrate the capacity of SARS-CoV-2 to infect and propagate in human placenta and constitute a basis for further investigation of SARS-CoV-2 biology at the maternal-fetal interface.

Keywords: COVID-19; SARS-CoV-2; coronavirus; pandemic; placenta; pregnancy; vertical transmission.


Conflict of interest statement

The authors declare no competing interests.

Figures

None
Graphical abstract
Figure 1
Figure 1
SARS-CoV-2 is propagating in human placenta PCSs (A) Placenta PCSs were prepared as slices of 500–700 μm and challenged with SARS-CoV-2 at a rate of 5 × 105 PFU per slice and analyzed 24–120 h p.i. (B) Representative stereomicroscopic image showing a preserved villous microstructure of placenta PCSs after 120 h of culture. Scale bar, 500 μm. (C) Representative 3D rendering micrograph of the syncytiotrophoblast (BLC-2, green) and trophoblast (TROP-2, red) layers in placenta PCS cultures. DAPI (blue). Scale bar, 30 μm. (D) WD-NECs were infected apically with 5 × 104 PFU per insert. The infectious virus release was evaluated in apical washes 24 to 72 h p.i. Each symbol represents an individual donor (n = 3). The input indicates the virus titer adjusted to the volume of inoculum and the horizontal dashed line indicates the baseline measured in mock controls and defined as the detection limit of the PFU assay. (E) Shedding of infectious virus over time by placenta PCSs exposed to 5 × 105 PFU of SARS-CoV-2. Each symbol represents an individual donor (n = 7). The input indicates the virus titer adjusted to the volume of inoculum and the horizontal dashed line indicates the baseline in mock controls and defined as the detection limit of the PFU assay. (F) ACE2 and TMPRSS2 mRNA expression levels in non-infected WD-NECs and placenta PCS cultures. Boxplots indicate the median value (centerline) and interquartile ranges (box edges), with whiskers extending to the lowest and the highest values. Each symbol represents an individual donor (n = 3 and n = 7, respectively). (G and H) Correlation of SARS-CoV-2 titers 120 h p.i. of placenta PCSs and ACE2 (G) and TMPRSS2 (H) mRNA levels. Associations were tested using the Spearman rank correlation test. Each symbol represents an individual donor (n = 7).
Figure 2
Figure 2
Subcellular localization of SARS-CoV-2 RNA and proteins in infected human placenta PCSs (A) Representative in situ hybridization micrographs of the RNA of SARS-CoV-2 S protein (pink) in cross-sections of placenta PCSs infected with 5 × 105 PFU of SARS-CoV-2. The green arrows indicate S protein RNA+ cells compatible with Hofbauer cell morphology. The sections were counterstained with hematoxylin. Scale bar, 200 μm. (B) Representative illustrations of mock- and SARS-CoV-2 infected placenta PCSs analyzed 72 and 120 h p.i. DAPI (blue) SARS-CoV-2 N protein (green) and CANX (red). Scale bar, 10 μm. (C) High-resolution 3-dimensional (3D) stacks. Upper panels: bright-field images showing the microstructure of human placenta villi. The colored squares represent the zoomed area depicted in the lower panels, which are representative illustrations of syncytiotrophoblasts, expressing CANX (red) and SARS-CoV-2 N protein (green). In the lower panel, the white signal indicates SARS-CoV-2 N protein and CANX co-localization. The percentages of SARS-CoV-2 N protein signal co-localizing with CANX signal are indicated (coloc.). Blue scale bar, 10 μm; white scale bar, 2 μm. (D) Representative illustrations of mock- and SARS-CoV-2-infected placenta PCSs analyzed 24, 72, and 120 h p.i. DAPI (blue) SARS-CoV-2 N protein (green) and ERp57 (red). Scale bar, 5 μm. (E) Representative illustrations of mock- and SARS-CoV-2-infected placenta PCSs analyzed 24, 72, and 120 h p.i. DAPI (blue) SARS-CoV-2 S protein (green) and ERp57 (red). Scale bar, 20 μm.
Figure 3
Figure 3
Human placenta PCS responses following SARS-CoV-2 infection (A) LDH release in placenta PCSs exposed to 5 × 105 PFU of SARS-CoV-2 120 h p.i. Each symbol represents an individual donor (n = 6). (B and C) Induction of pro-inflammatory cytokines (interleukin-6 [IL-6], tumor necrosis factor [TNF], and interferon [IFN]-γ-induced protein 10 kDa/C-X-C motif chemokine ligand 10 [IP-10/CXCL10]) (B), and (C) IFN (β, λs) transcripts in placenta PCSs 120 h p.i. with mock (empty symbols) or 5 × 105 PFU of SARS-CoV-2 (solid symbols). Boxplots indicate the median value (centerline) and interquartile ranges (box edges), with whiskers extending to the lowest and the highest values. Each symbol represents an individual donor (n = 7). A 2-sided unpaired t test was applied to compare infected to mock control groups.

References

    1. Hou Y.J., Okuda K., Edwards C.E., Martinez D.R., Asakura T., Dinnon K.H., 3rd, Kato T., Lee R.E., Yount B.L., Mascenik T.M., et al. SARS-CoV-2 Reverse Genetics Reveals a Variable Infection Gradient in the Respiratory Tract. Cell. 2020;182:429–446.e14. - PMC - PubMed
    1. Weatherbee B.A.T., Glover D.M., Zernicka-Goetz M. Expression of SARS-CoV-2 receptor ACE2 and the protease TMPRSS2 suggests susceptibility of the human embryo in the first trimester. Open Biol. 2020;10:200162. - PMC - PubMed
    1. Cui D., Liu Y., Jiang X., Ding C., Poon L.C., Wang H., Yang H. Single-cell RNA expression profiling of SARS-CoV-2-related ACE2 and TMPRSS2 in human trophectoderm and placenta. Ultrasound Obstet. Gynecol. 2021;57:248–256. - PMC - PubMed
    1. Hikmet F., Méar L., Edvinsson Å., Micke P., Uhlén M., Lindskog C. The protein expression profile of ACE2 in human tissues. Mol. Syst. Biol. 2020;16:e9610. - PMC - PubMed
    1. Li M., Chen L., Zhang J., Xiong C., Li X. The SARS-CoV-2 receptor ACE2 expression of maternal-fetal interface and fetal organs by single-cell transcriptome study. PLoS ONE. 2020;15:e0230295. - PMC - PubMed

Publication types

MeSH terms