. 2022 Feb;302(2):380-389.
doi: 10.1148/radiol.2021210591. Epub 2021 Nov 9.

An Image Quality-informed Framework for CT Characterization

Affiliations

An Image Quality-informed Framework for CT Characterization

Rebecca Smith-Bindman et al. Radiology. 2022 Feb.

Abstract

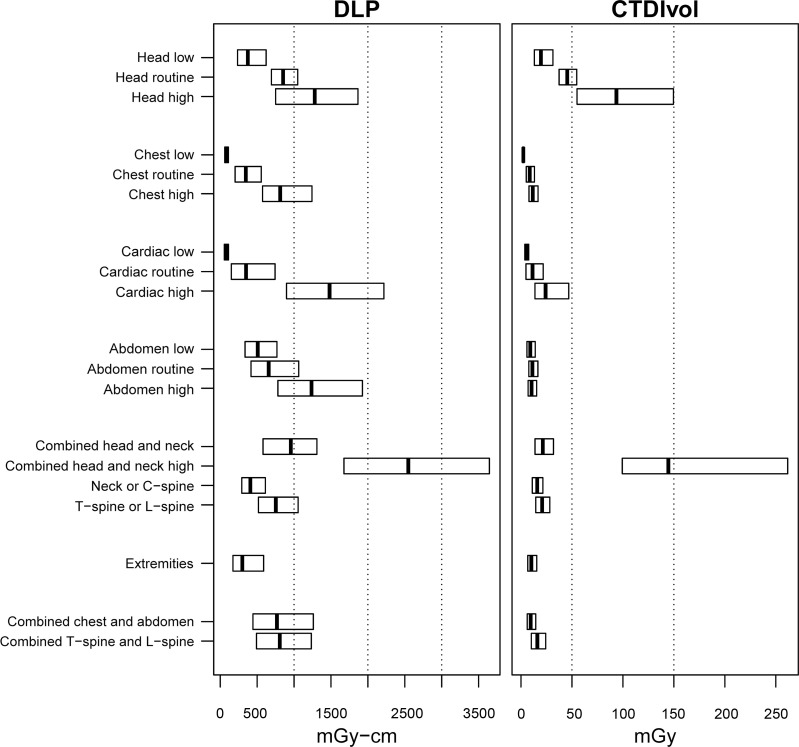
Background Lack of standardization in CT protocol choice contributes to radiation dose variation. Purpose To create a framework to assess radiation doses within broad CT categories defined according to body region and clinical imaging indication and to cluster indications according to the dose required for sufficient image quality. Materials and Methods This was a retrospective study using Digital Imaging and Communications in Medicine metadata. CT examinations in adults from January 1, 2016 to December 31, 2019 from the University of California San Francisco International CT Dose Registry were grouped into 19 categories according to body region and required radiation dose levels. Five body regions had a single dose range (ie, extremities, neck, thoracolumbar spine, combined chest and abdomen, and combined thoracolumbar spine). Five additional regions were subdivided according to dose. Head, chest, cardiac, and abdomen each had low, routine, and high dose categories; combined head and neck had routine and high dose categories. For each category, the median and 75th percentile (ie, diagnostic reference level [DRL]) were determined for dose-length product, and the variation in dose within categories versus across categories was calculated and compared using an analysis of variance. Relative median and DRL (95% CI) doses comparing high dose versus low dose categories were calculated. Results Among 4.5 million examinations, the median and DRL doses varied approximately 10 times between categories compared with between indications within categories. For head, chest, abdomen, and cardiac (3 266 546 examinations [72%]), the relative median doses were higher in examinations assigned to the high dose categories than in examinations assigned to the low dose categories, suggesting the assignment of indications to the broad categories is valid (head, 3.4-fold higher [95% CI: 3.4, 3.5]; chest, 9.6 [95% CI: 9.3, 10.0]; abdomen, 2.4 [95% CI: 2.4, 2.5]; and cardiac, 18.1 [95% CI: 17.7, 18.6]). Results were similar for DRL doses (all P < .001). Conclusion Broad categories based on image quality requirements are a suitable framework for simplifying radiation dose assessment, according to expected variation between and within categories. © RSNA, 2021 See also the editorial by Mahesh in this issue.


Conflict of interest statement

Disclosures of Conflicts of Interest: R.S.B. Founder of Alara Imaging. S.Y. No relevant relationships. Y.W. No relevant relationships. M.D.K. Chair of the board of directors for the Society for Imaging Informatics in Medicine; consultant for Alara Imaging; payment for lectures, including service on speakers bureaus, from Gilead, Honor Health, and SGCR Wires; stock/stock options in Alara Imaging; reimbursement from RSNA, Society for Imaging Informatics in Medicine, DyPatil, and Honor Health for travel, accommodations, and meeting expenses. P.C. No relevant relationships. R.C. Consultant for United Nations Population Division; employee of University of California Berkeley; payment for development of educational presentations from Haute Etudes en Demographie. J.L. No relevant relationships. D.B. No relevant relationships. C.S. No relevant relationships. B.B. No relevant relationships. A.A.C. No relevant relationships. B.D. No relevant relationships. A.J.E. Consultant for W.L. Gore and Associates; grants/grants pending with GE Healthcare and W.L. Gore and Associates; payment for lectures, including service on speakers bureaus, from Ponteix. M.F. No relevant relationships. P.R. No relevant relationships. J.A.S. Employee of University of California Davis; royalties for Essential Physics of Medical Imaging (fourth edition). A.C.W. Stock/stock options in Bot Image. A.B. Stock/stock options in Alara Imaging.

Figures

None
Graphical abstract
Box plots show distribution of dose-length product (DLP) and volume CT
dose index (CTDIvol) for each CT category. Box edges indicate 25th and 75th
percentiles. Thick vertical line indicates median. C = cervical, L = lumbar,
T = thoracic.
Figure 1:
Box plots show distribution of dose-length product (DLP) and volume CT dose index (CTDIvol) for each CT category. Box edges indicate 25th and 75th percentiles. Thick vertical line indicates median. C = cervical, L = lumbar, T = thoracic.
Graphs show volume CT dose index (CTDIvol) and dose-length product
(DLP) for each indication that comprises (A) head, (B) chest, (C) abdomen,
and (D) cardiac CT categories. Length of arms in cross show interquartile
range in radiation dose. Intersection of arms is median for CTDIvol and DLP,
number of lines reflects number of indications in category, and line
thickness is proportional to number of examinations in category. For each
indication, CTDIvol is defined as mean CTDIvol across all irradiating events
weighted by scanning length, and DLP value is summation across all
irradiating events. For example, in three-phase study, where each phase (ie,
irradiating event) had average CTDIvol of 10 mGy, scanning length of 50 cm,
and DLP of 500 mGy · cm, study would be shown in plot as average
weighted CTDIvol of 10 mGy and total DLP of 1500 mGy · cm.
Figure 2:
Graphs show volume CT dose index (CTDIvol) and dose-length product (DLP) for each indication that comprises (A) head, (B) chest, (C) abdomen, and (D) cardiac CT categories. Length of arms in cross show interquartile range in radiation dose. Intersection of arms is median for CTDIvol and DLP, number of lines reflects number of indications in category, and line thickness is proportional to number of examinations in category. For each indication, CTDIvol is defined as mean CTDIvol across all irradiating events weighted by scanning length, and DLP value is summation across all irradiating events. For example, in three-phase study, where each phase (ie, irradiating event) had average CTDIvol of 10 mGy, scanning length of 50 cm, and DLP of 500 mGy · cm, study would be shown in plot as average weighted CTDIvol of 10 mGy and total DLP of 1500 mGy · cm.

Comment in

References

    1. Kanal KM , Butler PF , Sengupta D , Bhargavan-Chatfield M , Coombs LP , Morin RLUS . U.S Diagnostic Reference Levels and Achievable Doses for 10 Adult CT Examinations . Radiology 2017. ; 284 ( 1 ): 120 – 133 . - PubMed
    1. Smith-Bindman R , Wang Y , Chu P , et al. . International variation in radiation dose for computed tomography examinations: prospective cohort study . BMJ 2019. ; 364 k4931 . - PMC - PubMed
    1. Guite KM , Hinshaw JL , Ranallo FN , Lindstrom MJ , Lee FT Jr . Ionizing radiation in abdominal CT: unindicated multiphase scans are an important source of medically unnecessary exposure . J Am Coll Radiol 2011. ; 8 ( 11 ): 756 – 761 . - PMC - PubMed
    1. Szczykutowicz TP . The CT Handbook: Optimizing Protocols for Today’s Feature-Rich Scanners . Madison, Wis: : MMP Medical Physics Publishing, 2020. .
    1. Szczykutowicz TP , Bour RK , Rubert N , Wendt G , Pozniak M , Ranallo FN . CT protocol management: simplifying the process by using a master protocol concept . J Appl Clin Med Phys 2015. ; 16 ( 4 ): 228 – 243 . - PMC - PubMed

Publication types