. 2021 Nov 9;14(708):eabe5380.
doi: 10.1126/scisignal.abe5380. Epub 2021 Nov 9.

Dynamic variability in SHP-1 abundance determines natural killer cell responsiveness

Affiliations

Dynamic variability in SHP-1 abundance determines natural killer cell responsiveness

Zeguang Wu et al. Sci Signal. .

Abstract

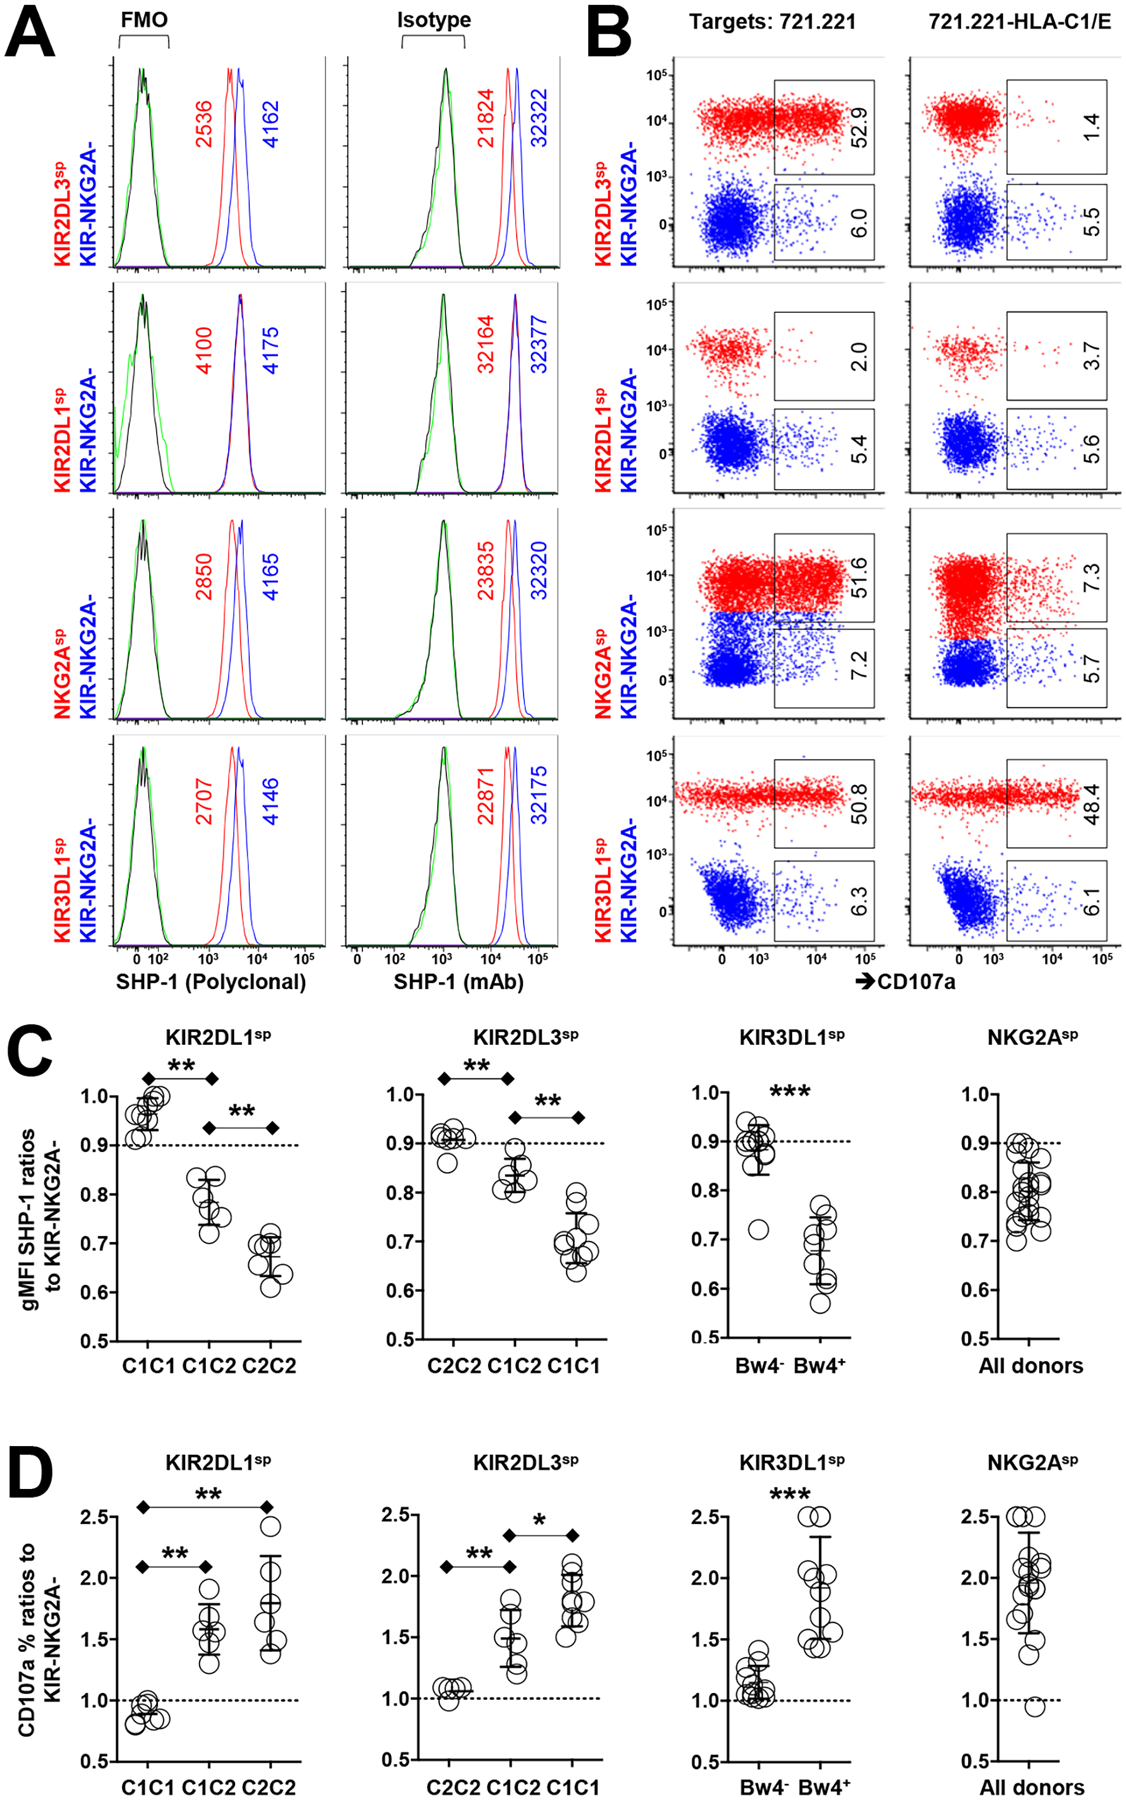
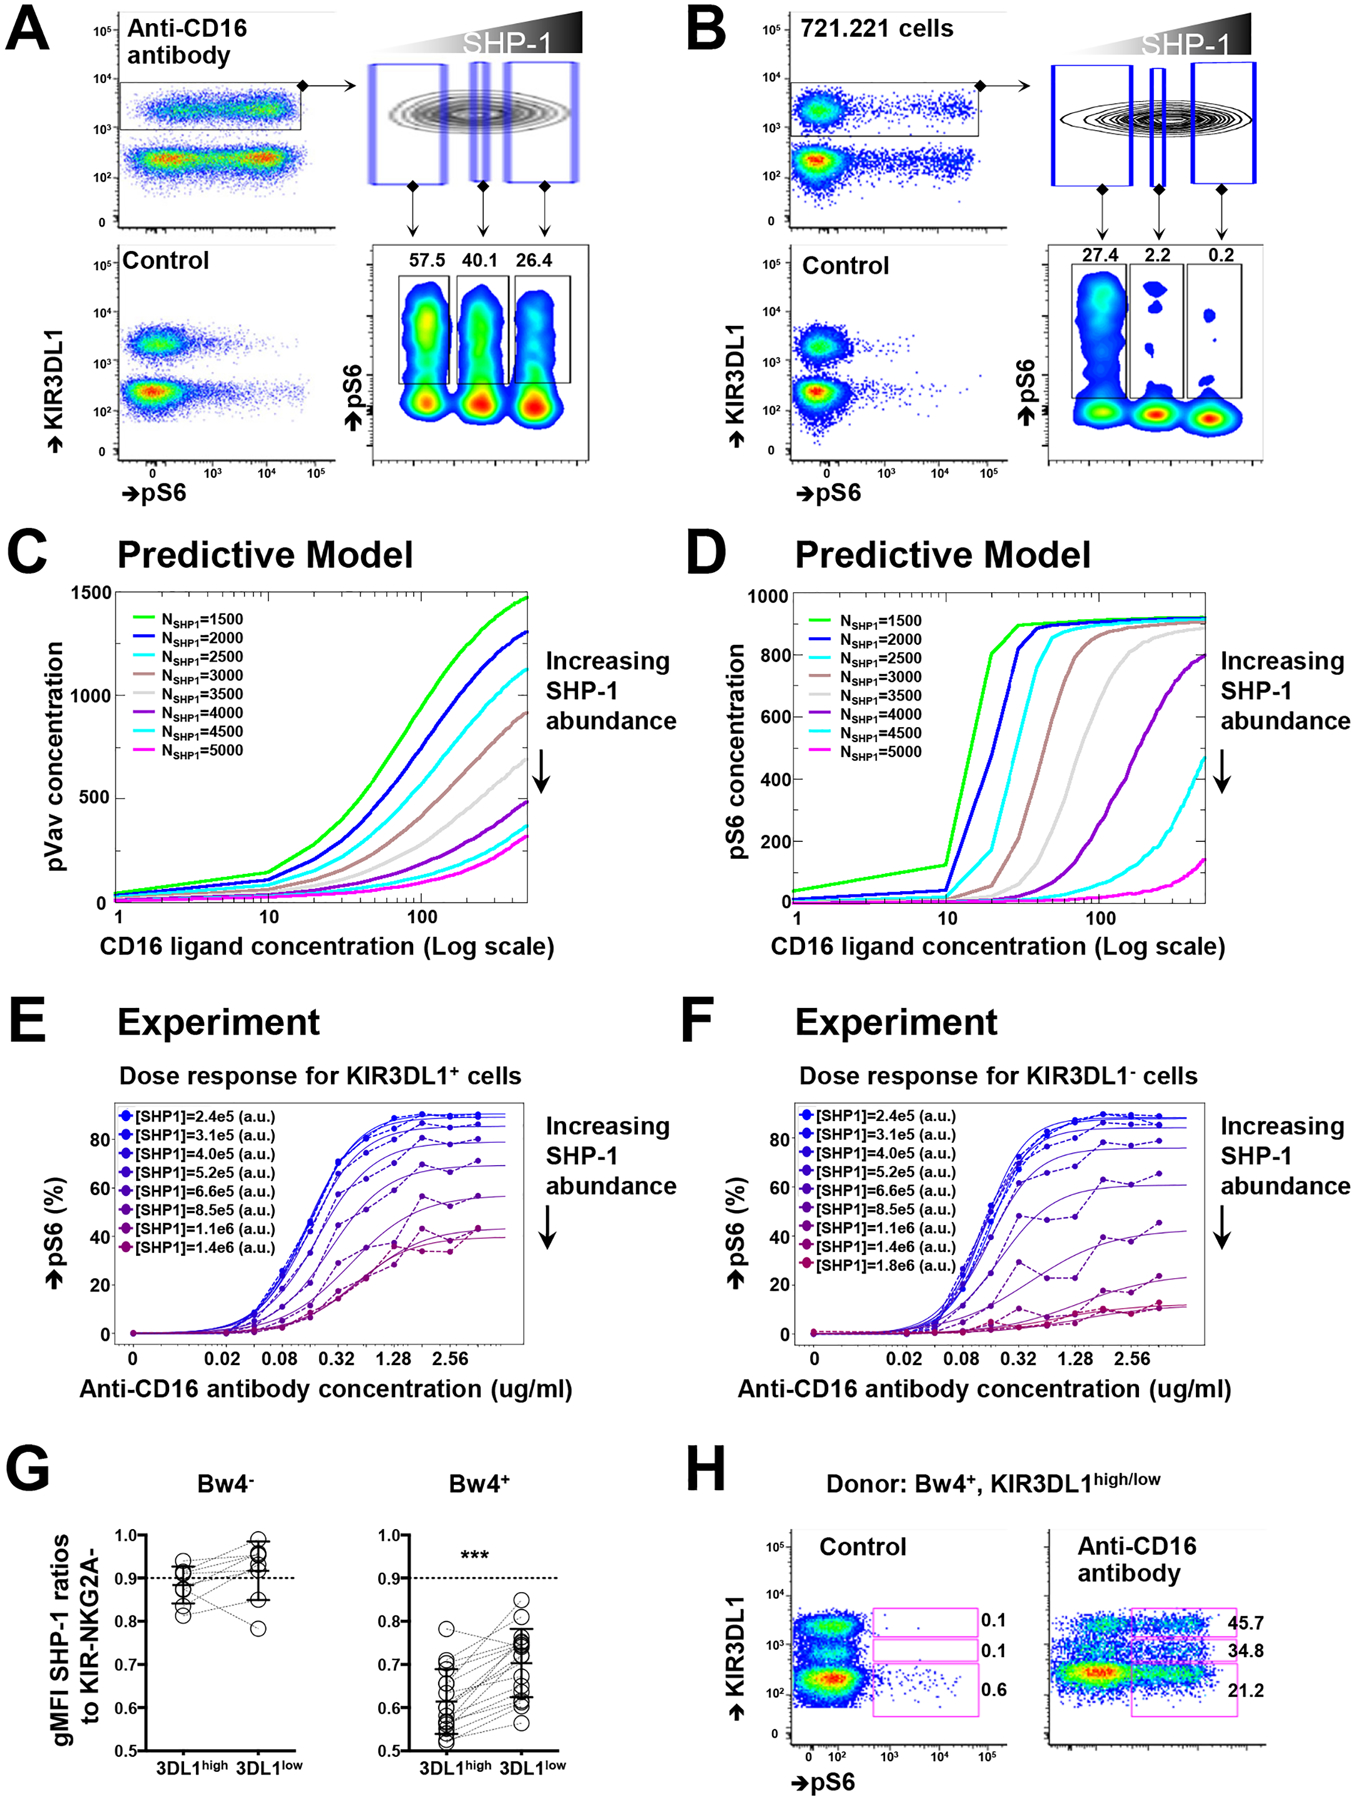
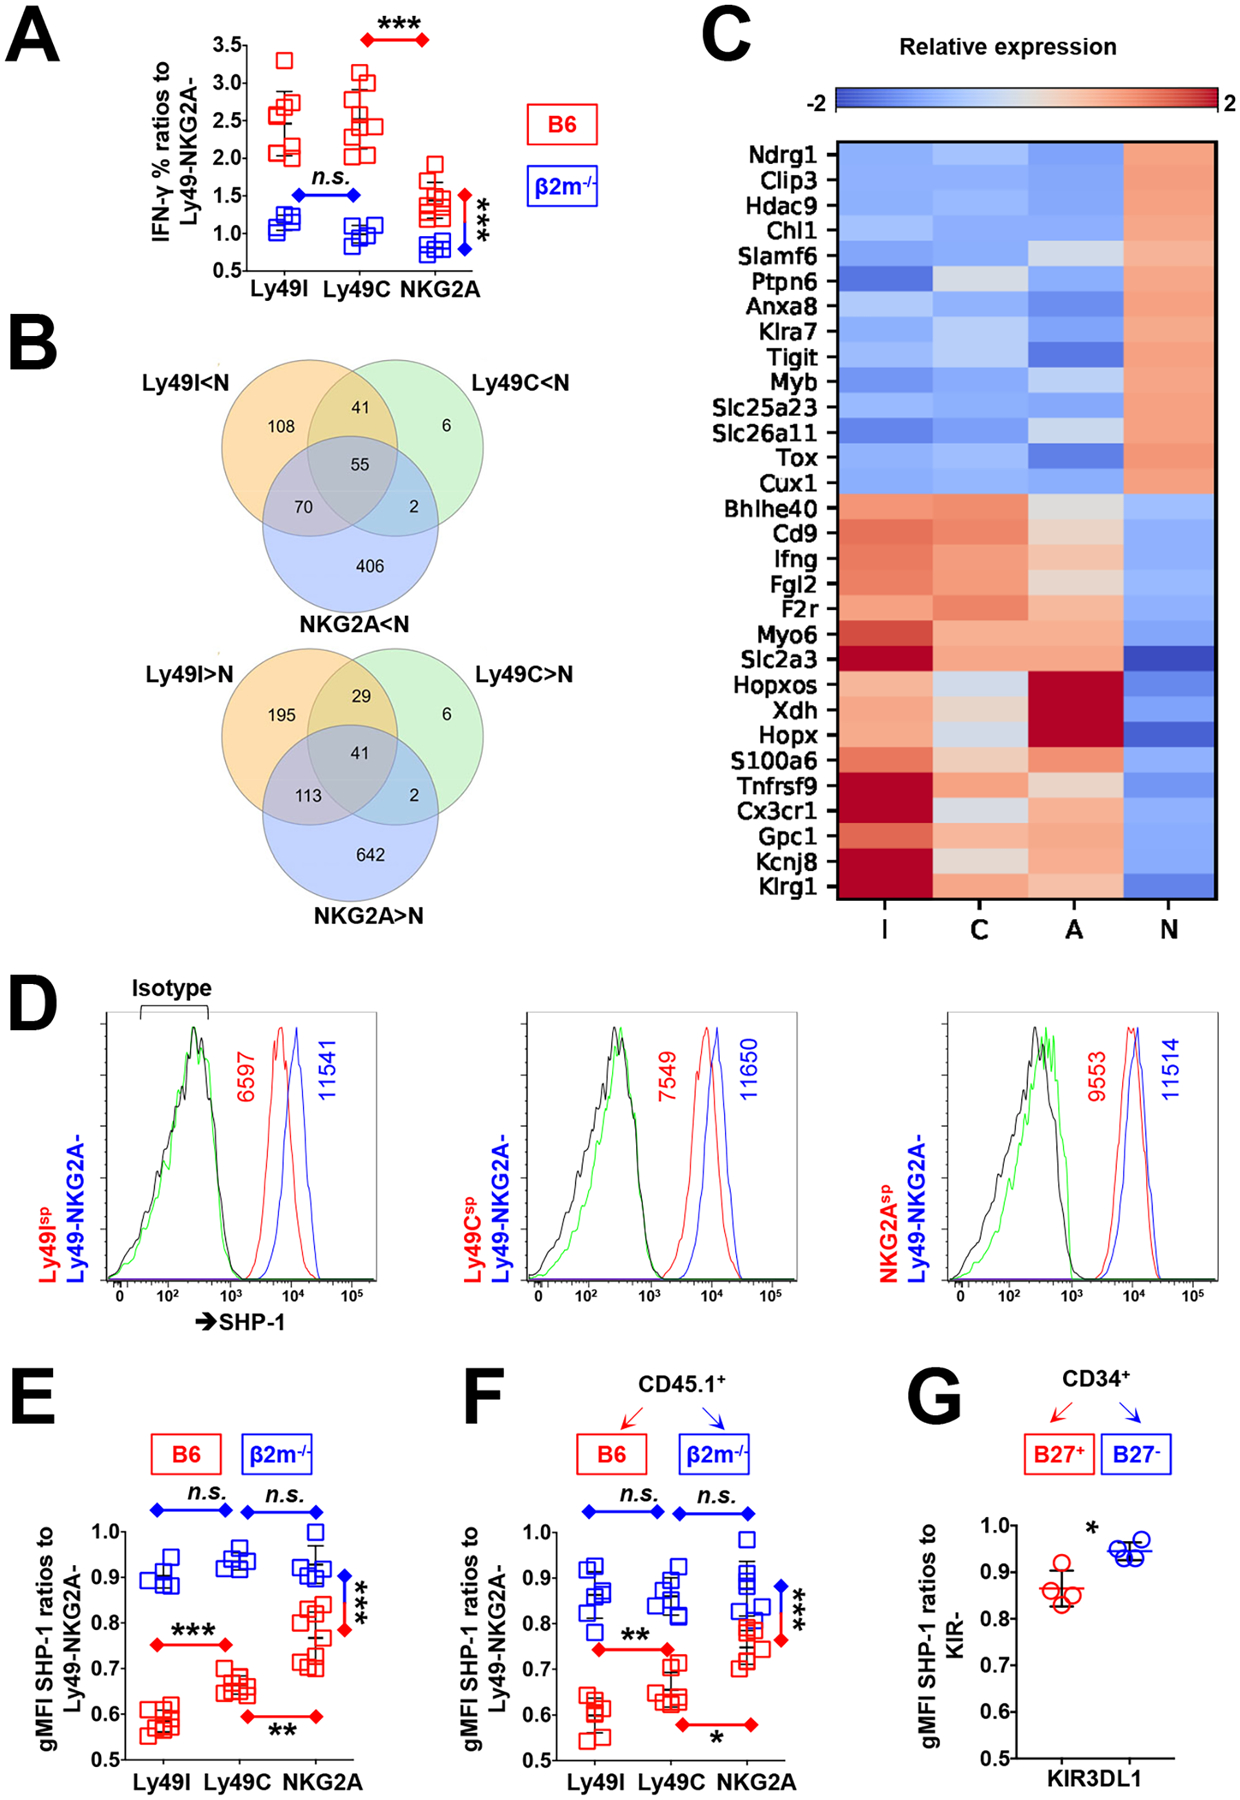
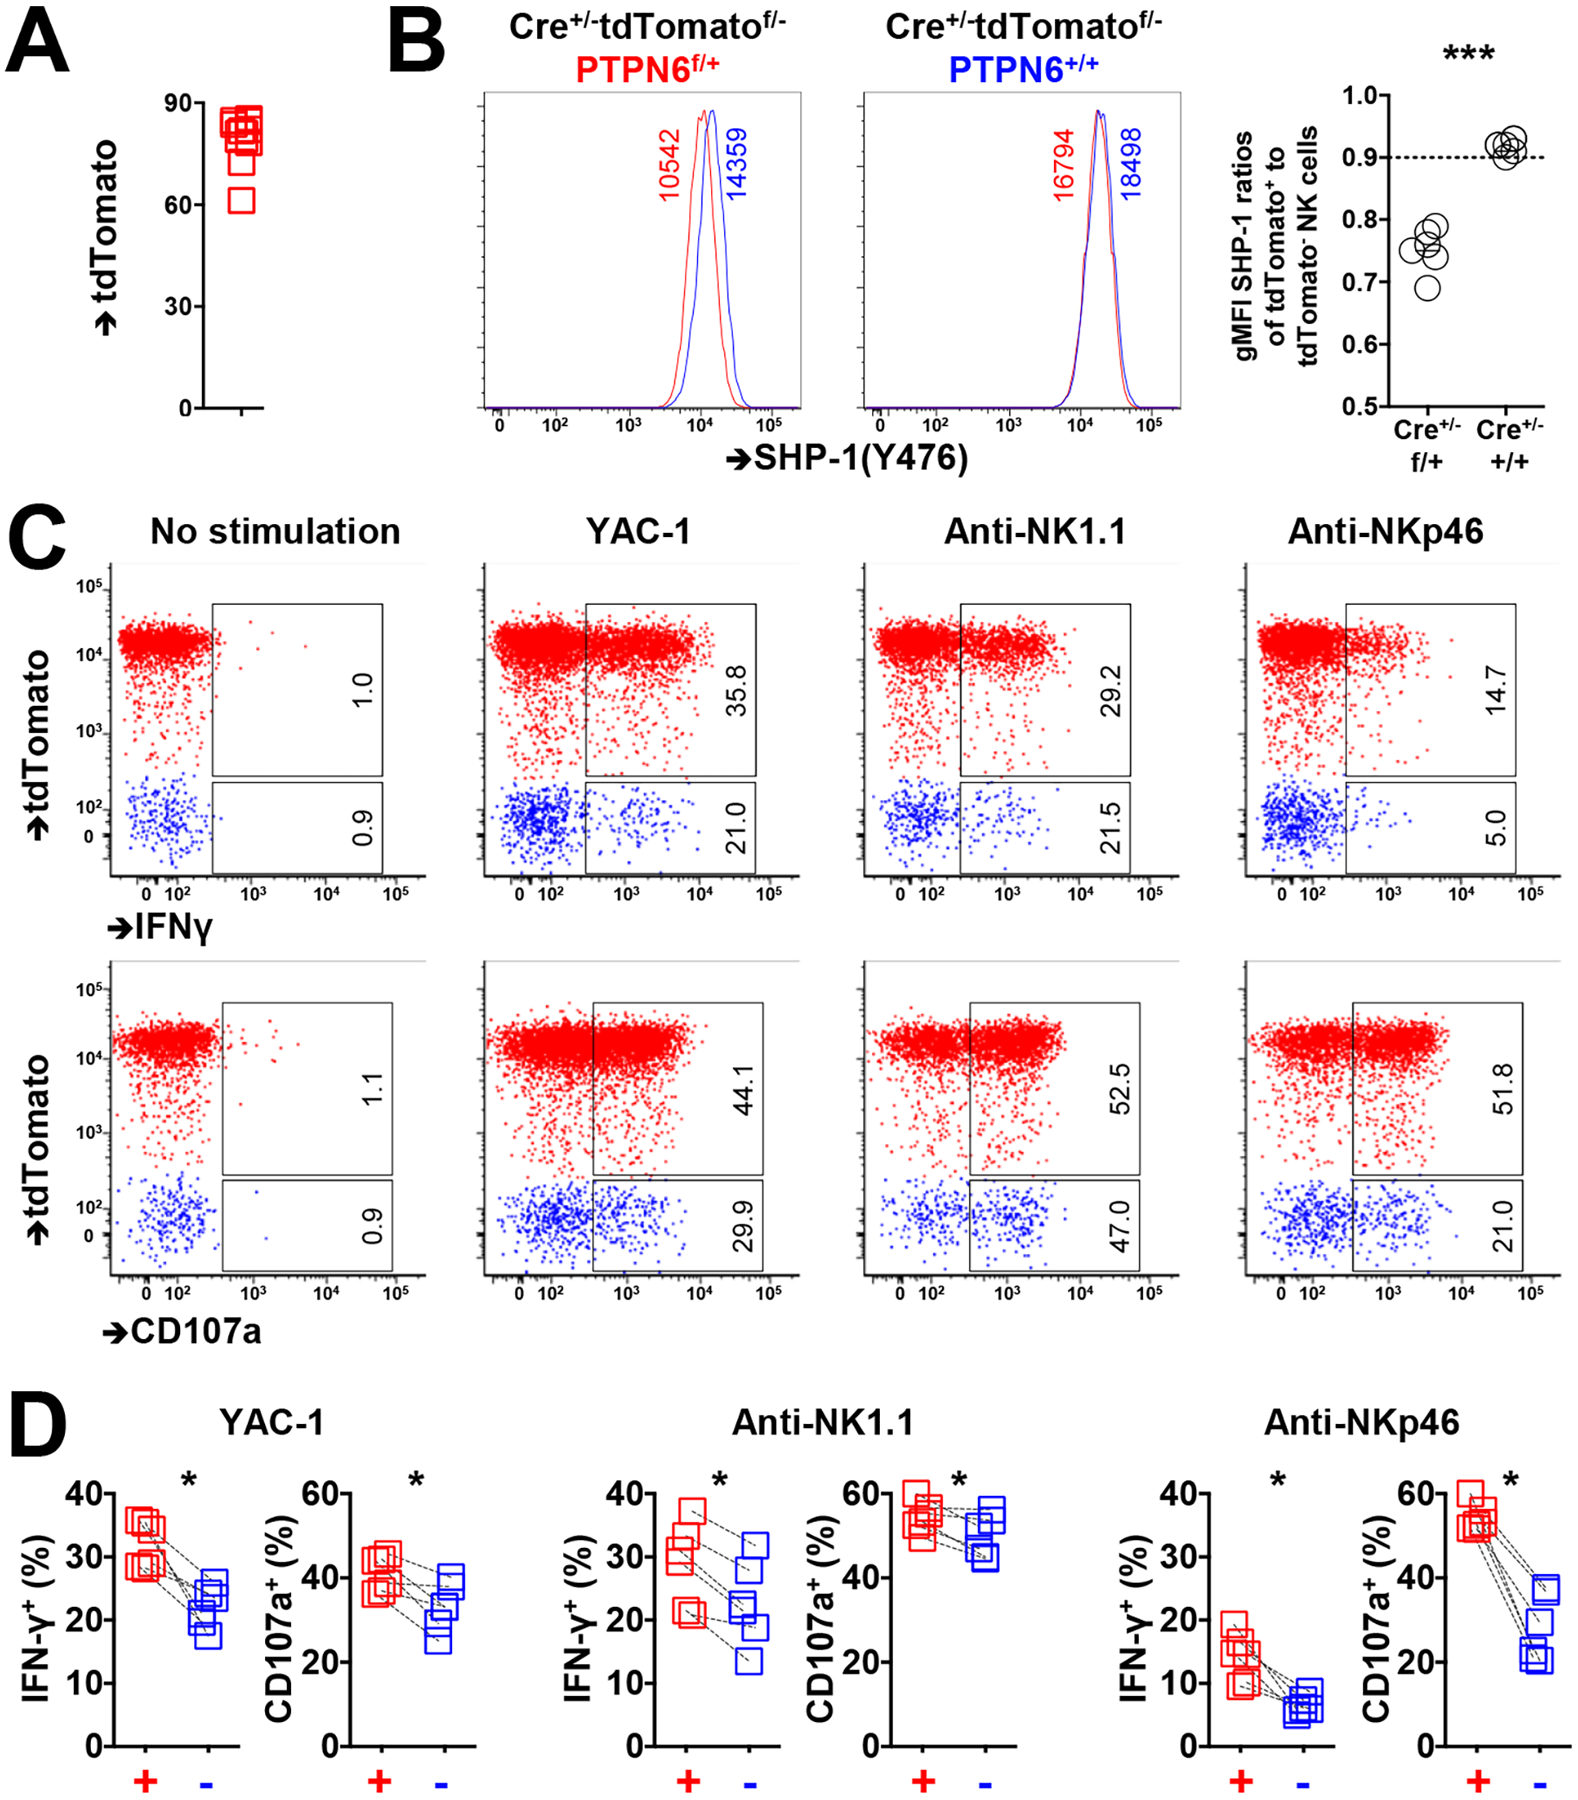
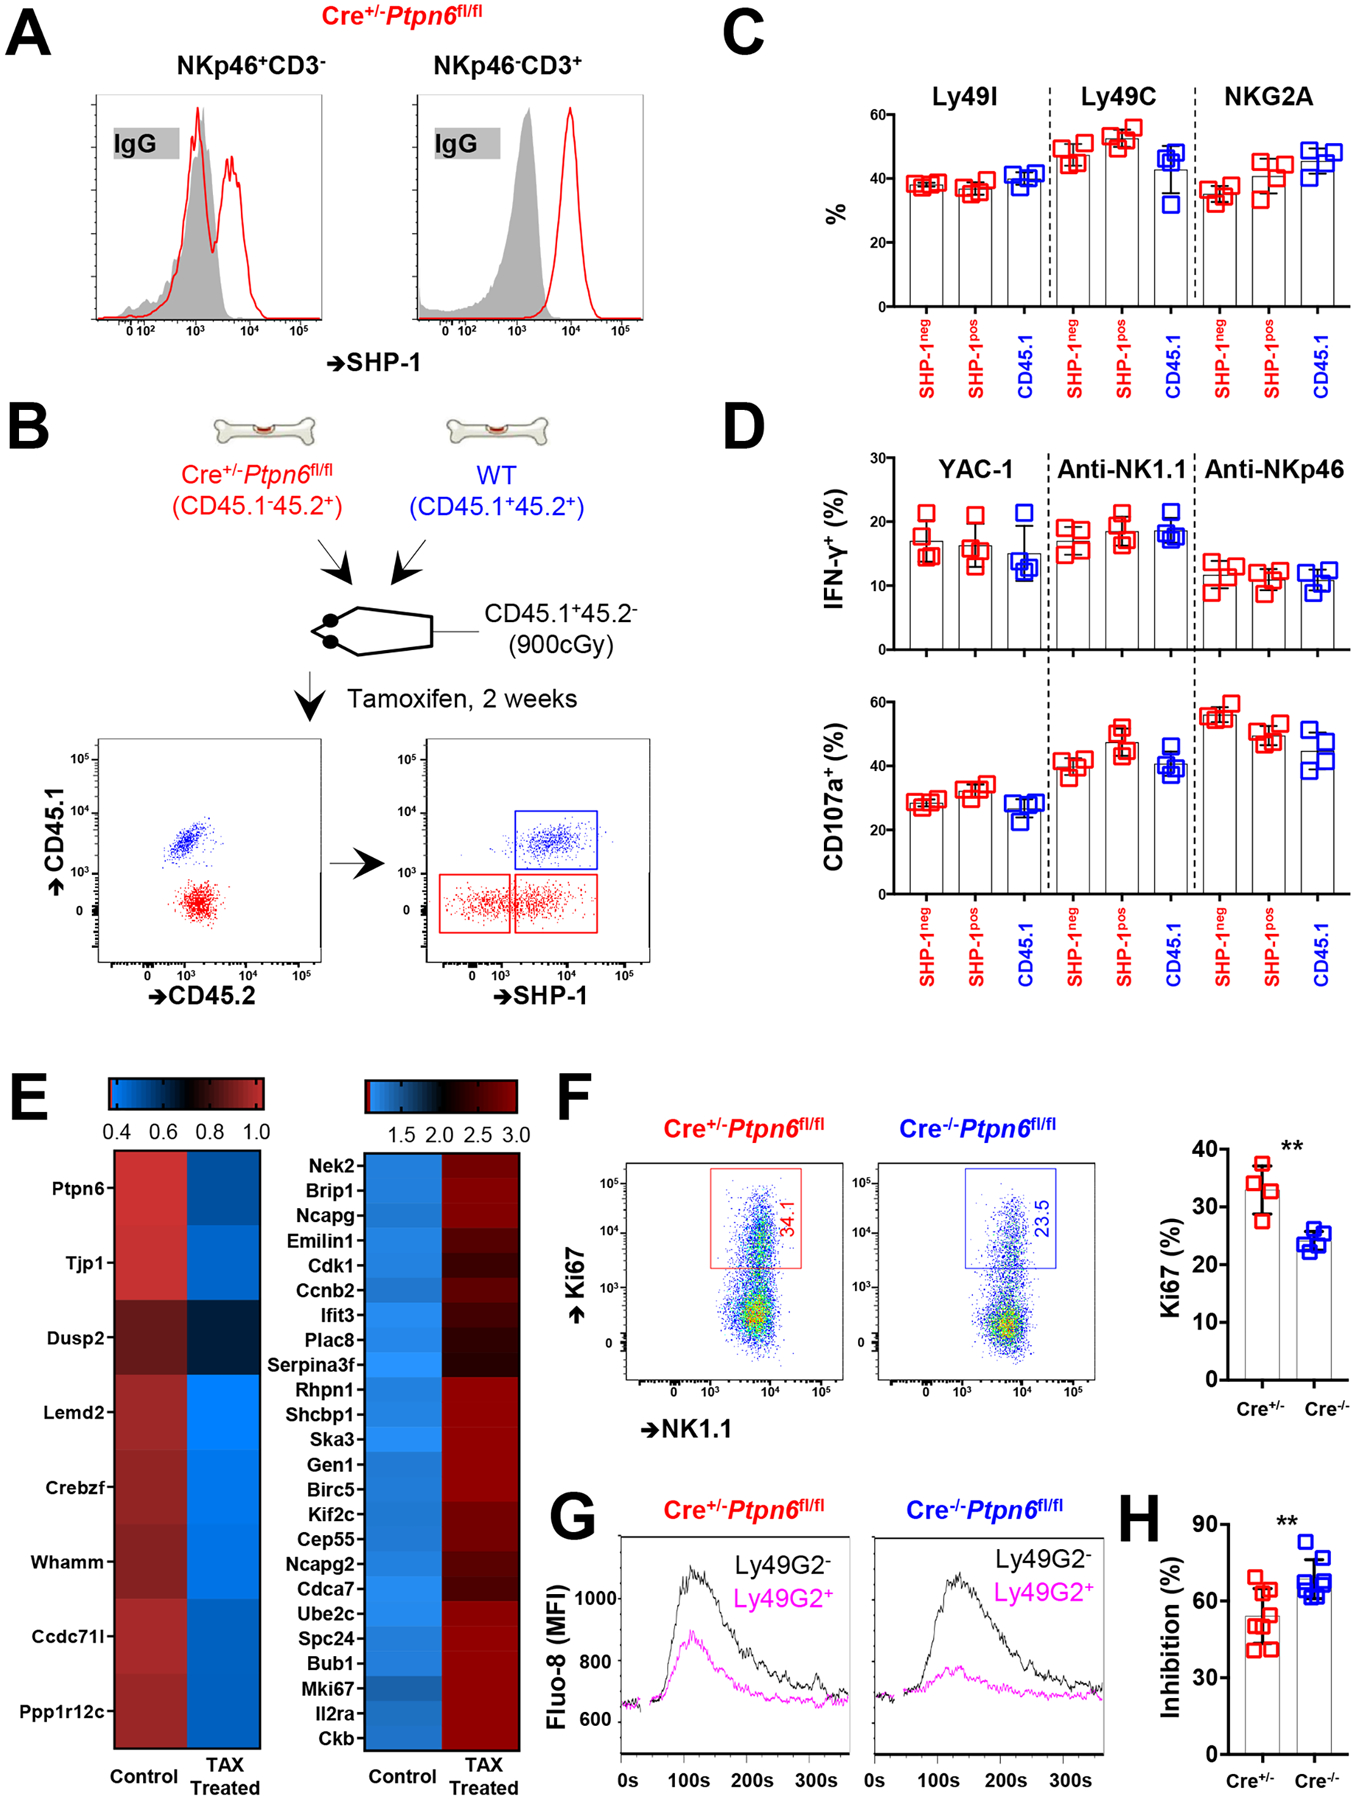
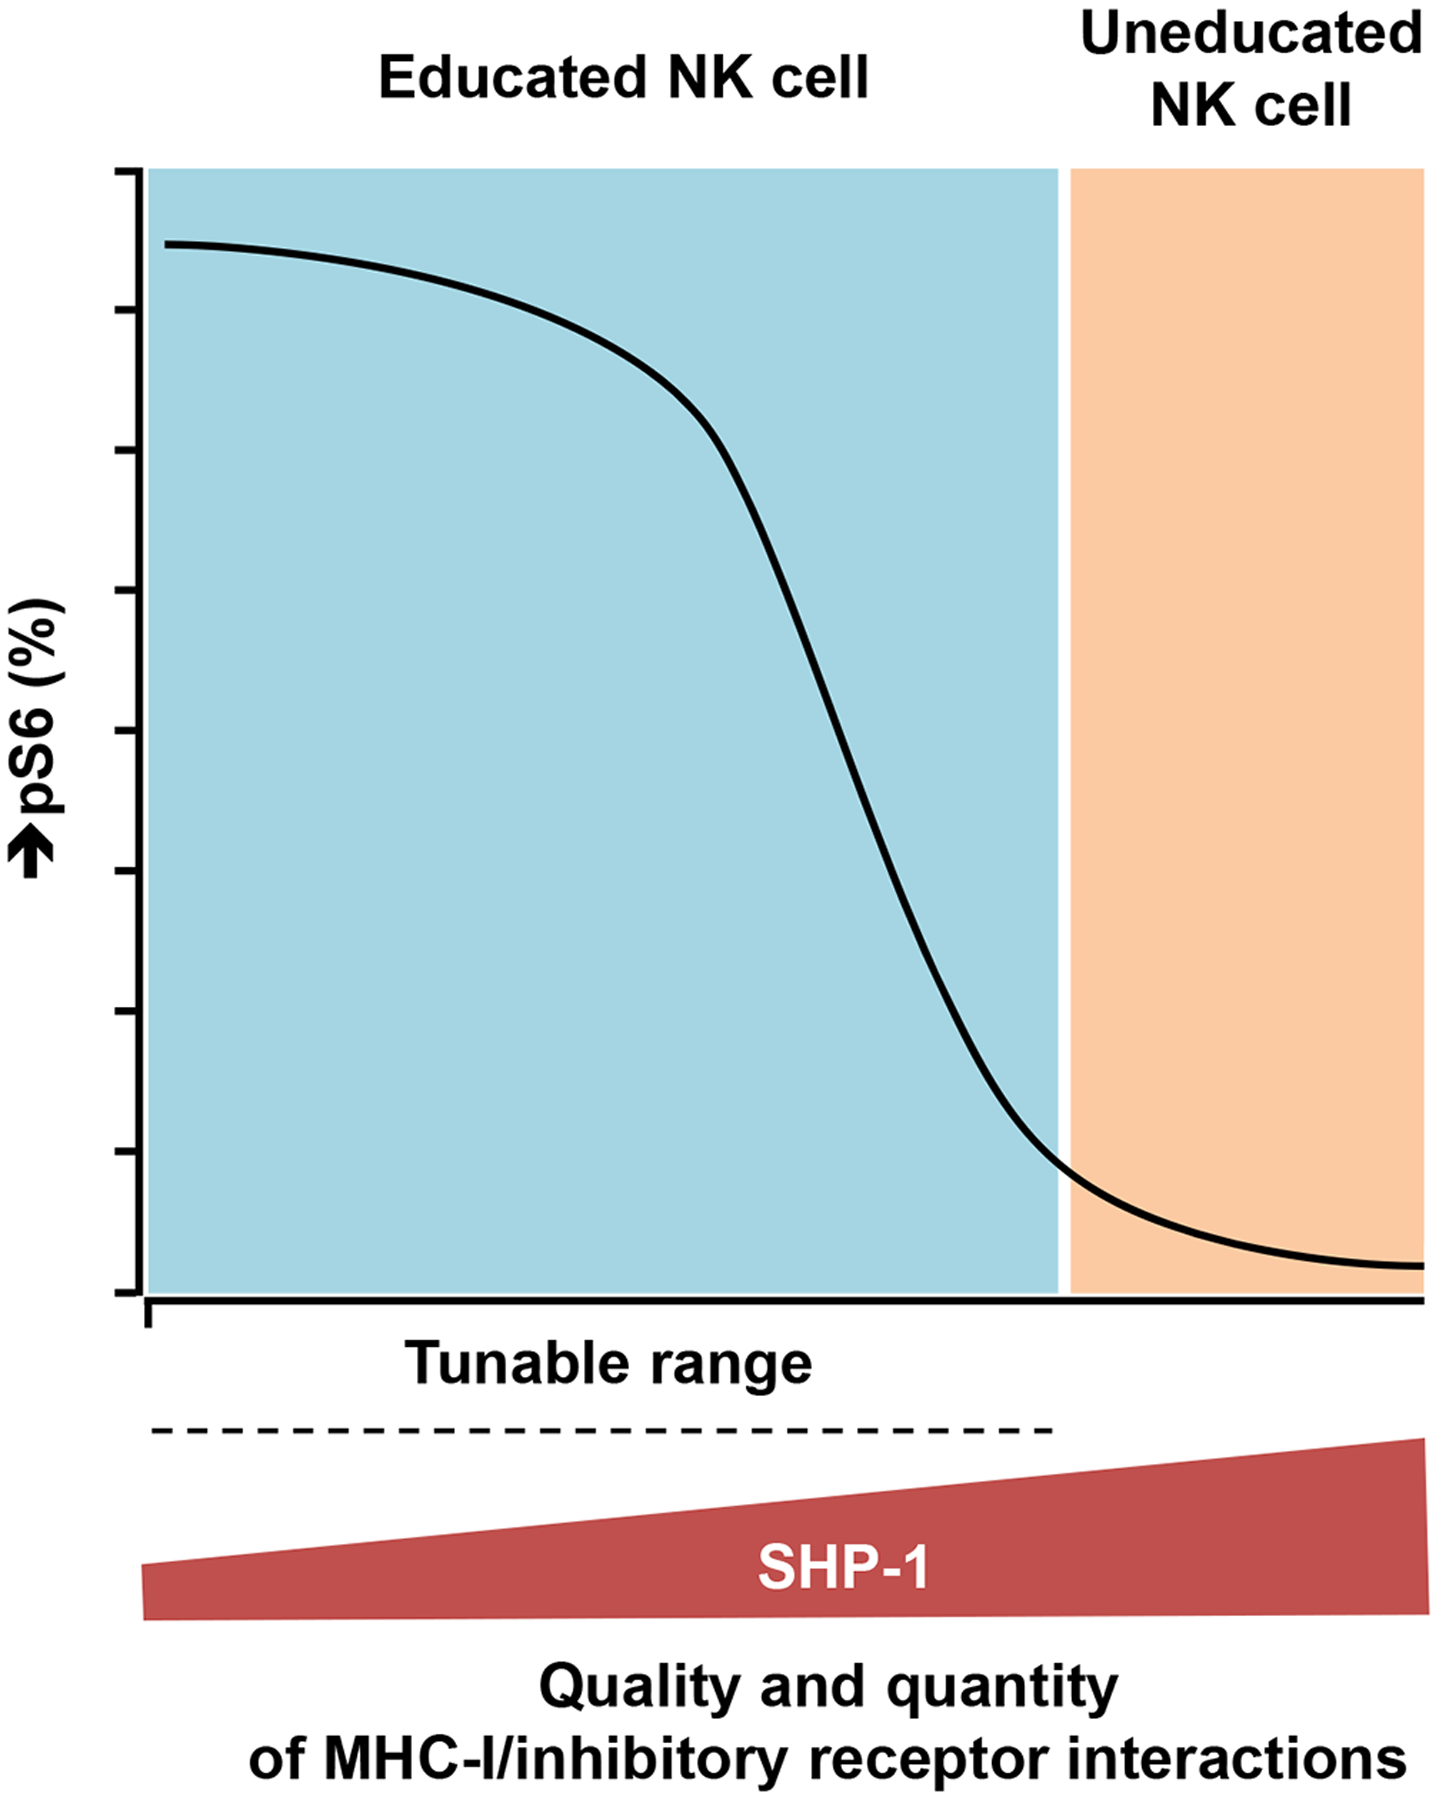
Interactions between human leukocyte antigen (HLA) molecules on target cells and the inhibitory killer cell immunoglobulin-like receptors (KIRs) and heterodimeric inhibitory receptor CD94-NKG2A on human natural killer (NK) cells shape and program various response capacities. A functionally orthologous system exists in mice, consisting of major histocompatibility complex (MHC) molecules on target cells and the inhibitory Ly49 and CD94-NKG2A receptors on NK cells. Here, we found that the abundance of Src homology 2 domain–containing phosphatase-1 (SHP-1) in NK cells was established by interactions between MHCs and NK cell inhibitory receptors, although phenotypically identical NK cell populations still showed substantial variability in endogenous SHP-1 abundance and NK cell response potential. Human and mouse NK cell populations with high responsiveness had low SHP-1 abundance, and a reduction in SHP-1 abundance in NK cells enhanced their responsiveness. Computational modeling of NK cell activation by membrane-proximal signaling events identified SHP-1 as a negative amplitude regulator, which was validated by single-cell analysis of human NK cell responsiveness. The amount of mRNA and protein varied among responsive NK cells despite their similar chromatin accessibility to that of unresponsive cells, suggesting dynamic regulation of SHP-1 abundance. Low intracellular SHP-1 abundance was a biomarker of responsive NK cells. Together, these data suggest that enhancing NK cell function through the acute loss of SHP-1 abundance or activity may enhance the tumoricidal capacity of NK cells.


Conflict of interest statement

Competing interests: K.C.H. is a member of the Wugen Scientific Advisory Board. The other authors declare that they have no competing interests.

Figures

Fig. 1.
Fig. 1.. Low SHP-1 abundance in human NK cells correlates with high responsiveness.
(A) Flow cytometric analysis of relative SHP-1 abundance among the indicated human NK cell subsets (stained with the polyclonal antibody C19 or the monoclonal antibody Y476) from an HLA-C1+C2Bw4+ donor. gMFI values of SHP-1 are indicated in the plots. Staining controls are indicated in green for KIR+ or NKG2A+ cells and in black for KIRNKG2A cells. FMO, fluorescence minus one. (B) Analysis of the degranulation of the indicated NK cell subsets in response to treatment with 721.221 cells or HLA-C1/E-expressing 721.221 cells. Red populations are KIR-expressing or NKG2A-expressing cells. The indicated percentages of positive cells in the dot plots were determined as a percentage of the KIR+ and NKG2A+ single-positive (sp) cells or the KIRNKG2A NK cells. (C) Ratio of relative SHP-1 abundance (as determined with the Y476 antibody) among cells single-positive for KIR or NKG2A from 20 KIR haplotype-A homozygous donors. (D) Ratio of the degranulation activity of the indicated NK cell subsets to K562 cells from the indicated HLA genotypes. Data are representative of three (A and B) independent experiments. Data are means ± SD in (C) and (D), n = 20 human donors. *P < 0.05; **P < 0.01; ***P < 0.001; Friedman test and post hoc pairwise Wilcoxon test for multi-group comparison were used. Each symbol represents an individual human donor.
Fig. 2.
Fig. 2.. Modeling NK cell responsiveness based on SHP-1 abundance.
(A) Purified NK cells were treated with the crosslinking anti-CD16 antibody for 5 min and then fixed to detect the relative abundance of pS6 based on the amounts of SHP-1. Unstimulated NK cells served as the control. Plots are representative of six independent experiments. (B) Freshly purified NK cells were incubated with 721.221 cells for 15 min and then fixed to determine the relative amounts of pS6 and SHP-1. Plots are representative of three independent experiments. (C and D) Simulations of the amounts of pVav (C) and pS6 (D) in 4000 cells after CD16 stimulation with increasing concentrations of human IgG. Colored lines indicate equal amounts of SHP-1 molecules in the simulation box (see also Materials and Methods). (E and F) Single-cell analysis of KIR3DL1+ (E) and KIR3DL1 (F) NK cell responses to the indicated concentrations of anti-CD16 antibody for different amounts of SHP-1. Plots are representative of two independent experiments. (G) SHP-1 abundance among KIR3DL1high and KIR3DL1low NK cells from HLA-Bw4 and HLA-BW4+ donors. NK cells from the same donors are paired by lines. (H) pS6 abundance among KIR3DL1high, KIR3DL1low, and KIR3DL1 NK cells after treatment with a crosslinking anti-CD16 antibody. The indicated percentages of positive cells in the dot plots were determined as percentages of the KIR3DL1high, KIR3DL1low, and KIR3DL1 NK cells. Plots are representative of two independent experiments from four donors in total. Data are means ± SD in (G); n = 9 for HLA-Bw4–negative donors and n = 18 for HAL-Bw4–positive donors. ***P < 0.001; nonparametric Wilcoxon signed rank sum test was used. Each symbol represents an individual human donor.
Fig. 3.
Fig. 3.. Functional and transcriptional analyses of responsive murine NK cells.
(A) Analysis of the percentages of IFN-γ+ among Ly49I, Ly49C, and NKG2A single-positive NK cells from B6 and β2m−/− mice after treatment with a crosslinking anti-NK1.1 antibody. Results are pooled from two independent experiments. (B) Overlap of differentially expressed genes among Ly49Isp, Ly49Csp, and NKG2Asp NK cells vs. Ly49NKG2A (N) NK cells that were sorted from B6 mice. (C) Representative results of differentially expressed genes between nonresponsive and responsive NK cells: Ly49I single-positive (I), Ly49C single-positive (C), and NKG2A single-positive (A). (D) Flow cytometric analysis of SHP-1 abundance among educated and uneducated NK cell populations from B6 mice. gMFI values of SHP-1 are indicated in the plots. Isotype control antibodies are indicated in green (for Ly49+ or NKG2A+ cells) and black lines (for Ly49NKG2A cells). (E) Analysis of SHP-1 abundance among the indicated NK cell populations from B6 and β2m−/− mice. Results are pooled from two independent experiments. (F) Analysis of SHP-1 abundance among CD45.1+ NK cells 10 days after their transfer to irradiated B6 or β2m−/− recipient mice. Results are pooled from two independent experiments. (G) Analysis of SHP-1 abundance among KIR3DL1+ NK cells 8 weeks after the transplantation of CD34+ human umbilical cord blood cells into irradiated HLA-B27+ or HLA-B27 NRG mice. Data are representative of two human donors, with cells from each donor used to implant four NRG mice. Data are means ± SD in (A), (E), (F), and (G), n=14, 14, 14, and 8 mice. *P < 0.05; **P < 0.01; ***P < 0.001; Friedman test and post hoc pairwise Wilcoxon test for multi-group comparison (A, E, and F), and Mann-Whitney U test (G) were used. Each symbol represents an individual mouse.
Fig. 4.
Fig. 4.. NK cells have enhanced activity when SHP-1 is reduced.
(A) TdTomato abundance among NKp46+ splenic NK cells from CreERT2+/−Ptpn6fl/+tdtomatofl/− mice 3 days after tamoxifen administration. (B) SHP-1 abundance among tdTomato+ and tdTomato NK cells from CreERT2+/−Ptpn6fl/+tdtomatofl/− and CreERT2+/−Ptpn6+/+tdtomatofl/− mice 3 days after tamoxifen administration. (C and D) IFN-γ production and CD107a activity among tdTomato+ and tdTomato NK cells in response to YAC-1 cells or treatment with crosslinking anti-NK1.1 or anti-NKp46 antibodies. Paired symbols indicate populations from the same mouse. Results are representative of three independent experiments. The indicated percentages of positive cells in the dot plots were determined as percentages of the tdTomato+ and tdTomato NK cells. Data are means ± SD in (B), n = 11 mice. *P < 0.05; ***P < 0.001; Mann-Whitney U test (B), and Nonparametric Wilcoxon signed rank sum test (D) were used. Each symbol represents an individual mouse.
Fig. 5.
Fig. 5.. SHP-1–deficient NK cells show enhanced activity upon crosslinking of activating and inhibitory receptors.
(A) SHP-1 abundance among NKp46+CD3 and NKp46CD3+ splenic lymphocytes from CreERT2+/−Ptpn6fl/fl mice 14 days after tamoxifen administration. (B) Experimental design. Mixed bone marrow chimeric mice were established with both WT (CD45.1+CD45.2+) and CreERT2+/−Ptpn6fl/fl (CD45.1CD45.2+) bone marrow at an equal ratio. SHP-1 abundance among splenic NK cells (NKp46+NK1.1+CD3) was evaluated 2 weeks after the administration of tamoxifen to the chimeric animals. (C and D) Ly49I, Ly49C, and NKG2A cell surface expression (C) and IFN-γ production and CD107a activity (D) in response to co-culture with YAC-1 cells or treatment with crosslinking anti-NK1.1 or anit-NKp46 antibodies among CD45.1SHP-1+, CD45.1SHP-1, and CD45.1+ NK cells. Results are pooled from two independent experiments. (E) CD45.1CD45.2+ NK cells were sorted from chimeric animals that did or did not receive tamoxifen for 2 weeks. Differentially expressed genes are determined by RNAseq analysis. (F) Representative and accumulated Ki67 expression among splenic NK cells from CreERT2+/−Ptpn6fl/fl and CreERT2−/−Ptpn6fl/fl mice with tamoxifen treatment. Results are pooled from two independent experiments. (G) Representative kinetics of Fluo-8 fluorescence (Ca2+ flux) after the treatment of NK cells with antibodies against NKp46 and Ly49G2. Splenic NK cells were purified from CreERT2+/−Ptpn6fl/fl and CreERT2+/−Ptpn6fl/fl mice 14 days after tamoxifen administration. Ly49G2+ NK cells are indicated in pink, and Ly49G2 NK cells are indicated in black. (H) Ly49G2-mediated inhibition among NK cells assessed by area under curve (AUC) values of the kinetics of Ca2+ flux as shown in (G). Results are pooled from two independent experiments. (E to H) NK cells from Cre+ animals were a mixture of SHP-1–positive and –negative cells. Data are means ± SD in (C), (D), (F), and (H), n = 4, 4, 4, and 8 mice. **P < 0.01; Mann-Whitney U test (F and I) was used. Each symbol represents an individual mouse.
Fig. 6.
Fig. 6.. The relationship between SHP-1 abundance and NK cell responsiveness.
SHP-1 is a digital regulator of NK cell responsiveness, determining the response state of a given cell. When the abundance of SHP-1 exceeds a critical threshold, as in uneducated NK cells, the EC50 value for the signaling network becomes infinite and NK cells become resistant to activation, concurrently leading to the general inability to tune NK cell activity among uneducated NK cells. SHP-1 is a negative amplitude regulator in NK cell responsiveness. Subpopulations among educated NK cells with varying amounts of SHP-1 have different Pmax values (pS6), despite having consistent EC50 values. The relative amounts of SHP-1 among the NK cells were established by self-MHC-class I–specific KIR and NKG2A in a dose-dependent manner for both receptors and ligands.

Similar articles

Cited by

References

    1. Lanier LL, NK cell recognition. Annu Rev Immunol 23, 225–274 (2005). - PubMed
    1. Karre K, Ljunggren HG, Piontek G, Kiessling R, Selective rejection of H-2-deficient lymphoma variants suggests alternative immune defence strategy. Nature 319, 675–678 (1986). - PubMed
    1. Kim S, Poursine-Laurent J, Truscott SM, Lybarger L, Song YJ, Yang L, French AR, Sunwoo JB, Lemieux S, Hansen TH, Yokoyama WM, Licensing of natural killer cells by host major histocompatibility complex class I molecules. Nature 436, 709–713 (2005). - PubMed
    1. Fernandez NC, Treiner E, Vance RE, Jamieson AM, Lemieux S, Raulet DH, A subset of natural killer cells achieves self-tolerance without expressing inhibitory receptors specific for self-MHC molecules. Blood 105, 4416–4423 (2005). - PMC - PubMed
    1. Brodin P, Karre K, Hoglund P, NK cell education: not an on-off switch but a tunable rheostat. Trends Immunol 30, 143–149 (2009). - PubMed

Publication types

MeSH terms

Substances

LinkOut - more resources