. 2021:659:37-70.
doi: 10.1016/bs.mie.2021.07.007. Epub 2021 Sep 23.

Use of tandem affinity-buffer exchange chromatography online with native mass spectrometry for optimizing overexpression and purification of recombinant proteins

Affiliations

Use of tandem affinity-buffer exchange chromatography online with native mass spectrometry for optimizing overexpression and purification of recombinant proteins

Stella M Lai et al. Methods Enzymol. 2021.

Abstract

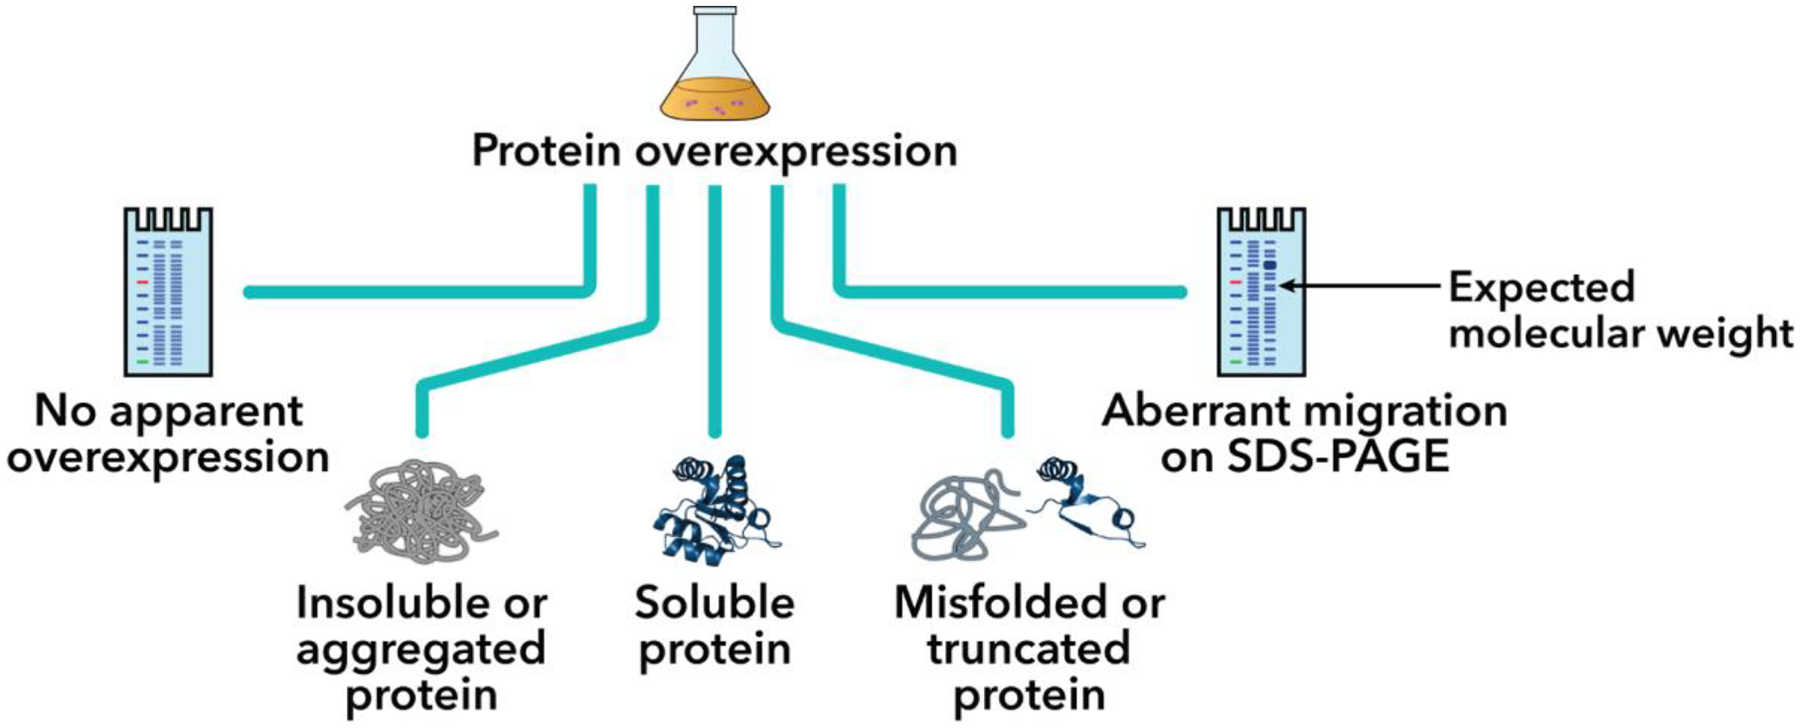
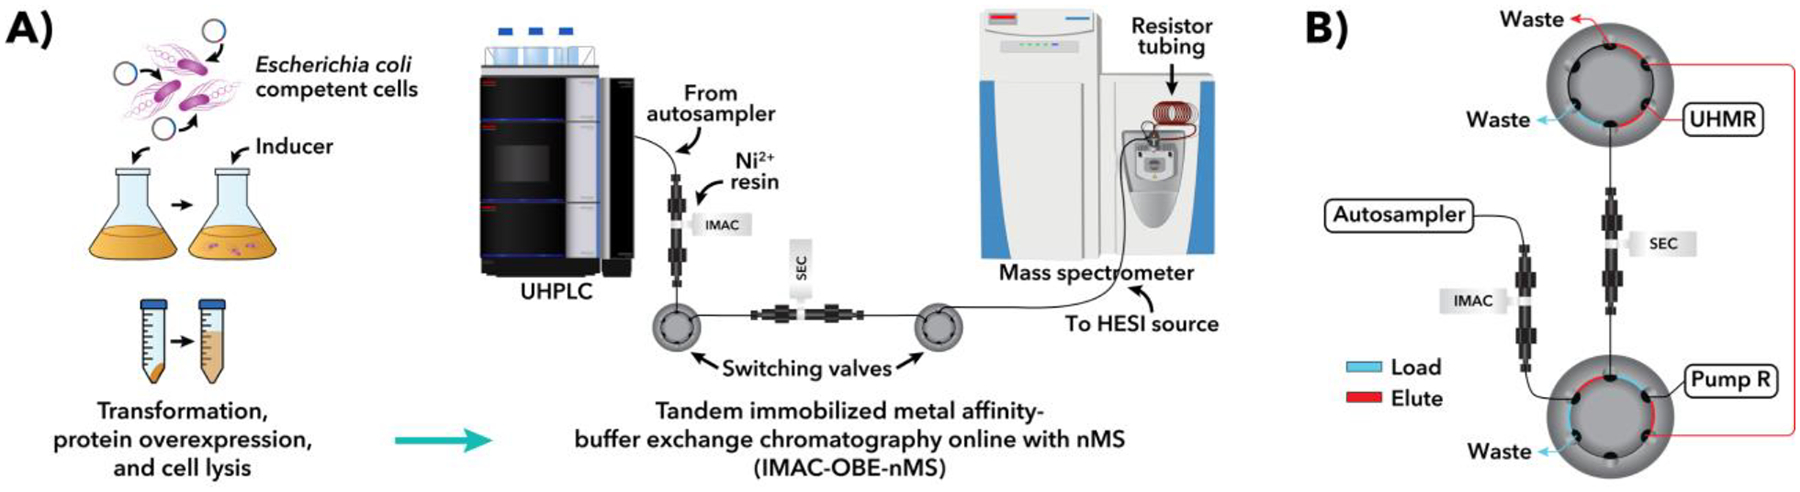
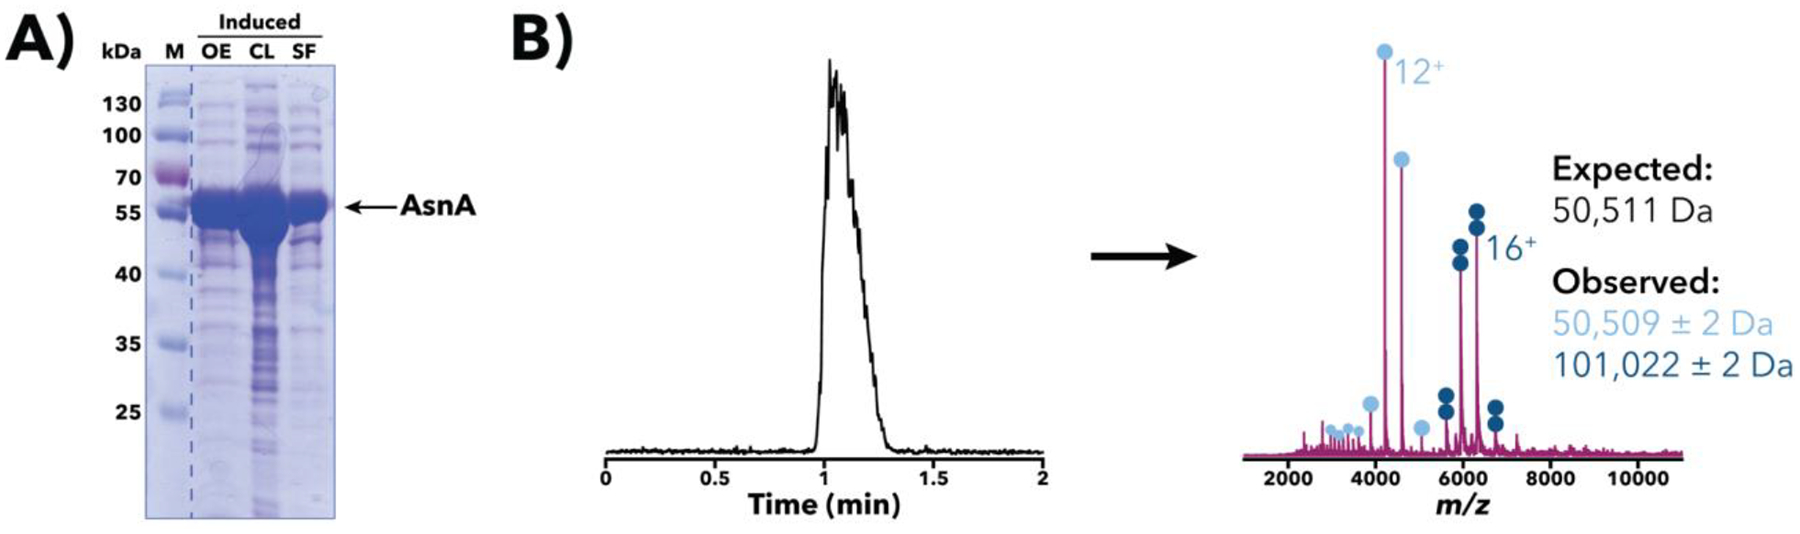
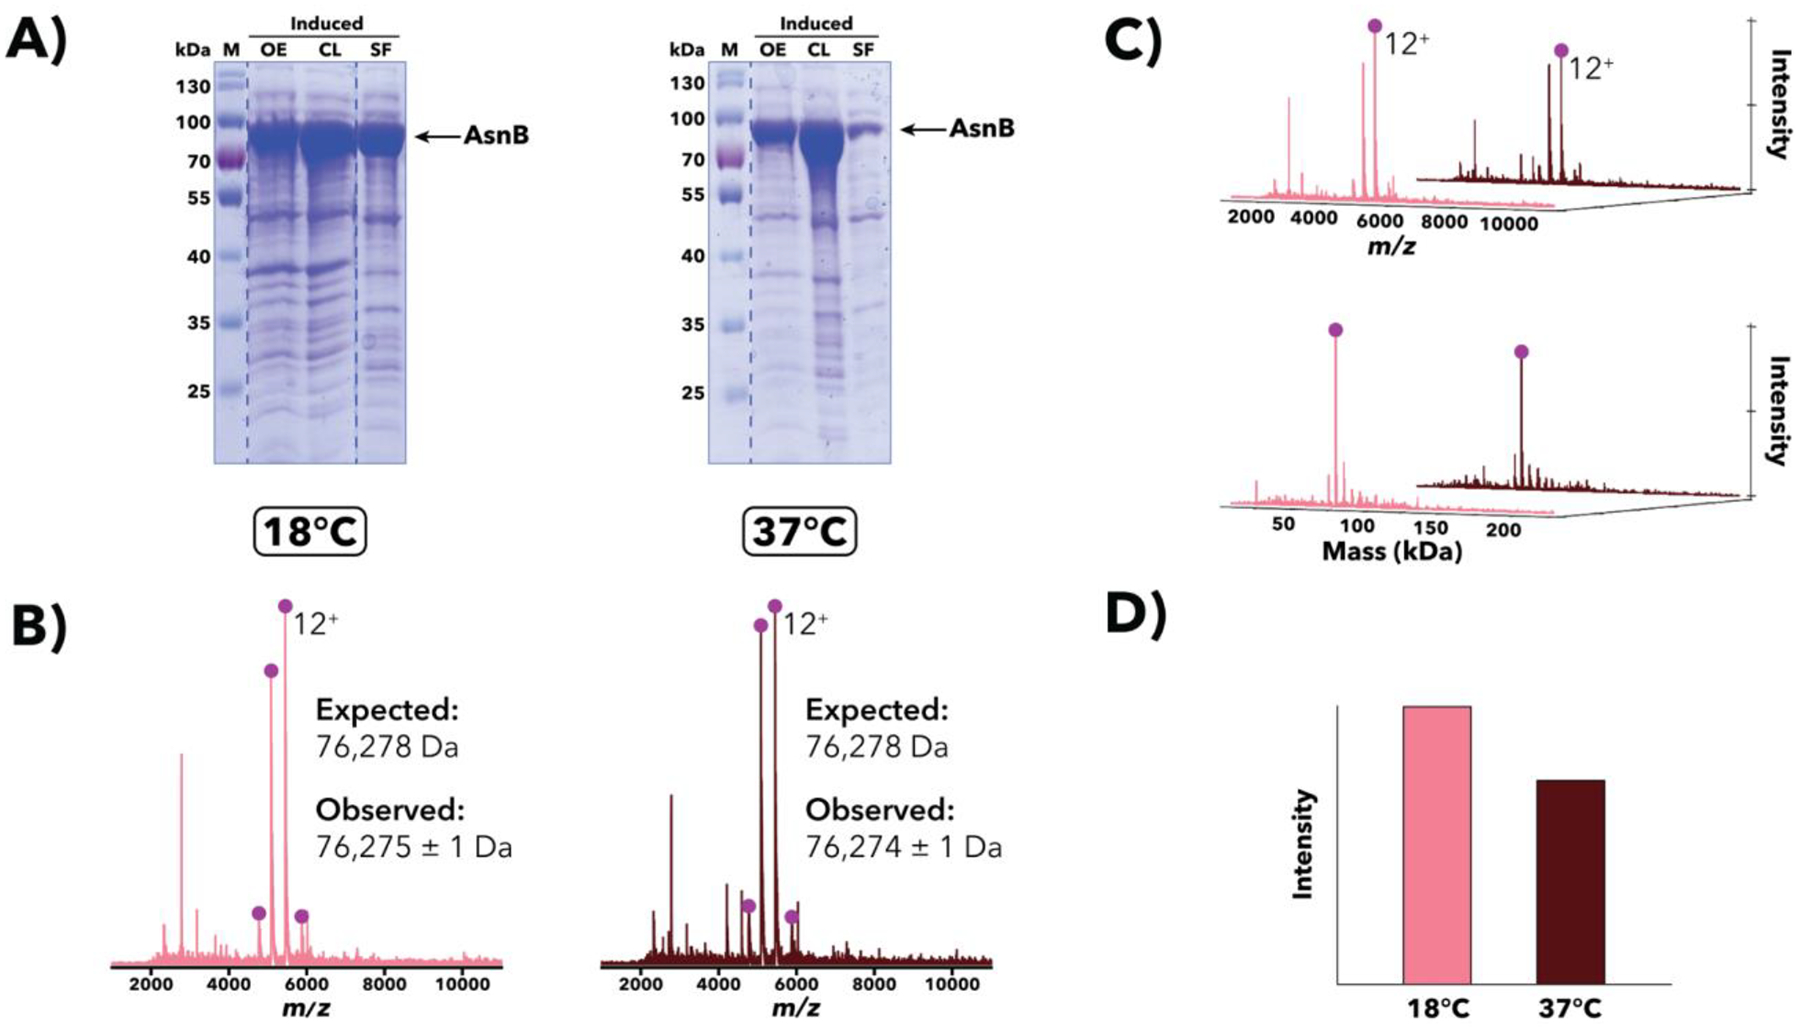
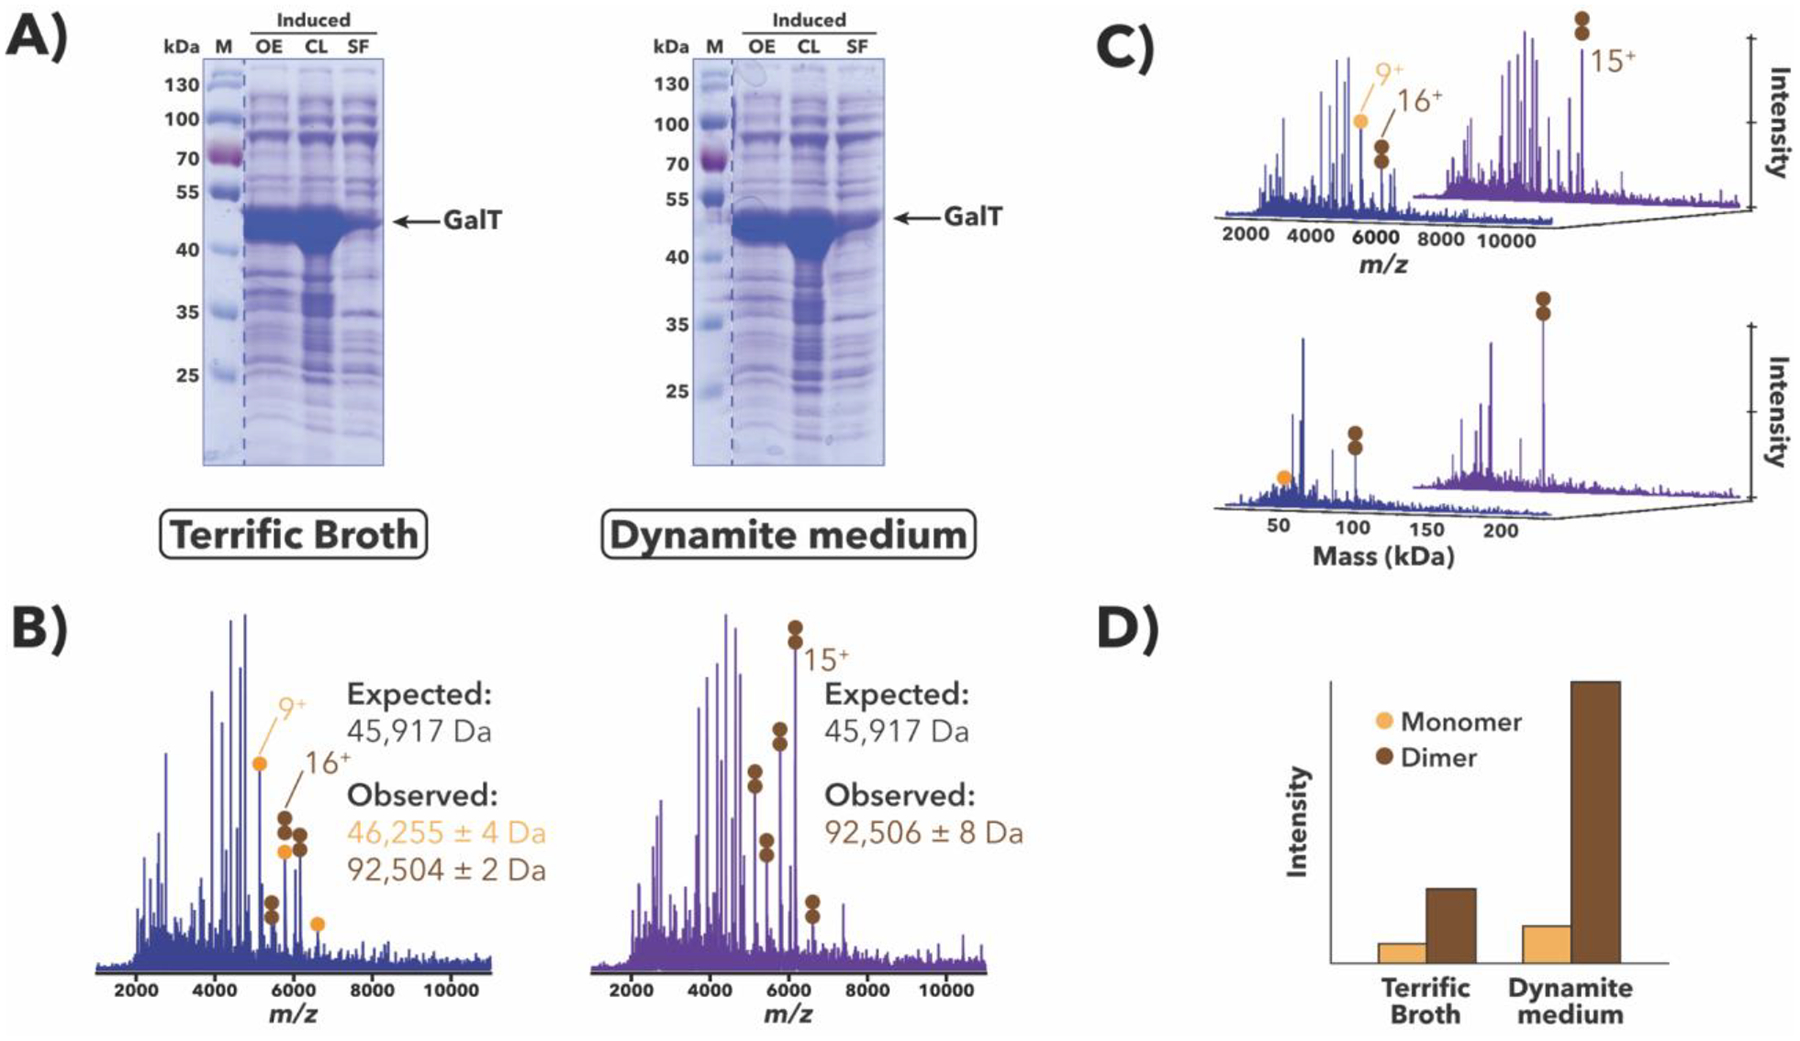
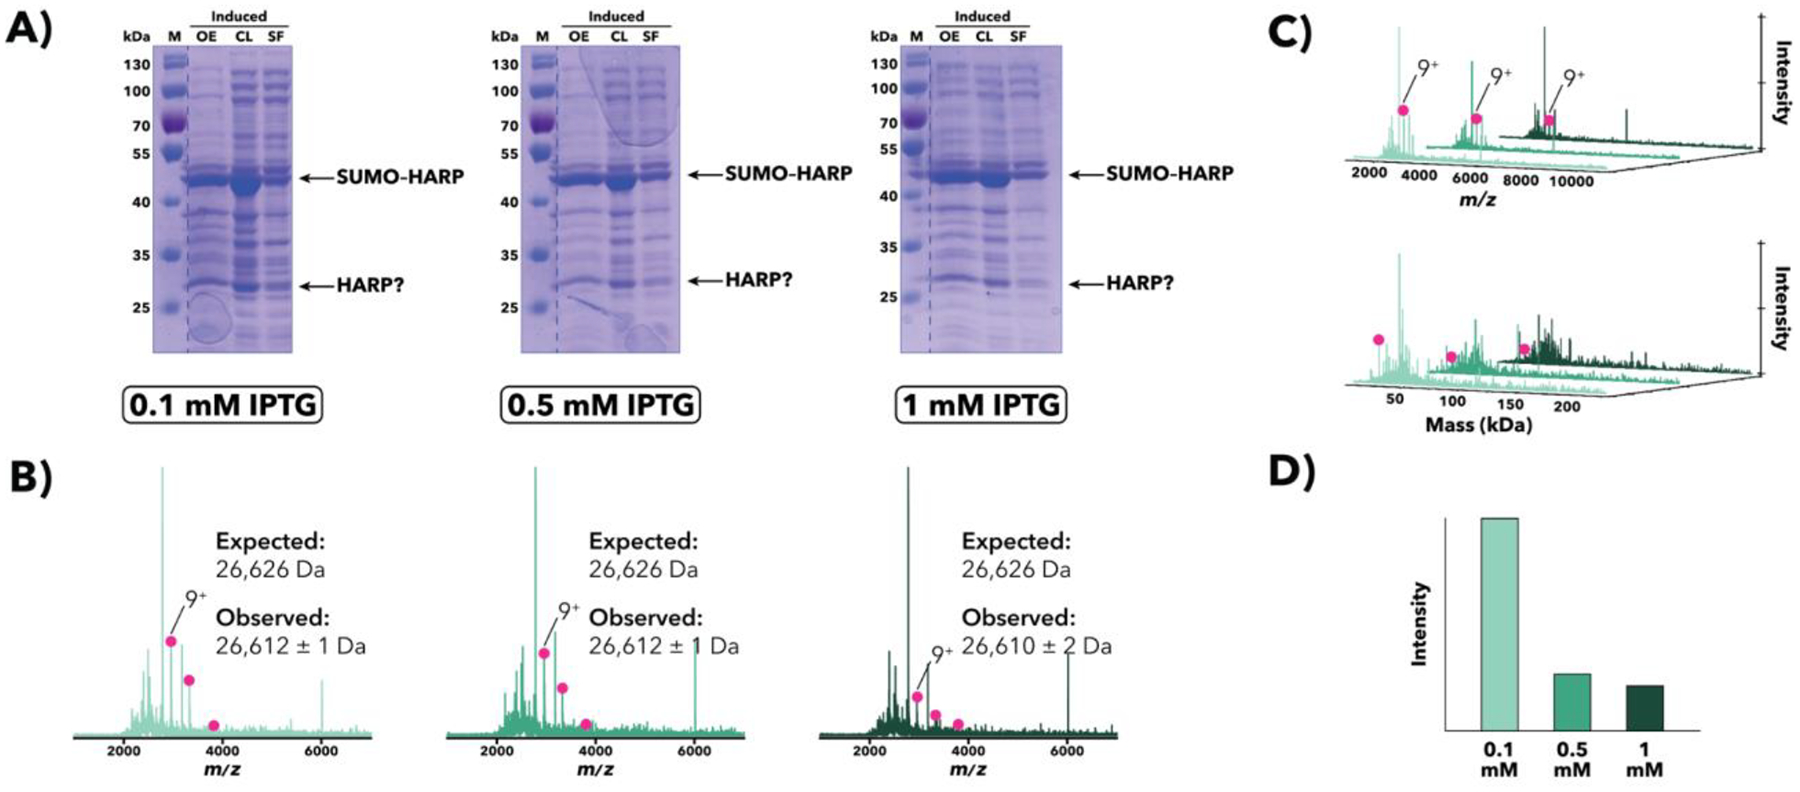
Purification of recombinant proteins typically entails overexpression in heterologous systems and subsequent chromatography-based isolation. While denaturing sodium dodecyl sulfate-polyacrylamide gel electrophoresis is routinely used to screen a variety of overexpression conditions (e.g., host, medium, inducer concentration, post-induction temperature and/or incubation time) and to assess the purity of the final product, its limitations, including aberrant protein migration due to compositional eccentricities or incomplete denaturation, often preclude firm conclusions regarding the extent of overexpression and/or purification. Therefore, we recently reported an automated liquid chromatography-mass spectrometry-based strategy that couples immobilized metal affinity chromatography (IMAC) with size exclusion-based online buffer exchange (OBE) and native mass spectrometry (nMS) to directly analyze cell lysates for the presence of target proteins. IMAC-OBE-nMS can be used to assess whether target proteins (1) are overexpressed in soluble form, (2) bind and elute from an IMAC resin, (3) oligomerize, and (4) have the expected mass. Here, we use four poly-His-tagged proteins to demonstrate the potential of IMAC-OBE-nMS for expedient optimization of overexpression and purification conditions for recombinant protein production.

Keywords: Immobilized metal affinity chromatography; Liquid chromatography–mass spectrometry; Native mass spectrometry; Online buffer exchange; Protein overexpression.


Conflict of interest statement

Conflict of interest statement The desalting cartridge used in this study is a prototype of a commercial product that is being developed by Thermo Scientific with input and testing by the OSU team.

Figures

Figure 1.
Figure 1.
Potential outcomes of recombinant protein overexpression. [Protein structure: PDB 3NVI (Xue et al., 2010)]
Figure 2.
Figure 2.
Recombinant protein overexpression and characterization using IMAC-OBE-nMS. (A) General workflow and instrument setup. (B) Schematic of dual six-port switching valve system, which has two positions: “Load” (blue) and “Elute” (red). See Section 3.3.2 for more details. Adapted from (Busch et al., 2021) with permission from ACS Publications.
Figure 3.
Figure 3.
Characterization of a Salmonella AsnA overexpression sample. (A) SDS-PAGE [10% (w/v) polyacrylamide] analysis of a post-induction sample at sequential stages of processing. Despite an expected mass of ~50.5 kDa, the apparent AsnA band runs slower than the 55 kDa marker, an example of aberrant protein migration in SDS-PAGE. Gel image has been spliced at the dotted line to only show relevant samples. M, size markers; OE, whole-cell sample following overexpression; CL, whole-cell crude lysate; SF, soluble fraction post-centrifugation. (B) IMAC-OBE-nMS analysis of the soluble fraction using a 500 mM ammonium acetate mobile phase. A representative total ion chromatogram (left) and mass spectrum (right; IST 100 V, HCD CE 5 eV) are shown. The expected mass noted above accounts for loss of the N-terminal methionine, a common post-translational modification (Ben-Bassat et al., 1987; Giglione et al., 2004). Charge state distributions for monomeric and dimeric AsnA species are indicated with light and dark blue circles, respectively, and the main charge state for each species is labeled. The bimodal charge state distribution for the monomer, with its low intensity, higher charge state peaks marked with smaller light blue circles, suggests that there is partially unfolded monomer present in the sample. The y-axis (not shown) represents relative intensity.
Figure 4.
Figure 4.
Comparison of Salmonella AsnB overexpression samples induced and grown at either 18°C or 37°C. (A) SDS-PAGE [10% (w/v) polyacrylamide] analysis of post-induction samples at sequential stages of processing. Despite an expected mass of ~76.3 kDa, the apparent AsnB band runs much slower than the 70 kDa marker, an example of aberrant protein migration in SDS-PAGE. (B) IMAC-OBE-nMS analysis of soluble fractions using a 500 mM ammonium acetate mobile phase. Mass spectra (IST 100 V, HCD CE 5 eV) for 18°C (pink) and 37°C (dark red) are shown. The expected mass noted above accounts for loss of the N-terminal methionine, a common post-translational modification (Ben-Bassat et al., 1987; Giglione et al., 2004). The charge state distribution for AsnB is indicated, and the main charge state is labeled. The y-axis (not shown) represents relative intensity. (C) Waterfall plots showing m/z (top) and deconvolved mass (bottom) data. The main charge state (top) and deconvolved mass (bottom) for AsnB is labeled. (D) Relative abundance of AsnB across both samples, as quantified using MetaUniDec software.
Figure 5.
Figure 5.
Comparison of H. sapiens GalT overexpression samples grown in either Terrific Broth (Tartof & Hobbs, 1987) or Dynamite media (Taylor et al., 2017). (A) SDS-PAGE [10% (w/v) polyacrylamide] analysis of post-induction samples at sequential stages of processing. While GalT appears to overexpress well in both media (OE lanes), only a small amount is apparently expressed in a soluble form (SF lanes). (B) IMAC-OBE-nMS analysis of soluble fractions using a 200 mM ammonium acetate mobile phase. Mass spectra (IST 100 V, HCD CE 5 eV) for the Terrific Broth (blue) and Dynamite medium (purple) samples are shown. While there are other proteins present in both samples, charge state distributions for monomeric and dimeric GalT species are indicated with orange and brown circles, respectively, and the main charge state for each species is labeled. The y-axis (not shown) represents relative intensity. The observed masses are larger than the expected mass (by ~336 Da/monomer) (see Discussion). (C) Waterfall plots showing m/z (top) and deconvolved mass (bottom) data, which were generated using MetaUniDec software (Kostelic & Marty, 2020; Marty et al., 2015). The main charge state (top) and deconvolved mass (bottom) for each species is labeled. (D) Relative abundance of GalT species across both samples, as quantified using MetaUniDec software.
Figure 6.
Figure 6.
Comparison of M. jannaschii SUMO–HARP overexpression samples induced with either 0.1, 0.5, or 1 mM IPTG. (A) SDS-PAGE [10% (w/v) polyacrylamide] analysis of post-induction samples at sequential stages of processing. Apparent bands corresponding to full-length SUMO–HARP as well as non-SUMO-tagged HARP are indicated. (B) IMAC-OBE-nMS analysis of soluble fractions using a 500 mM ammonium acetate mobile phase. Mass spectra (IST 100 V, HCD CE 5 eV) for 0.1 mM (light green), 0.5 mM (middle green), and 1 mM (dark green) IPTG are shown. While no apparent full-length SUMO–HARP is present in the spectrum, there is some non-SUMO-tagged HARP (pink circles). The charge state distribution for non-SUMO-tagged HARP is indicated, and the main charge state is labeled. The y-axis (not shown) represents relative intensity. (C) Waterfall plots showing m/z (top) and deconvolved mass (bottom) data. The main charge state (top) and deconvolved mass (bottom) for non-SUMO-tagged HARP is labeled. (D) Relative abundance of non-SUMO-tagged HARP across all samples, as quantified using MetaUniDec software.

References

    1. Agasid MT, Sørensen L, Umer LH, Yan J, & Robinson CV (2021). The effects of sodium ions on ligand binding and conformational states of G protein-coupled receptors–insights from mass spectrometry. J. Am. Chem. Soc, 143(11), 4085–4089. - PMC - PubMed
    1. Ali MH, & Imperiali B (2005). Protein oligomerization: how and why. Bioorg. Med. Chem, 13(17), 5013–5020. - PubMed
    1. Ben-Bassat A, Bauer K, Chang S-Y, Myambo K, Boosman A, & Chang S (1987). Processing of the initiation methionine from proteins: properties of the Escherichia coli methionine aminopeptidase and its gene structure. J. Bacteriol, 169(2), 751–757. - PMC - PubMed
    1. Ben-Nissan G, Vimer S, Warszawski S, Katz A, Yona M, Unger T, … Sharon M (2018). Rapid characterization of secreted recombinant proteins by native mass spectrometry. Commun. Biol, 1, 213. - PMC - PubMed
    1. Bertani G (1951). Studies on lysogenesis: I. The mode of phage liberation by lysogenic Escherichia coli. J. Bacteriol, 62(3), 293–300. - PMC - PubMed

Publication types

MeSH terms

LinkOut - more resources