. 2022 Jan 4;132(1):e151268.
doi: 10.1172/JCI151268.

Gasdermin D inhibition confers antineutrophil-mediated cardioprotection in acute myocardial infarction

Affiliations

Gasdermin D inhibition confers antineutrophil-mediated cardioprotection in acute myocardial infarction

Kai Jiang et al. J Clin Invest. .

Abstract

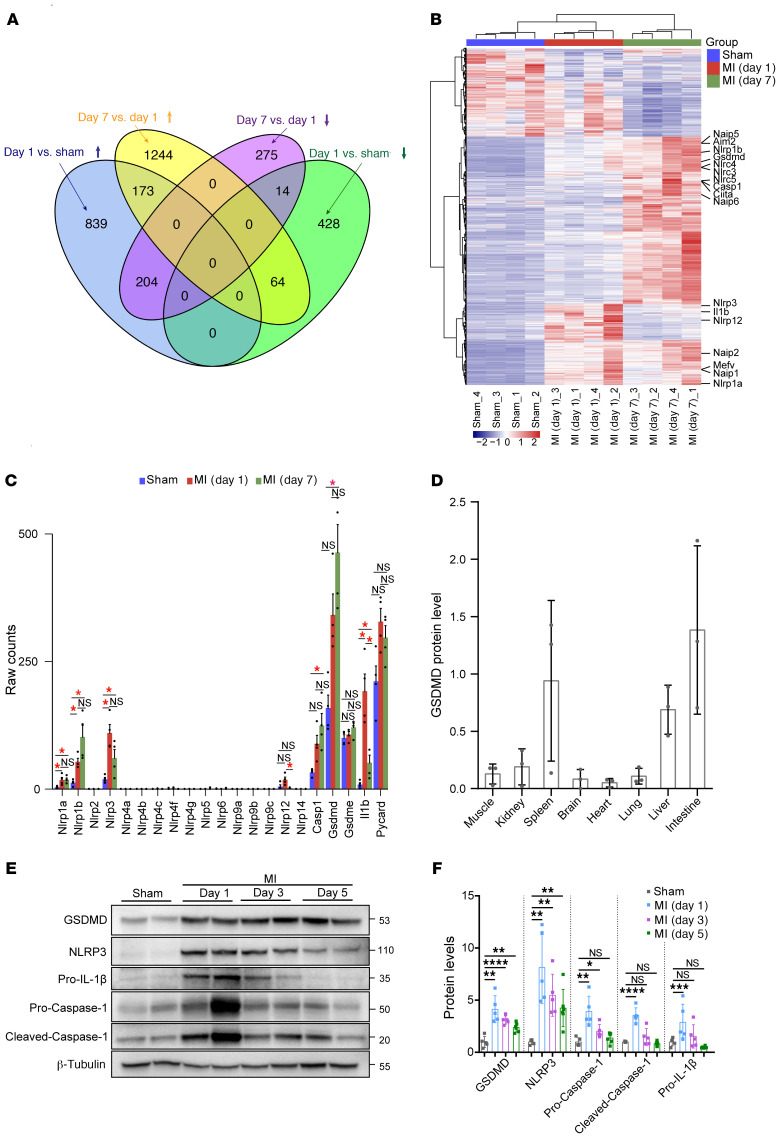
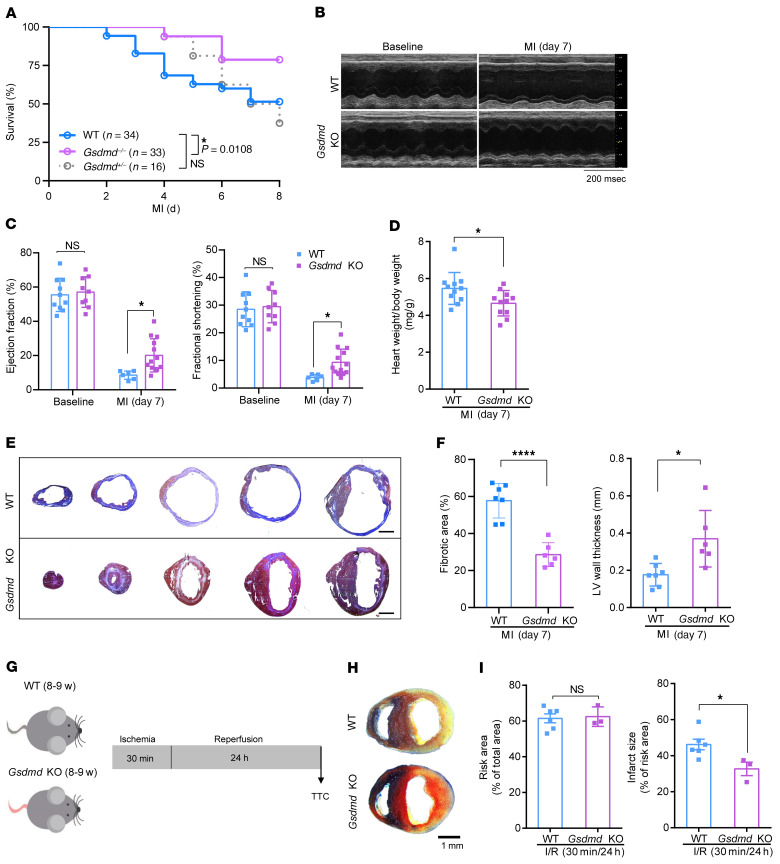
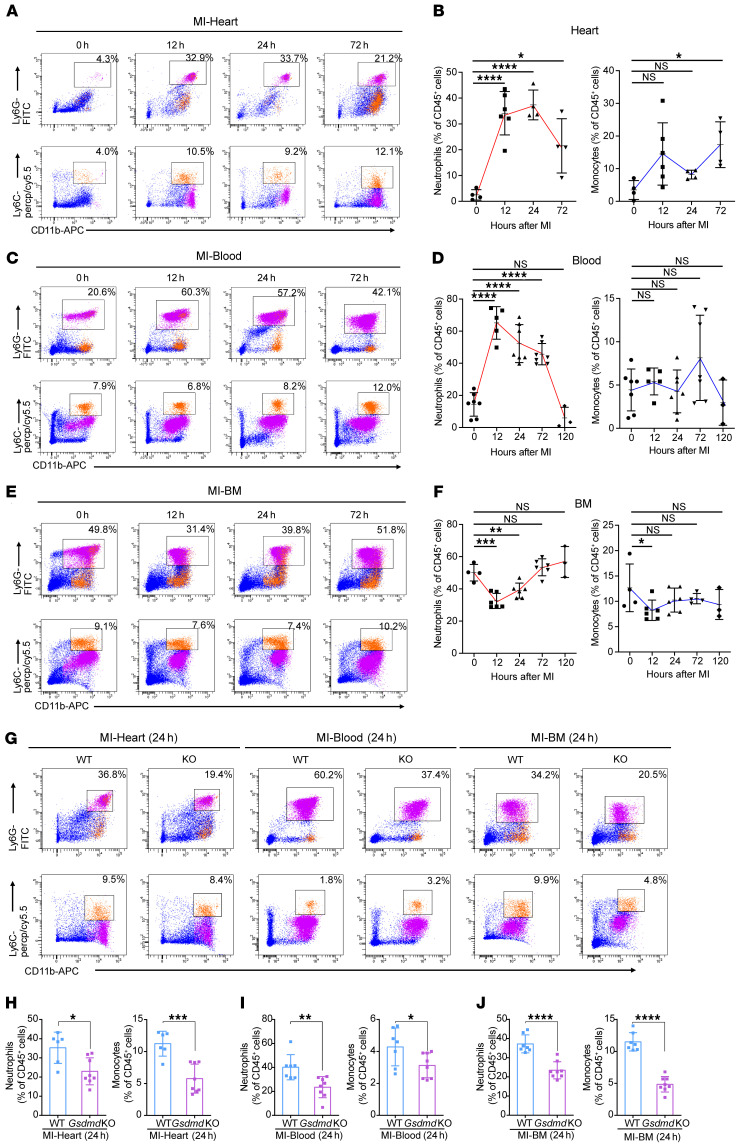
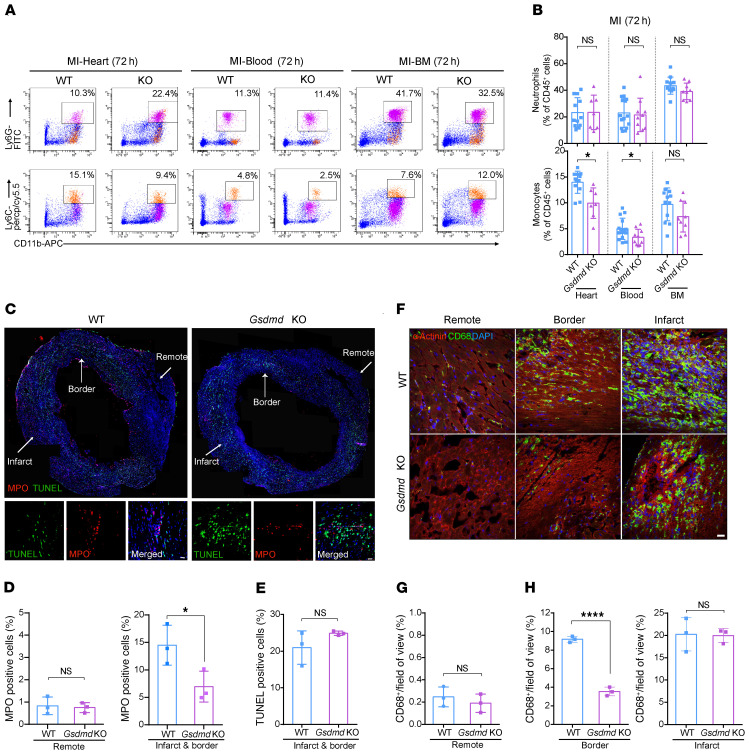
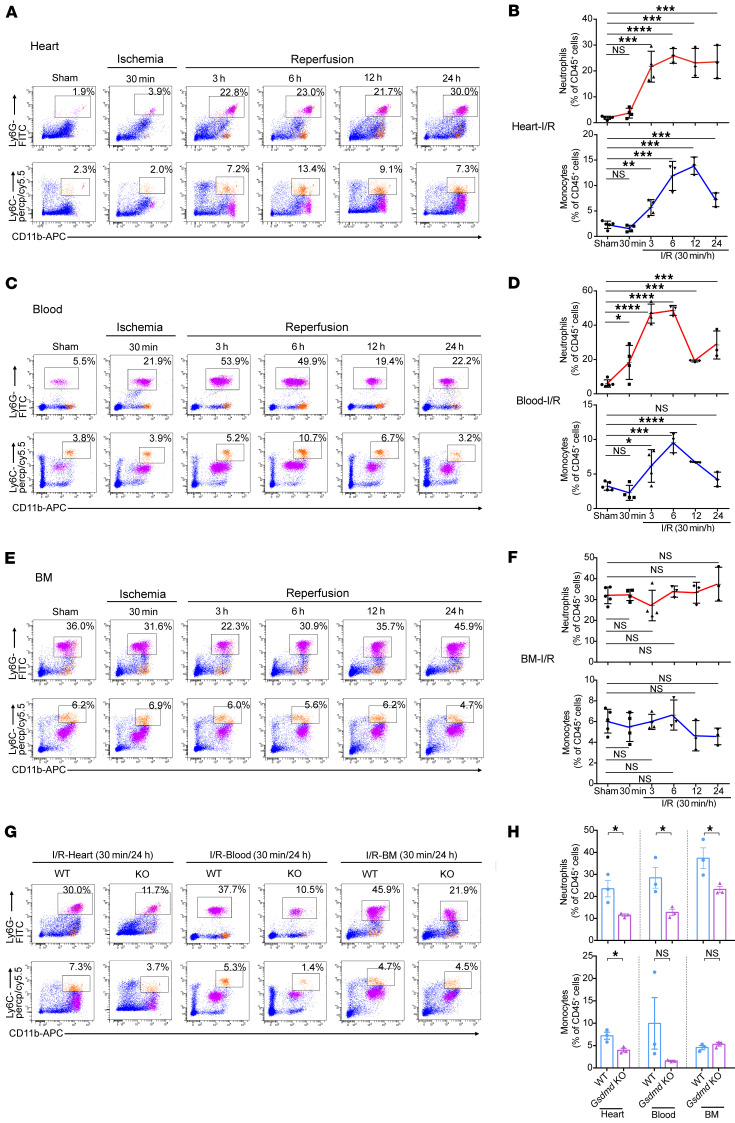
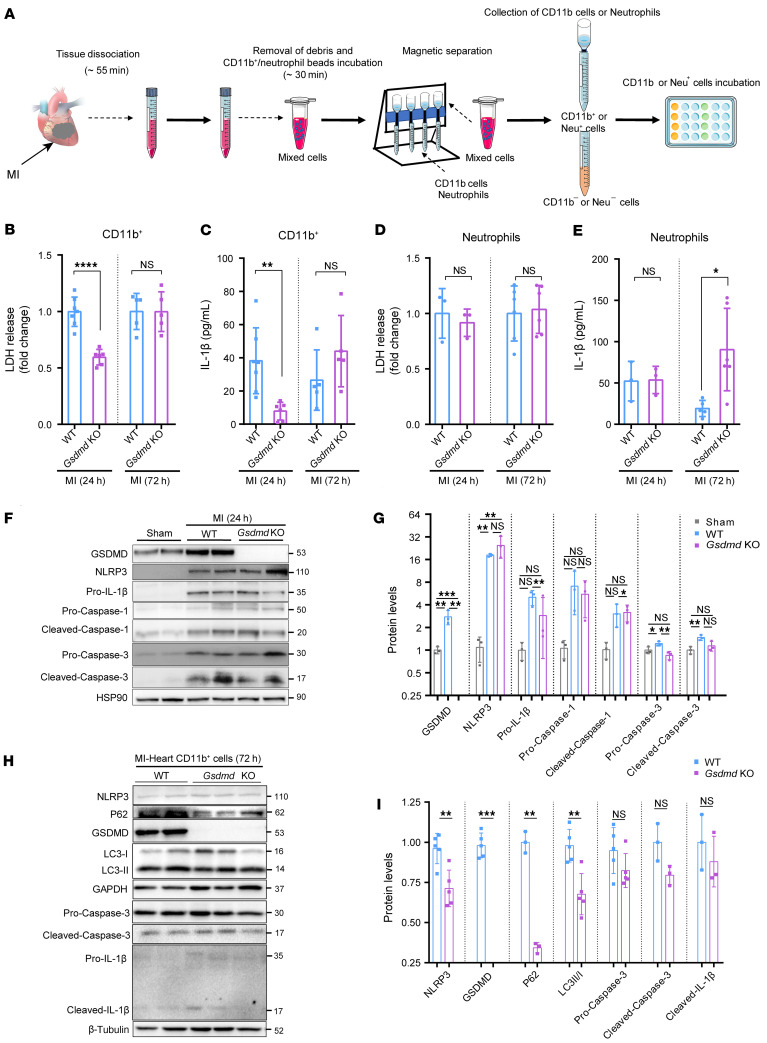
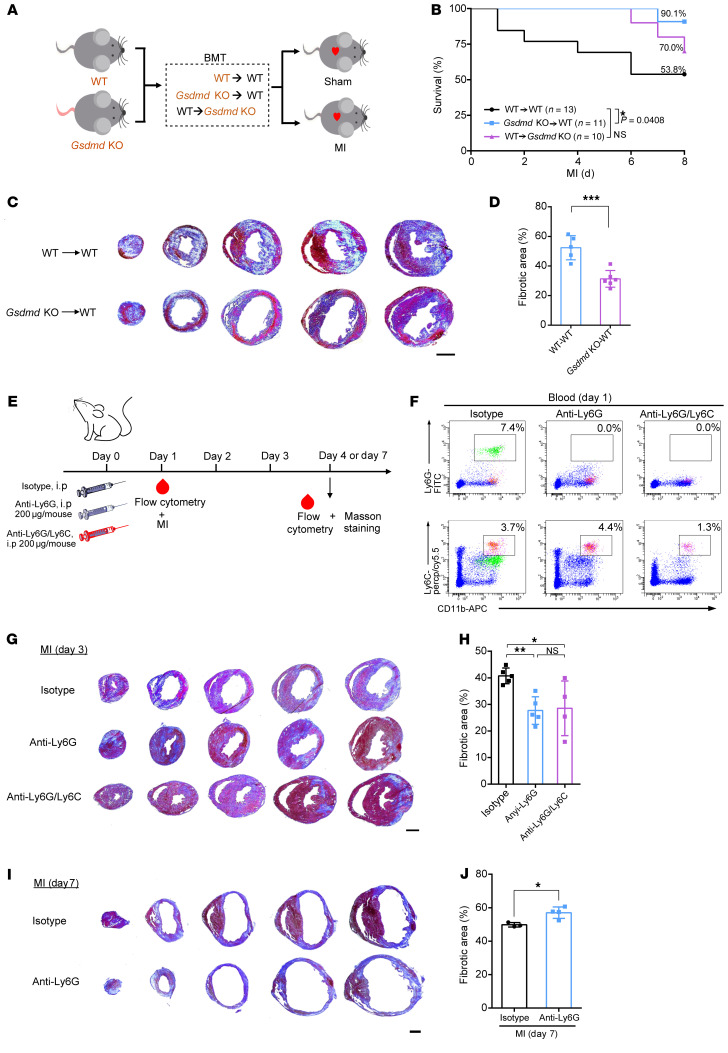
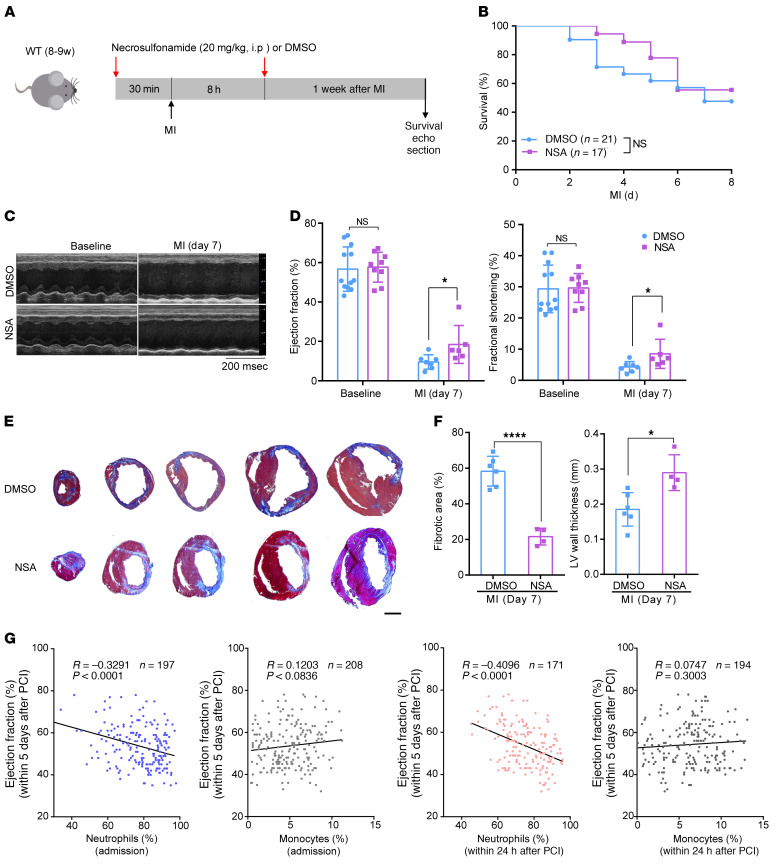
Acute myocardial infarction (AMI) induces blood leukocytosis, which correlates inversely with patient survival. The molecular mechanisms leading to leukocytosis in the infarcted heart remain poorly understood. Using an AMI mouse model, we identified gasdermin D (GSDMD) in activated leukocytes early in AMI. We demonstrated that GSDMD is required for enhanced early mobilization of neutrophils to the infarcted heart. Loss of GSDMD resulted in attenuated IL-1β release from neutrophils and subsequent decreased neutrophils and monocytes in the infarcted heart. Knockout of GSDMD in mice significantly reduced infarct size, improved cardiac function, and increased post-AMI survival. Through a series of bone marrow transplantation studies and leukocyte depletion experiments, we further clarified that excessive bone marrow-derived and GSDMD-dependent early neutrophil production and mobilization (24 hours after AMI) contributed to the detrimental immunopathology after AMI. Pharmacological inhibition of GSDMD also conferred cardioprotection after AMI through a reduction in scar size and enhancement of heart function. Our study provides mechanistic insights into molecular regulation of neutrophil generation and mobilization after AMI, and supports GSDMD as a new target for improved ventricular remodeling and reduced heart failure after AMI.

Keywords: Cardiology; Neutrophils.


Figures

Figure 1
Figure 1. GSDMD is activated in the early phase of AMI.
(A) Venn diagram revealing the intersection of differentially expressed genes created from the comparisons of day 1 AMI vs. sham and day 7 AMI vs. day 1 AMI. (B) Each row in the heatmap represents a specific gene that had significantly different expression levels in comparisons between any two groups, the expression of which was normalized across the column, with high expression shown in red and low in blue. (C) Bar plot showing the trends of gene expression across sham, day 1 AMI, and day 7 AMI. *Indicates a statistically significant difference, with fold change (FC) ≥ 2 and false discovery rate (FDR) < 0.05. (D) Quantification of GSDMD protein levels by immunoblotting in different tissues of WT (C57BL/6N) mice (n = 3). (E and F) Representative immunoblotting (E) and quantification (F) of left ventricular tissues from mice subjected to AMI for different time points (1 day, 3 days, 5 days) or sham surgery (n = 5–6 per group). β-Tubulin or HSP90 was used as a loading control. Data are presented as mean ± SD and were analyzed by 1-way ANOVA with Tukey’s correction for multiple comparisons (F). *P < 0.05; **P < 0.01; ***P < 0.001; ****P < 0.0001. NS, not significant.
Figure 2
Figure 2. Loss of GSDMD attenuates myocardial injury after AMI.
(A) Kaplan-Meier survival curves comparing post-AMI survival of WT (C57BL/6N) mice (n = 34) to that of Gsdmd−/− mice (n = 33) or Gsdmd+/− mice (n = 16). Statistical significance was determined by Mantel-Cox test. (B and C) Echocardiography images (B) and M-mode quantification (C) of ejection fraction (left) and fractional shortening (right) for WT or Gsdmd−/− mice before or 1 week after AMI (baseline: WT, n = 10; Gsdmd−/−, n = 9; 1 week: WT, n = 6; Gsdmd−/−, n = 12). (D) A comparison of heart weight/body weight ratio between WT mice and Gsdmd−/− mice 1 week after AMI (WT, n = 11; Gsdmd−/−, n = 11). (E and F) Masson’s trichrome staining (E) and quantification of fibrotic area and left ventricular (LV) wall thickness (F) of short-axis heart sections from WT or Gsdmd−/− mice 1 week after AMI (WT, n = 7; Gsdmd−/−, n = 6). Scale bar: 1 mm. (G) Schematic diagram showing the ischemia/reperfusion (I/R) surgery strategy for WT and Gsdmd−/− mice. (H and I) Representative images of Evans blue dye and triphenyltetrazolium chloride (TTC) staining (H) and quantification of risk area (left) and infarct size (right) (I) for WT or Gsdmd−/− mice after I/R surgery (WT, n = 6; KO, n = 3). Data are presented as mean ± SD. *P < 0.05; ****P < 0.0001, as analyzed by 1-way ANOVA followed by Bonferroni’s multiple comparison test (C) or unpaired, 2-tailed Student’s t test (D, F, and I). NS, not significant.
Figure 3
Figure 3. GSDMD is essential for recruitment of neutrophils/monocytes to the AMI heart.
(AF) Flow cytometric analysis and quantification of Cd11b+Ly6G+ neutrophils and Cd11b+Ly6C+ monocytes in heart (A), blood (C), or bone marrow (BM) (E) from WT or Gsdmd−/− mice at different time points (12 hours, 24 hours, 72 hours) after AMI or sham surgery (n = 4–7), along with their quantification (B, D, and F). (GJ) Flow cytometric analysis and quantification of Cd11b+Ly6G+ neutrophils and Cd11b+Ly6C+ monocytes in heart (H), blood (I), or BM (J) from WT or Gsdmd−/− mice 24 hours after AMI (n = 7–8). Data are presented as mean ± SD. *P < 0.05; **P < 0.01; ***P < 0.001; ****P < 0.0001, as analyzed by 1-way ANOVA followed by Bonferroni’s multiple comparison test (B, D, and F) or unpaired, 2-tailed Student’s t test (HJ). NS, not significant.
Figure 4
Figure 4. GSDMD is essential for recruitment of neutrophils/monocytes to the infarcted heart.
(A and B) Flow cytometric analysis and quantification of Cd11b+Ly6G+ neutrophils and Cd11b+Ly6C+ monocytes in the heart (left), blood (middle), or BM (right) from WT or Gsdmd−/− mice 72 hours after AMI (n = 7–15). (C) Immunofluorescence imaging and magnification for MPO (red), TUNEL (green), and DAPI (blue) on heart sections from WT or Gsdmd−/− mice 24 hours after AMI. Scale bar: 20 μm. (D and E) Quantification of ratios of MPO+ or TUNEL+ cells of heart sections from WT or Gsdmd−/− mice. Each value was averaged from the values of 7 fields of view from the same mouse (n = 3 per group). (F) Immunofluorescence imaging of heart sections from WT or Gsdmd−/− mice 3 days after AMI showing α-actinin (red), CD68 (green), and DAPI (blue). Representative fields of remote zone, border zone, and infarct zone are presented. Scale bar: 20 μm. (G and H) Quantification of CD68+ area proportion in the field of view in remote zone (G) and border and infarct zones (H) of heart sections from WT or Gsdmd−/− mice. Each value was averaged from the values of 5 fields of view from the same mouse (n = 3 per group). Data are presented as mean ± SD. *P < 0.05; ****P < 0.0001 by multiple 2-tailed Student’s t test (B) or unpaired, 2-tailed Student’s t test (D, E, G, and H). NS, not significant.
Figure 5
Figure 5. GSDMD is essential for recruitment of neutrophils/monocytes to the I/R heart.
(AF) Flow cytometric analysis and quantification of Cd11b+Ly6G+ neutrophils and Cd11b+Ly6C+ monocytes in heart (A and B), blood (C and D), or bone marrow (BM) (E and F) from WT or Gsdmd−/− mice at different reperfusion time points (3 hours, 6 hours, 12 hours, 24 hours) after I/R or sham surgery. Corresponding n values are indicated in the plots. The statistical significance of sham versus 3, 6, 12, or 24 hours is indicated (n = 3–5). (G and H) Flow cytometric analysis (G) and quantification (H) of Cd11b+Ly6G+ neutrophils and Cd11b+Ly6C+ monocytes in heart (left), blood (middle), or BM (right) from WT or Gsdmd−/− mice 24 hours after I/R (n = 3). Data are presented as mean ± SD. *P < 0.05; **P < 0.01; ***P < 0.001; ****P < 0.0001 by 1-way ANOVA followed by Bonferroni’s multiple-comparison test (B, D, and F) or multiple 2-tailed Student’s t test (H). NS, not significant.
Figure 6
Figure 6. GSDMD deficiency suppresses cell death and IL-1β secretion.
(A) Schematic diagram showing the strategy of preparing samples for IL-1β and lactate dehydrogenase (LDH) detection in Cd11b+ myeloid-derived cells and neutrophils from the heart. Neu+, neutrophils; Neu, neutrophil free. (B) Secretion levels of LDH from leukocytes from the heart of WT or Gsdmd−/− mice 24 hours and 72 hours after AMI. (C) Production of IL-1β from Cd11b+ cells from the heart of WT or Gsdmd−/− mice 24 hours and 72 hours after AMI assessed by ELISA. The corresponding n values are indicated in the plot. (D) Secretion levels of LDH from neutrophils isolated from the heart of WT or Gsdmd−/− mice 24 hours and 72 hours after AMI. (E) Production of IL-1β from neutrophils isolated from the heart of WT or Gsdmd−/− mice 24 hours and 72 hours after AMI assessed by ELISA. The corresponding n values are indicated in the plot. (F and G) Representative immunoblotting images (F) and quantification (G) of protein levels in heart left ventricular tissues from WT or Gsdmd−/− mice 24 hours after AMI or sham surgery (n = 3 per group). (H and I) Representative immunoblotting images (H) and quantification (I) of protein levels of heart Cd11b+ cells from WT or Gsdmd−/− mice 72 hours after AMI or sham surgery (n = 3–5). Data are presented as mean ± SD. *P < 0.05; **P < 0.01; ***P < 0.001; ****P < 0.0001, as analyzed by unpaired, 2-tailed Student’s t test (BE and I) or 1-way ANOVA with Tukey’s correction for multiple comparisons (G). NS, not significant.
Figure 7
Figure 7. GSDMD-dependent bone marrow–derived myeloid cells contribute to acute inflammatory responses.
(A) Schematic diagram showing the strategy of the bone marrow transplantation (BMT) experiment. (B) Kaplan-Meier survival curves comparing post-AMI survival of WT → WT mice (n = 13) to that of Gsdmd-KO → WT mice (n = 11) or WT → Gsdmd-KO mice (n = 10). Statistical significance was determined by Mantel-Cox test. (C and D) Masson’s trichrome staining (C) and quantification (D) of fibrotic area of short-axis heart sections from WT → WT (n = 5) or Gsdmd-KO → WT (n = 6) mice 3 days after AMI. Scale bar: 1 mm. (E) Schematic diagram showing the strategy for neutrophil and monocyte depletion. (F) Flow cytometric gating of Ly6G+ neutrophils and Ly6C+ monocytes validating the successful elimination of neutrophils or monocytes in mice. (G and H) Masson’s trichrome staining (G) and quantification (H) of fibrotic area of short-axis heart sections from mice treated with isotype IgG (n = 5), anti-Ly6G antibody (n = 5), or anti-Ly6G/Ly6C antibody (n = 4) 3 days after AMI. Scale bar: 1 mm. (I and J) Masson’s trichrome staining (I) and quantification (J) of fibrotic area of short-axis heart sections from mice treated with isotype IgG (n = 3) or anti-Ly6G antibody (n = 4) 1 week after AMI. Scale bar: 1 mm. Data are presented as mean ± SD. *P < 0.05; **P < 0.01; ***P < 0.001 by unpaired, 2-tailed Student’s t test (D and J) or 1-way ANOVA followed by Tukey’s multiple-comparison test (H). NS, not significant.
Figure 8
Figure 8. Pharmacological inhibition of GSDMD reduces infarct size after AMI.
(A) Schematic diagram showing the strategy of NSA administration to the mice. (B) Kaplan-Meier survival curves comparing post-AMI survival of control (DMSO administration) mice (n = 21) to that of mice administered NSA (n = 17). Significance was determined by Mantel-Cox test. (C and D) Echocardiography images (C) and M-mode quantification (D) of ejection fraction (left) and fractional shortening (right) for control mice or mice with NSA administration before or 1 week after AMI (baseline: DMSO, n = 12; NSA, n = 9; 1 week: DMSO, n = 7; NSA, n = 6). (E and F) Masson’s trichrome staining (E) and quantification of fibrotic area and left ventricular (LV) wall thickness (F) of short-axis heart sections from control mice or mice with NSA administration 1 week after AMI (DMSO, n = 6; NSA, n = 4). Scale bar: 1 mm. (G) Analysis of correlation between ejection fraction of AMI patients within 5 days after PCI and the percentage of neutrophils or monocytes in peripheral blood at the point of admission (left 2 graphs) or in the patients within 24 hours after PCI was performed (right 2 graphs) with Pearson’s correlation test. Data are presented as mean ± SD. *P < 0.05; ****P < 0.0001 by 1-way ANOVA with Tukey’s correction for multiple comparisons (D) or unpaired, 2-tailed Student’s t test (F). NS, not significant.

References

    1. Heusch G. Myocardial ischaemia-reperfusion injury and cardioprotection in perspective. Nat Rev Cardiol. 2020;17(12):773–789. doi: 10.1038/s41569-020-0403-y. - DOI - PubMed
    1. Lavandero S, et al. Autophagy in cardiovascular biology. J Clin Invest. 2015;125(1):55–64. doi: 10.1172/JCI73943. - DOI - PMC - PubMed
    1. Prabhu SD, Frangogiannis NG. The biological basis for cardiac repair after myocardial infarction: from inflammation to fibrosis. Circ Res. 2016;119(1):91–112. doi: 10.1161/CIRCRESAHA.116.303577. - DOI - PMC - PubMed
    1. Rock KL, Kono H. The inflammatory response to cell death. Annu Rev Pathol. 2008;3:99–126. doi: 10.1146/annurev.pathmechdis.3.121806.151456. - DOI - PMC - PubMed
    1. Ong SB, et al. Inflammation following acute myocardial infarction: Multiple players, dynamic roles, and novel therapeutic opportunities. Pharmacol Ther. 2018;186:73–87. doi: 10.1016/j.pharmthera.2018.01.001. - DOI - PMC - PubMed

Publication types

MeSH terms

Substances