. 2021 Dec 22;6(24):e142909.
doi: 10.1172/jci.insight.142909.

Overexpression of PD-1 on T cells promotes tolerance in cardiac transplantation via ICOS-dependent mechanisms

Affiliations

Overexpression of PD-1 on T cells promotes tolerance in cardiac transplantation via ICOS-dependent mechanisms

Thiago J Borges et al. JCI Insight. .

Abstract

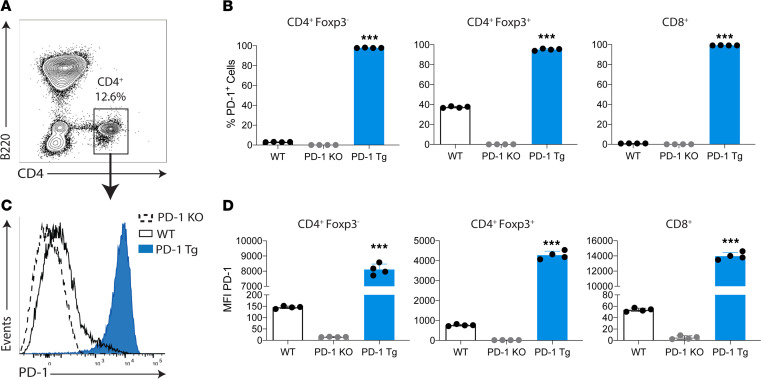
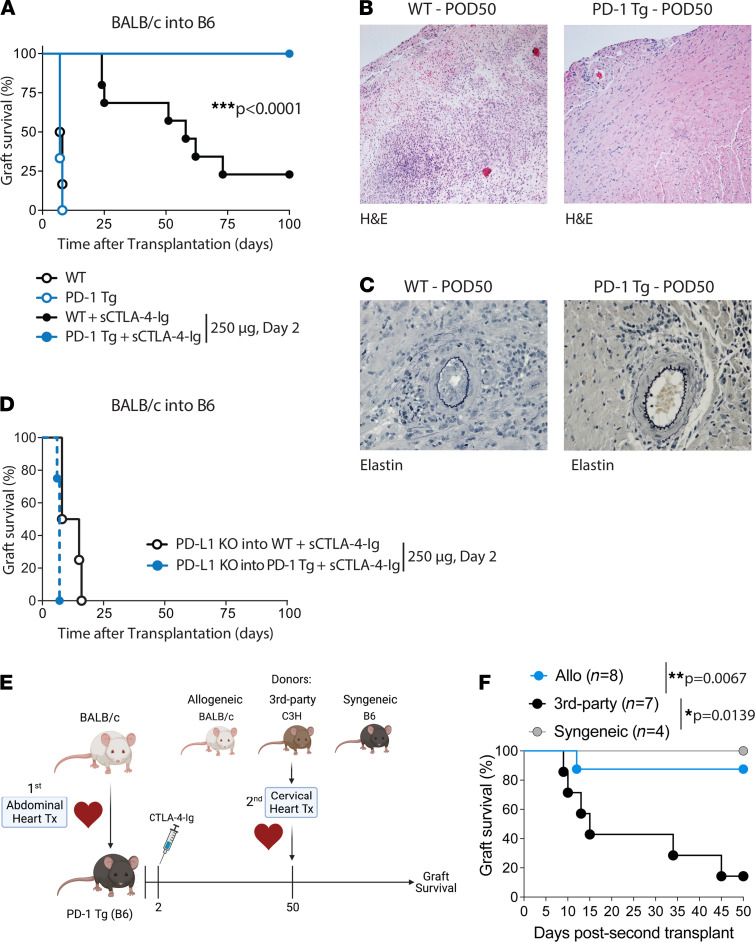
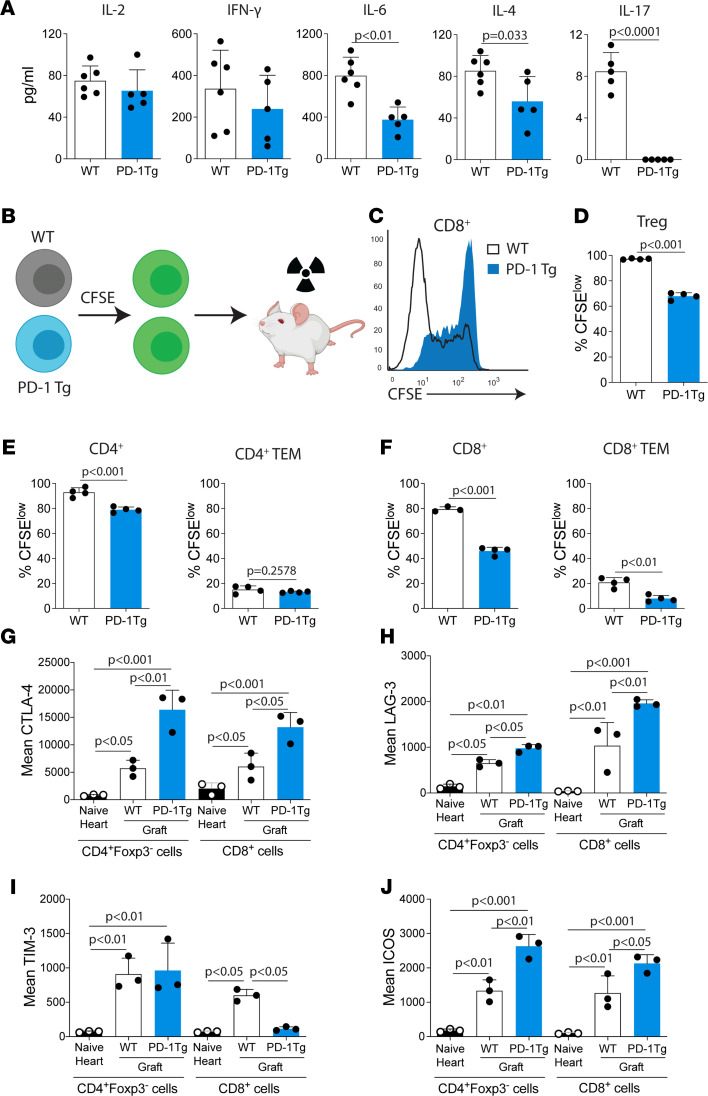
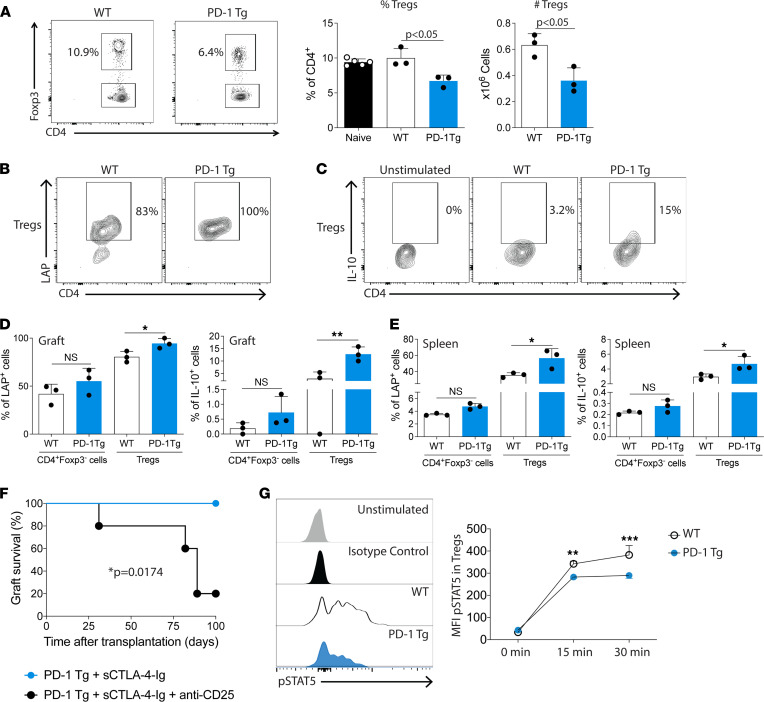
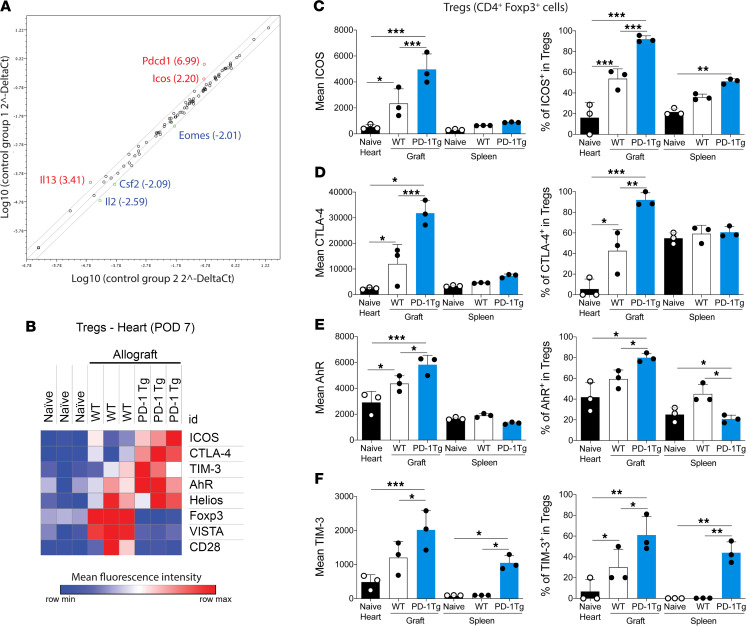
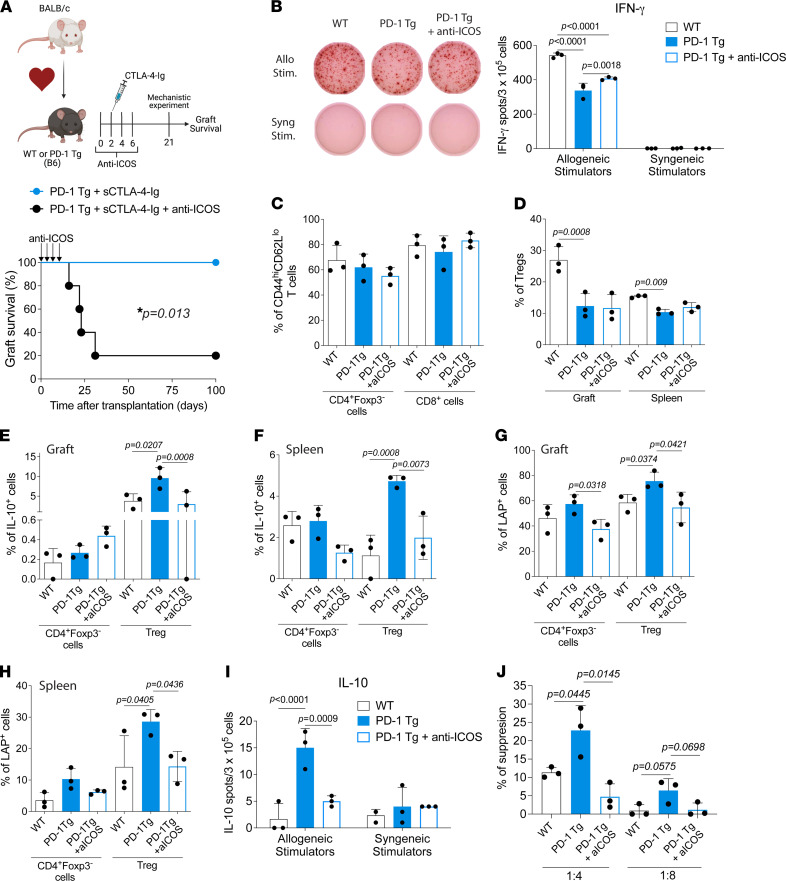
The programmed death 1/programmed death ligand 1 (PD-1/PD-L1) pathway is a potent inhibitory pathway involved in immune regulation and is a potential therapeutic target in transplantation. In this study, we show that overexpression of PD-1 on T cells (PD-1 Tg) promotes allograft tolerance in a fully MHC-mismatched cardiac transplant model when combined with costimulation blockade with CTLA-4-Ig. PD-1 overexpression on T cells also protected against chronic rejection in a single MHC II-mismatched cardiac transplant model, whereas the overexpression still allowed the generation of an effective immune response against an influenza A virus. Notably, Tregs from PD-1 Tg mice were required for tolerance induction and presented greater ICOS expression than those from WT mice. The survival benefit of PD-1 Tg recipients required ICOS signaling and donor PD-L1 expression. These results indicate that modulation of PD-1 expression, in combination with a costimulation blockade, is a promising therapeutic target to promote transplant tolerance.

Keywords: Costimulation; Immunology; T cells; Tolerance; Transplantation.


Conflict of interest statement

Conflict of interest: The authors have declared that no conflict of interest exists.

Figures

Figure 1
Figure 1. T cell–specific PD-1 overexpression in PD-1 Tg mice.
(A and B) Percentage of PD-1expressing CD4+Foxp3, CD4+Foxp3+, and CD8+ T cells of WT, PD-1–KO, and PD-1 Tg mice. (C) Representative histograms of PD-1 expression on Tregs and (D) PD-1 MFI on CD4+ Tconv, Tregs, and CD8+ T cells of WT, PD-1–KO, and PD-1 Tg mice. n = 4 mice/group. Representative data of 5 independent experiments are presented. For all panels, the bar graphs represent mean ± SD. ***P < 0.001 (1-way ANOVA with Bonferroni post hoc test).
Figure 2
Figure 2. A single dose of CTLA-4–Ig induced tolerance in PD-1 Tg recipient and depends on PD-L1 expression by donor cells.
(A) Kaplan-Meier curves of allograft survival of fully MHC-mismatched cardiac transplants; BALB/c hearts were transplanted into WT or PD-1 Tg C57BL/6 recipients with or without a single dose of CTLA-4–Ig (250 μg on day 2 after transplant). In the presence of CTLA-4–Ig, allograft survival was significantly prolonged in the PD-1 Tg group, according to log-rank test, when compared with the WT group (n = 6/group). Representative histology of cardiac allografts retrieved from WT or PD-1 Tg mice (treated with sCTLA-4–Ig on day 2) on day 50 after transplant and stained with (B) H&E (magnification, ×20) and (C) elastin (magnification, ×40). PD-1 Tg recipients had a normal tissue architecture, minimal lymphocyte infiltration. and minimal intimal proliferation (n = 6/group; magnification, ×40). (D) Kaplan-Meier curves of allograft survival of PD-L1–KO hearts (BALB/c hearts) transplanted into WT or PD-1 Tg C57BL/6 mice with a single dose of 250 μg of CTLA-4–Ig on day 2. (E) Schematic experimental design of abdominal and cervical heart cotransplantation in PD-1 Tg mice. PD-1 Tg recipients (H-2b) were transplanted with abdominal BALB/c hearts (H-2d) and treated with 250 μg of CTLA-4–Ig at day 2 after transplant. Fifty days later, the same animals were cervically implanted with BALB/c (H-2d; allo), C3H (H-2k; third-party) or B6 (H-2b; syngeneic) hearts (n = 4–8/group). The grafts were assessed by monitoring palpitation for the following 50 days. Cartoon created with BioRender.com. (F) Kaplan-Meier survival curves of the second cardiac grafts for each group. P values determined by log-rank test. Allo, allogeneic; POD, postoperative day; Tx, transplant. *P < 0.05; **P < 0.01; ***P < 0.001.
Figure 3
Figure 3. PD-1 Tg T cells are less primed and proliferate significantly less in vivo in response to allostimulation.
(A) WT or PD-1 Tg splenocytes were harvested at 14 days after cardiac allograft transplants and 1 dose of CTLA-4–Ig and then cocultured with allogeneic, irradiated, donor-type stimulator cells for 72 hours. Cytokine production in the culture supernatant was measured using the Luminex assay. n = 5–6 mice/group. P values determined by t test. Data are shown from 1 representative experiment of 3 independent experiments. (B) Modified graft-versus-host disease (GVHD) model in which WT or PD-1 Tg splenocytes were labeled with CFSE and adoptively transferred into sublethally irradiated BALB/c mice. Cartoon created with BioRender.com. (C) Representative CFSE histograms of CD8+ cells by flow cytometry 72 hours after adoptive transfer (lower CFSE signal is a marker of greater cell proliferation). PD-1 Tg compared with WT percentages of (D) CFSElo Tregs, (E) CD4+, and (F) CD8+ T cells. n = 4 animals/group. P values in D determined by t test. Expression of (G) CTLA-4, (H) LAG-3, (I) TIM-3, and (J) ICOS in graft-infiltrating CD4+ Tconv (defined as CD4+Foxp3 T cells) and CD8+ T cells from WT or PD-1 Tg recipients on day 7 after transplant (1 dose of CTLA4-Ig on day 2). n = 3 animals/group. P values determined by 1-way ANOVA with Tukey post hoc test. Data are representative of 4 independent experiments. For all panels, the bar graphs represent mean ± SD. TEM, T effector memory cells.
Figure 4
Figure 4. Comparison of WT and PD-1 Tg Tregs in allogeneic transplant recipients.
WT or PD-1 Tg recipients of fully MHC-mismatched cardiac transplantation received a single dose of CTLA-4–Ig (250 μg/mouse, i.p.) on day 2 after transplantation. (A) Seven days after heart transplants, WT and PD-1 Tg splenocyte populations were analyzed by flow cytometry. Tregs (CD4+Foxp3+ cells) were significantly reduced in the PD-1 Tg group (n = 3–5/group) according to 1-way ANOVA with Tukey post hoc test. Data are representative of 4 independent experiments. (B) Representative contour plots of LAP expression and (C) IL-10 production by WT or PD-1 Tg graft-infiltrating Tregs (CD4+Foxp3+ cells). Percentage of LAP+ or IL-10+ (D) infiltrating or (E) splenic Tconv (CD4+Foxp3 cells) and Tregs from WT or PD-1 Tg heart recipients. Data are representative of 2 independent experiments (n = 3 animals/group). Data were analyzed using a 1-way ANOVA with Tukey post hoc test. *P < 0.05, **P < 0.01. For all panels, the bar graphs represent mean ± SD. (F) Allograft survival of BALB/c heart allografts transplanted to PD-1 Tg C57BL/6 mice treated with a single dose of CTLA-4–Ig (250 μg on day 2 after transplant). One group received 100 μg of anti-CD25 Ab on days –7 and –1, which impaired the survival induced by sCTLA-Ig treatment (n = 5 per group; *P = 0.0174). (G) Expression of phosphorylated-STAT5 (pSTAT5) in WT and PD-1 Tg Tregs stimulated with IL-2 (5 ng/mL) for 15 or 30 minutes to induce the expression of pSTAT5 (MFI was obtained by flow cytometry). Experiments were performed in triplicate with a pool of 3 mice and were analyzed using a 2-way ANOVA with Sidak post hoc test. **P < 0.01, ***P < 0.001 versus PD-1 Tg mice.
Figure 5
Figure 5. ICOS is upregulated in Tregs from PD-1 Tg recipients treated with CTLA-4–Ig.
(A) Volcano plot representing differential expressed genes in flow-sorted PD-1 Tg versus WT Tregs from naive animals. (B) Heatmap representing the expression of costimulatory and coinhibitory molecules by graft-infiltrating Tregs on day 7 after transplant. Mean expression (left panel) of (C) ICOS, (D) CTLA-4, (E) AhR, and (F) TIM-3 by Tregs, and percentages of (C) ICOS+, (D) CTLA-4+, (E) AhR+, and (F) TIM-3+ Tregs isolated from native hearts, cardiac allografts, or spleens on day 7 after transplant. (C–F) n = 4–5 mice per group. *P < 0.05, **P < 0.01, ***P < 0.001, by t test with multiple testing correction using the Holm-Sidak method; α = 0.05, n = 3 t tests. For all panels, the bar graphs represent mean ± SD. POD, postoperative day.
Figure 6
Figure 6. Induction of tolerance in PD-1 Tg recipients treated with CTLA-4–Ig is ICOS dependent.
(A) Graft survival in PD-1 Tg recipients treated with a single dose of CTLA-4–Ig with or without transient ICOS blockade (days 0, 2, 4, and 6 after transplant). Rat IgG2b was used as an isotype control. Long-term survival of PD-1 Tg recipients was abolished upon the interruption of ICOS signaling. (n = 5 per group; *P < 0.013). (B) T cells from the spleen were magnetically isolated and cultured with allogeneic (allo; B6) or syngeneic (syng; BALB/c) irradiated splenocytes for 24 hours in anti-mouse IFN-γ–coated plates. IFN-γ production by T cells was measured by ELISPOT (number of spots per million T cells ± SD in triplicate). Statistics using 1-way ANOVA with Tukey post-test. Representative results of 2 independent experiments. (CH) Twenty-one days after heart transplants, splenocytes and allograft populations from WT and PD-1 Tg animals and PD-1 Tg animals treated with anti-ICOS were analyzed by flow cytometry. (C) Frequency of intragraft effector memory cells (CD44hiCD62Llo) in Tconv (CD4+Foxp3 cells) and CD8+ T cell populations at day 21 after transplant. (D) Frequency of graft-infiltrating and splenic Tregs (CD4+Foxp3+ cells). LAP expression and IL-10 production by (E and G) graft-infiltrating or (F and H) splenic Tconv (CD4+Foxp3 cells) and Tregs from WT, PD-1 Tg controls, or PD-1 Tg mice treated with anti-ICOS. Data are representative of 2 independent experiments (n = 3 animals/group). Data were analyzed using 1-way ANOVA with Tukey post hoc test. (I) T cells from the spleen were magnetically isolated and cultured with allo (B6) or syng (BALB/c) irradiated splenocytes for 48 hours in anti-mouse IL-10–coated plates. IL-10 production by T cells was measured by ELISPOT (number of spots per million T cells ± SD in triplicate). Data were analyzed by 1-way ANOVA with Tukey post hoc test. Representative results of 2 independent experiments are presented. (J) Flow-sorted splenic CD4+ Foxp3-GFP+ Tregs were isolated from recipients as described in A, and incubated in varying ratios (i.e., 1:4, 1:8) ex vivo with CD4+Foxp3-GFP (Tconv) isolated from WT mice and stimulated with anti–CD3/CD28–conjugated beads for 72 hours. For all panels, the bar graphs represent mean ± SD.

References

    1. Keir ME, et al. PD-1 and its ligands in tolerance and immunity. Annu Rev Immunol. 2008;26:677–704. doi: 10.1146/annurev.immunol.26.021607.090331. - DOI - PMC - PubMed
    1. Riella LV, et al. Role of the PD-1 pathway in the immune response. Am J Transplant. 2012;12(10):2575–2587. doi: 10.1111/j.1600-6143.2012.04224.x. - DOI - PMC - PubMed
    1. Murakami N, Riella LV. Co-inhibitory pathways and their importance in immune regulation. Transplantation. 2014;98(1):3–14. doi: 10.1097/TP.0000000000000169. - DOI - PubMed
    1. Schildberg FA, et al. Coinhibitory pathways in the B7-CD28 ligand-receptor family. Immunity. 2016;44(5):955–972. doi: 10.1016/j.immuni.2016.05.002. - DOI - PMC - PubMed
    1. Sharpe AH, Pauken KE. The diverse functions of the PD1 inhibitory pathway. Nat Rev Immunol. 2018;18(3):153–167. doi: 10.1038/nri.2017.108. - DOI - PubMed

Publication types

Substances