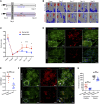
. 2022 Jan 4;132(1):e142260.
doi: 10.1172/JCI142260.

Tryptophan metabolites suppress the Wnt pathway and promote adverse limb events in chronic kidney disease

Affiliations

Tryptophan metabolites suppress the Wnt pathway and promote adverse limb events in chronic kidney disease

Nkiruka V Arinze et al. J Clin Invest. .

Abstract

Chronic kidney disease (CKD) imposes a strong and independent risk for peripheral artery disease (PAD). While solutes retained in CKD patients (uremic solutes) inflict vascular damage, their role in PAD remains elusive. Here, we show that the dietary tryptophan-derived uremic solutes including indoxyl sulfate (IS) and kynurenine (Kyn) at concentrations corresponding to those in CKD patients suppress β-catenin in several cell types, including microvascular endothelial cells (ECs), inhibiting Wnt activity and proangiogenic Wnt targets in ECs. Mechanistic probing revealed that these uremic solutes downregulated β-catenin in a manner dependent on serine 33 in its degron motif and through the aryl hydrocarbon receptor (AHR). Hindlimb ischemia in adenine-induced CKD and IS solute-specific mouse models showed diminished β-catenin and VEGF-A in the capillaries and reduced capillary density, which correlated inversely with blood levels of IS and Kyn and AHR activity in ECs. An AHR inhibitor treatment normalized postischemic angiogenic response in CKD mice to a non-CKD level. In a prospective cohort of PAD patients, plasma levels of tryptophan metabolites and plasma's AHR-inducing activity in ECs significantly increased the risk of future adverse limb events. This work uncovers the tryptophan metabolite/AHR/β-catenin axis as a mediator of microvascular rarefaction in CKD patients and demonstrates its targetability for PAD in CKD models.

Keywords: Chronic kidney disease; Nephrology; Vascular Biology.


Figures
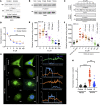
Figure 1
Figure 1. Uremic serum and IS downregulate Wnt/β-catenin signaling in ECs.
(A). Primary human microvascular ECs exposed to 5% pooled uremic or control sera. Equal amounts of protein were probed for β-catenin and separately for active β-catenin. Actin served as a loading control. Representative images from 3 independent experiments each done in duplicate are shown. (B) Representative images of 3 independent experiments of ECs treated with water-soluble uremic toxins. Con, control; Creat, creatinine; Oxalic, oxalic acid; Homo, homocysteine. (C). ECs pretreated with 5% of control serum and spiked with IS underwent fractionation. Tubulin and fibrillarin served as markers of fractions and loading controls. Representative images from 4 independent experiments. (D) β-Catenin was normalized to loading controls for their fractions. Average of 4 independent experiments is shown. Error bars show SD. The cytosol and nuclear fractions were analyzed separately and compared with the control (IS = 0 μM) using Student’s t test with Bonferroni’s correction of multiple comparisons. ***P < 0.001. (E) Serum-starved ECs expressing LS were treated with IS-spiked control human serum. Scatter plot of luciferase activity from 2 independent experiments done in quadruplet is shown. The horizontal line in each group corresponds to the median. The blue dotted line corresponds to IS levels in different CKD stages (Supplemental Table 2). A linear regression was performed. (F) Luciferase activity assay was performed as above in ECs treated with Wnt3a and IS spiked control human sera. A scatter plot of 2 independent experiments done in quadruplet is shown. A linear regression was performed. (G) Serum-starved ECs pretreated with vehicle (PBS + 1% BSA) or Wnt3a (20 ng/mL medium) with IS (50 μM) were stained. Representative images of 100 ECs/group. Profile plots were generated. Note different y axis scales between IS-treated and control samples. Scale bars: 5 μm. (H) Fifty ECs/group were analyzed. The dot plot represents the integrated density of nuclear β-catenin normalized to the surface area of nucleus. The line corresponds to the median. Independent Student’s t tests were performed to compare the groups.***P = 0.003; ****P < 0.001.
Figure 2
Figure 2. IS augments polyubiquitination and degradation of β-catenin in ECs.
(A). qRT-PCR analysis of ECs treated with IS 50 μM or DMSO (control) for different times was performed. The average cycle threshold (Ct) values performed in triplicate are shown. Error bars show SD. (B). ECs were treated with IS or vehicle (Veh) (DMSO) for 24 hours and cycloheximide (30 μg/mL) for the indicated time. Representative images of 4 independent experiments are shown. (C) β-Catenin was normalized to actin and represented as the percentage of remaining β-catenin at each time point. Average of normalized β-catenin from 4 independent experiments is shown. Error bars show SD. Independent Student’s t tests were performed. IS treatment at each time point compared with that of vehicle-treated cells. *P = 0.03; **P = 0.001. (D) ECs pretreated with 5% control human serum and spiked with IS corresponding to the different human CKD stages. Cells were exposed to 10 μM MG132 overnight. Immunoprecipitation was performed. The blot was reprobed with anti–β-catenin antibody. Representative images of 3 independent experiments are shown. (E) Ubiquitinated β-catenin was normalized to immunoprecipitated β-catenin. Average of normalized ubiquitinated β-catenin from 3 experiments is shown. Student’s t test with Bonferroni’s correction was performed for multiple comparisons. Error bars show SD. **P = 0.01; ***P < 0.001, compared with vehicle-treated cells. Blue dotted lines show IS levels corresponding to different CKD stages (Supplemental Table 2). (F) ECs pretreated with pooled control or uremic sera were processed as above. Blot was reprobed for β-catenin. Representative images of 3 independent experiments are shown. (G) Average of normalized ubiquitinated β-catenin from 3 experiments is shown. Independent Student’s t tests were performed. Error bars show SD. ***P < 0.001.
Figure 3
Figure 3. IS downregulates β-catenin dependent on S33 residue in the degron motif.
(A) β-Catenin N terminus contains a degron motif that controls its degradation. Black asterisk marks β-catenin S33A. Myc-tagged truncations lack N terminus (delN) and C terminus (delC). (B) ECs pretransfected with Myc-tagged β-catenin WT or S33A were treated with IS. Representative images of 3 independent experiments. (C) ECs pretransfected with Myc-tagged delC or delN β-catenin were treated with IS. Representative images of 3 independent experiments. (D) ECs transfected with WT β-catenin were treated with IS (50 μM) and cycloheximide (30 μg/mL) for indicated times. Average of normalized β-catenin from 4 independent experiments is shown. Error bars show SD. Independent Student’s t tests were performed at different time points. **P = 0.01; *P = 0.04. (E) Half-life study of Myc-tagged β-catenin S33A was performed as above from 4 independent experiments. Error bars show SD. (F) ECs pretransfected with Myc-tag β-catenin WT or S33A were treated with 50 μM IS and 10 μM MG132 before harvest. Immunoprecipitation was performed. Lysates were probed separately with anti-Myc-tag antibody. Representative images of 3 independent experiments are shown. (G) ECs stably expressing LS and Fu LS constructs were cotransfected with Myc-tagged WT or S33A β-catenin and were treated with IS or DMSO followed by a luciferase assay. Average of 3 experiments done in triplicate is shown. Error bars show SD. Independent Student’s t tests were performed. *P = 0.043; **P = 0.003; #P <0.0001. (H) ECs stably expressing LS and FuLS constructs were cotransfected with Myc-tagged WT and increasing amounts of S33A β-catenin (shown as + and ++ marks). Expression of β-catenin WT or S33A was confirmed (Supplemental Figure 5E). Average of 3 experiments done in triplicate is shown. Error bars show SD. Independent Student’s t tests were performed. **P = 0.002; #P = 0.001.
Figure 4
Figure 4. Uremic serum and uremic solutes mediate Wnt/β-catenin suppressive effect through AHR signaling.
(A) AHR KI and KO MEFs treated with pooled 5% control or uremic sera. Their nuclear fractions were probed. Representative images of 3 independent experiments are shown. (B) Average of normalized nuclear β-catenin from 3 experiments is shown. Independent Student’s t tests were performed. Error bars show SD. ##P = 0.032; ***P = 0.006. (C) ECs knocked out of AHR (AHR CRISPR) were treated with IS. Representative images of 3 independent experiments are shown. (D) Average of normalized β-catenin from 3 independent experiments. Bars show SEM. Student’s t test was performed. **P = 0.037; ###P < 0.001. (E) Representative images of nuclear fractions of ECs treated with 5% pooled uremic serum with CH223191 from 3 independent experiments are shown. (F) Average of normalized β-catenin from 3 experiments is shown. Student’s t test with Bonferroni’s correction was performed for multiple comparisons. Error bars show SD. **P = 0.004; ***P < 0.001. (GI) ECs expressing LS were treated with IS and 20 ng/mL Wnt3a with or without 20 μM CH223191 (G), with Kyn and Wnt3a 20 ng/mL with or without 20 μM CH223191 (H), with 5% pooled control or uremic serum with CH223191. ***P = 0.01; ##P = 0.041 (G). ***P = 0.001, *P = 0.025 (H). (I) Averages for 6 independent repeats in each figure are shown. Error bars show SEM. ANOVA test was performed to compare groups (P < 0.001). #P = 0.01; **P = 0.01; ***P = 0.001. Pairwise comparisons with Tukey’s multiple comparison procedure were performed.
Figure 5
Figure 5. IS suppressed postischemic angiogenesis and β-catenin expression in mice.
(A) A group of 8- to 12-week-old C57BL/6 female mice were initiated on probenecid (n = 7) or probenecid plus IS (n = 7) and underwent HLI followed by harvest after 5 days. (B) Representative images of the posterior calf muscles from the ligated limbs of mice stained for α-actin and CD31. Total of 30 images per group (n = 7 mice/group). Insets show myocyte with surrounding capillaries. Scale bars: 25 μm. Original magnification ×400. (C) Integrated density of CD31+ was normalized to that of α-actin and presented as a ratio. A total of 30 images from 7 mice/group are represented, and the line represents the median. Student’s t test was performed. ***P = 0.001. (D) Lysates of posterior calf muscles of the ligated limb of mice were probed. Representative immunoblots from 3 separate mice from each group (n = 7 mice/group). (E) Normalized β-catenin in muscle lysates is presented in box-and-whisker plot. Student’s t test was performed. **P = 0.007. (F) Four to five random images of posterior calf muscles from the ligated limbs of mice were stained for β-catenin and CD31. Insets show a myocyte with β-catenin with surrounding capillaries. Blue dotted line represents ROI of a muscle surrounded by capillaries, and white dotted line represents the ROI of a muscle. White asterisk corresponds to β-catenin in a muscle. White arrowhead is directed to β-catenin in the capillary. Scale bars: 25 μm. Original magnification, ×400. (G) First, the integrated density was estimated from the ROI of area surrounded by blue dotted line (β-catenin in a muscle with surrounding capillary). Next, the integrated density was analyzed only from area surrounded by white dotted line (β-catenin in muscles). Their differences correspond to β-catenin in the capillaries. The integrated densities of capillaries and muscles from 30 random images (n = 7 mice/group) are shown. Lines represent the median. Student’s t test was performed. ***P < 0.001; *P = 0.05.
Figure 6
Figure 6. IS-specific solute mouse model shows suppressed VEGF-A expression and angiogenic phenotype in an IS- and AHR-dependent manner.
(A) Representative from 30 random images (n = 7 mice/group) of the posterior calf muscles from the ligated limbs were stained. Insets show a representative myocyte with surrounding capillaries. White arrowheads correspond to VEGF or CD31. Scale bars: 25 μm. Original magnification, ×400. (B) Integrated density of VEGF-A and CD31 were estimated from 30 images from each group (n = 7 mice/group). Lines represent the median. Student’s t test was performed. ***P = 0.001. (CE) Correlations between IS levels and capillary density (CD31/SMA+) (C) and normalized β-catenin in capillaries (D) and normalized VEGF-A in the ischemic limb of IS-exposed mice (n = 7) (E). (F and G) ECs expressing XRE-responsive promoter (F) or LS (G) treated with sera from mice from 2 groups (n = 7/group). Lines correspond to median. Student’s t test was performed. ***P < 0.001. (H and I) Correlation between EC Wnt and AHR activity in response to sera from IS-exposed mice (H) and IS levels and EC Wnt activity in response to sera from these mice n = 7 (I).
Figure 7
Figure 7. Adenine-induced CKD model shows compromised angiogenesis and β-catenin expression in the ligated limb of mice.
(A) A group of 8- to 12-week-old C57BL/6 female mice on a 0.2% adenine diet (n = 10) or the control diet (n = 10) underwent HLI and mice were harvested at the end of 21 days. (B) Representative laser doppler images of mouse hind paws. n = 10 mice/per group. (C) Average perfusion ratios. Error bars show SD. Independent Student’s t tests were applied to compare 2 groups at each time point. *P = 0.05; ***P < 0.001; #P = 0.002. (D) Three random images from stained posterior calf muscles of the ligated limbs of each mouse (n = 10 mice/group). Insets represent myocytes, where white arrowheads are directed at α-actin expression. Scale bars: 25 μm. Original magnification ×400. (E) Averages of the normalized integrated density of CD3 to α-actin per image described in Figure 6D are shown. Lines represent median. Student’s t test was performed. ***P < 0.001. (F) Three random images of stained posterior calf muscles of the ligated limb per mouse (n = 10 mice/group). Insets show a myocyte stained with β-catenin with surrounding capillaries. Blue dotted lines represent ROI of a myocyte and capillaries; white dotted lines represent ROI of a myocyte. White asterisks correspond to β-catenin in a myocyte. White arrowheads are directed to β-catenin in a capillary. Scale bars: 25 μm. Original magnification ×400. (G) Normalized integrated densities of β-catenin of muscles and capillaries obtained from 30 random images per group (n = 10 mice/group). Lines represent median. Student’s t test was performed. For capillary ***P < 0.001 and for muscle ***P = 0.001.
Figure 8
Figure 8. Adenine-induced CKD model shows suppressed VEGF-A and angiogenic response in an IS- and AHR-dependent manner.
(A) Representative images from 3 randomly taken images per mouse (n = 10 mice/group). Insets show representative myocytes with white arrowheads directed to VEGF or CD31. Scale bars: 25 μm. Original magnification ×400. (B) The integrated densities of normalized VEGF-A from images obtained from Figure 6H. Lines represent median. Student’s t test was performed. ***P = 0.003. (CE) Correlations between IS levels and histological parameter in the ischemic limb of CKD mice (n = 10). (F and G) Correlations between EC Wnt activity in response to sera from CKD mice and their IS levels (F) and the capillary density in CKD mice and AHR activity in ECs in response to sera from these mice (G). n = 10.
Figure 9
Figure 9. AHR inhibition normalizes postischemic angiogenesis in CKD mice to a non-CKD level.
(A) A group of C57BL/6 female mice on a 0.2% adenine diet (n = 16) or the control diet (n = 16) for 7 days underwent HLI. The mice were randomized to 2 groups (n = 8/group) and initiated on DMSO or CH223191 for 5 days on and 2 days off for 2 weeks. (B) Average perfusion ratios. n = 8 mice/group. Error bars show SD. Independent Student’s t tests were applied at each time point. The dotted line in this graph and subsequent figures corresponds to the respective values of mice on normal diet. **P = 0.04 for day 14; ***P = 0.001 for day 21. (C) Representative stained images from 3 random images per mouse (n = 8 mice/group) of the posterior calf muscles from ligated limbs of mice. Insets represent myocytes. White arrowhead is directed at α-actin expression. Scale bar: 25 μm. Original magnification ×400. (D) Integrated density of CD31 normalized to α-actin described in Figure 7C. Line represents median value. Student’s t test was performed. ***P < 0.001. (E) Representative stained images from 3 random images per mouse (n = 8 mice/group) of the posterior calf muscles from ligated limbs of mice. Insets show a representative myocyte stained with β-catenin along with surrounding capillaries. Blue dotted lines represent ROI of a myocyte and capillaries; and white dotted lines represent ROI of a myocyte. White asterisks correspond to β-catenin in a myocyte. White arrowheads are directed to β-catenin in the capillary. Scale bars: 25 μm. Original magnification ×400. (F) The integrated densities of normalized β-catenin in muscles and capillaries from 8 mice per group. Lines represent median. Student’s t test was performed. For capillary ###P = 0.002 and skeletal muscle ***P = 0.007.
Figure 10
Figure 10. AHR inhibition improves angiogenic response in CKD mice.
(A) Representative images of the posterior calf muscles from ligated limbs of mice from 3 random images per mouse (n = 8 mice/group). Insets show myocytes with white arrowheads directed to VEGF or CD31. Scale bars: 25 μm. Original magnification ×400. (B) The integrated density of normalized VEGF-A to CD31 from images in Figure 7G. Line represents median. Student’s t test was performed. ***P < 0.001. (C) ECs expressing XRE promoter luciferase reporter were treated with 1% sera from adenine-treated mice with or without CH223191. Average for 6 luciferase-independent repeats is shown. Error bars show SEM. Student’s t test was performed. AHR activity. ***P < 0.001. (D) ECs expressing LS were treated with 1% sera from mice from both groups. Average for 6 independent repeats of Wnt activity is shown. Error bars show SEM. Student’s t test was performed. ***P < 0.001. (E) Correlation between AHR activity and Wnt activity in ECs in response to sera from adenine-treated mice with or without CH223191. (F) A correlation between the EC AHR activity in response to the sera from mice listed in Figure 9A and their capillary density in muscles of ligated limb.

Comment in

References

    1. Sampson UK, et al. Global and regional burden of death and disability from peripheral artery disease: 21 world regions, 1990 to 2010. Glob Heart. 2014;9(1):145–158. doi: 10.1016/j.gheart.2013.12.008. - DOI - PubMed
    1. Fowkes FG, et al. Peripheral artery disease: epidemiology and global perspectives. Nat Rev Cardiol. 2017;14(3):156–170. doi: 10.1038/nrcardio.2016.179. - DOI - PubMed
    1. Farber A. Chronic limb-threatening ischemia. N Engl J Med. 2018;379(2):171–180. doi: 10.1056/NEJMcp1709326. - DOI - PubMed
    1. Arinze NV, et al. Unique aspects of peripheral artery disease in patients with chronic kidney disease. Vasc Med. 2019;24(3):251–260. doi: 10.1177/1358863X18824654. - DOI - PubMed
    1. Foley RN, et al. Chronic kidney disease and the risk for cardiovascular disease, renal replacement, and death in the United States Medicare population, 1998 to 1999. J Am Soc Nephrol. 2005;16(2):489–495. doi: 10.1681/ASN.2004030203. - DOI - PubMed

Publication types

MeSH terms